Emudhra Watchlist StockEmudhra's Triangle Breakout Drama: Why This Digital Security Stock Could Rally 15% from Current Levels
Price Action:
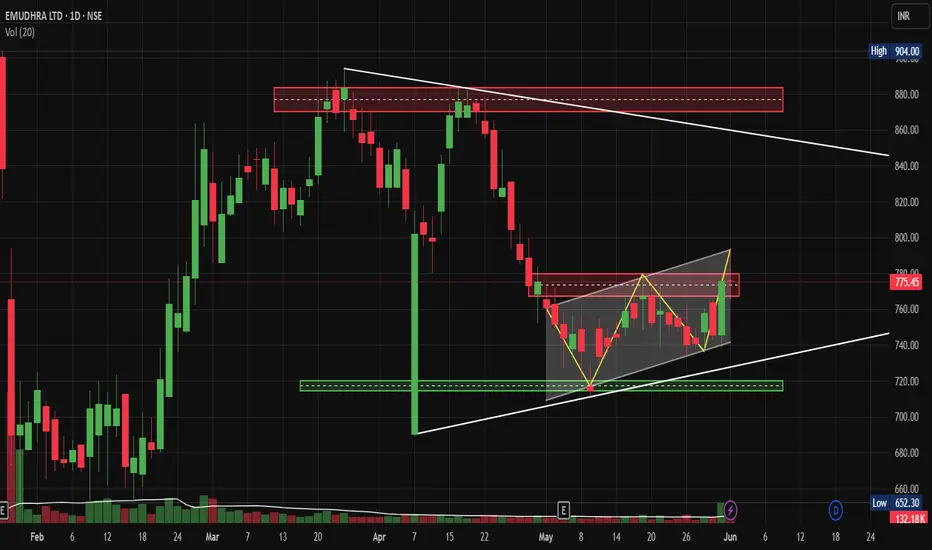
Looking at Emudhra's daily chart, we're witnessing a textbook technical setup that could offer substantial rewards for patient traders. The stock has been consolidating in a well-defined triangle pattern since late April, with price action compressed between converging trend lines around 720-780 levels.
The current price action shows Emudhra testing the upper boundary of this Wedge formation at approximately 775-780 resistance zone. What's particularly interesting is how the stock has maintained its position above the key psychological level of 750, suggesting underlying strength despite the recent market volatility.
Volume Action:
From a volume perspective, we've seen relatively subdued activity during this consolidation phase, which is typical behaviour within triangle patterns. However, any breakout above 780 with accompanying volume surge would validate the bullish continuation thesis.
The base formation here spans roughly 6-8 weeks, providing sufficient time for weak hands to exit and strong accumulation to occur. Support levels are clearly defined at 720 (triangle lower boundary) and 700 (psychological support), while immediate resistance sits at 780, followed by the major level at 880.
The triangle pattern, combined with the stock's position above key moving averages, suggests a potential measured move target of around 850-870 levels, representing approximately 10-15% upside from current levels.
Trade Setup:
Entry: 782-785 on breakout with volume confirmation
Target 1: 820 (initial resistance)
Target 2: 850-870 (measured move target)
Stop Loss: 750 (below triangle support)
Risk-Reward Ratio: Approximately 1:2.5
Risk management is crucial here - the stop loss at 750 provides a reasonable buffer while maintaining favourable risk-reward dynamics. Traders should wait for a decisive breakout above 780 with at least 50% higher than average volume to confirm the pattern completion.
Sectoral Backdrop:
The digital security and cybersecurity sector has been gaining traction globally, with increasing digitization post-pandemic driving demand for authentication and security solutions. Emudhra operates in the digital trust space, providing digital signature solutions and PKI services, which positions it well for the ongoing digital transformation wave.
Fundamental Backdrop:
While technical analysis drives this setup, Emudhra's business fundamentals appear supportive, with the company's focus on digital identity solutions aligning with government initiatives like Digital India. The increasing adoption of digital signatures across various sectors provides a favourable operating environment for sustained growth.
Risk Factors:
Technical Risks:
- False breakout possibility if volume doesn't support the move
- A broader market correction could invalidate the pattern
- Failure to hold 750 support would signal a pattern failure
Fundamental Risks:
- Intense competition in the digital security space
- Regulatory changes affecting the business model
- Economic slowdown impacting enterprise spending
- Technology disruption in authentication methods
My Take:
The key catalyst to watch would be any major contract announcements or regulatory developments that could trigger the breakout. Given the tight consolidation and technical setup, this stock deserves a spot on active traders' watchlists for the coming weeks.
Keep in the Watchlist.
NO RECO. For Buy/Sell.
📌Thank you for exploring my idea! I hope you found it valuable.
🙏FOLLOW for more
👍BOOST if you found it useful.
✍️COMMENT below with your views.
Meanwhile, check out my other stock ideas on the right side until this trade is activated. I would love your feedback.
Disclaimer: "I am not a SEBI REGISTERED RESEARCH ANALYST AND INVESTMENT ADVISER."
This analysis is intended solely for informational and educational purposes and should not be interpreted as financial advice. It is advisable to consult a qualified financial advisor or conduct thorough research before making investment decisions.
Symmetrical Triangle
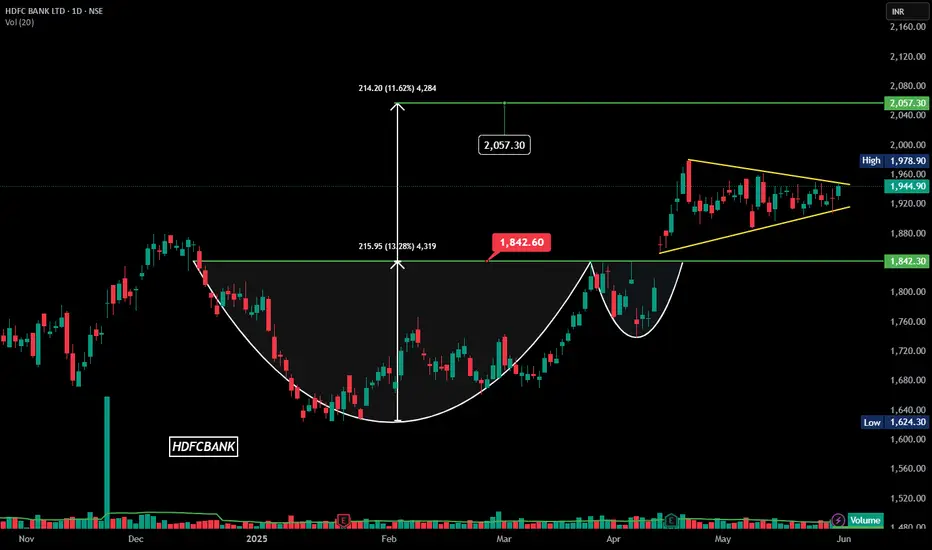
HDFCBANK | Symmetrical Triangle | Daily |Watchlist### **Technical Analysis of HDFC Bank Ltd. (NSE)**
The **daily candlestick chart** of **HDFC Bank Ltd.** highlights key technical patterns, suggesting potential bullish momentum.
### **Key Observations:**
1. **Cup and Handle Formation:**
- A well-defined **cup and handle** pattern is visible, indicating prolonged accumulation.
- Breakout above **1,960.00 INR** confirms bullish sentiment.
- **Projected Target:** **2,057.30 INR**, a **11.62% upside** from breakout.
2. **Symmetrical Triangle Breakout:**
- Price action consolidating within a **symmetrical triangle**, leading to breakout confirmation.
- Strong move above **1,944.90 INR**, validating upward momentum.
3. **Volume & Price Action:**
- **Volume:** **14.37M** surpassing 20-day moving average of **10.13M**, confirming strength.
### **Support & Resistance Levels:**
- **Support:** **1,842.00 INR**, acting as a key cushion in case of pullbacks.
- **Resistance:** **2,057.30 INR**, aligning with the measured move projection.
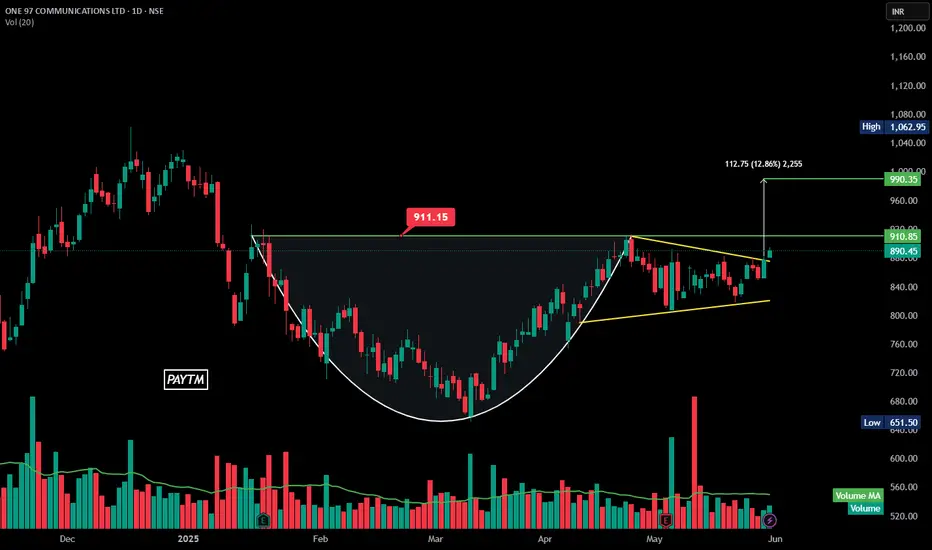
PAYTM | Symmetrical Triangle | Daily ### **Technical Analysis of Paytm (ONE 97 COMMUNICATIONS LTD - NSE)**
The chart highlights a **symmetrical triangle breakout**, signaling potential bullish momentum.
### **Key Observations:
**Symmetrical Triangle Formation:**
- The price oscillated between converging trendlines, forming a tightening range.
- The breakout above the upper trendline confirms bullish continuation.
**Cup and Handle Preceding the Breakout:**
- The earlier **cup and handle** pattern reinforced accumulation before the breakout.
**Breakout Confirmation:**
- **Resistance Level:** **911 INR**—a key level to watch.
- **Target Price:** **990.35 INR**, representing a **12.86% upside** from the breakout point.
**Volume Surge:**
- Increased trading activity during the breakout strengthens the validity of the move.
### **Indicators to Watch:**
- **RSI:58, it confirms strong buying momentum.
- **MACD:** A bullish crossover reinforces trend continuation.
- **Support Level:** **911 INR**—holding above this level strengthens the bullish case.
Multi-Month Triangle Breakout Can Signal Move to ₹750+NSE:TIPSMUSIC Made a Beautiful Chart Structure Today and Breaks Free of Multi-Month Triangle Breakout and Could Signal Explosive Move to ₹750+
Price Action Analysis:
NSE:TIPSMUSIC is currently trading at ₹676.80, up 3.68% (₹24.00) today. The stock has been consolidating in a narrowing range since January 2025, forming a classic symmetrical triangle pattern. After testing the lower support multiple times around ₹580-600, the stock is now approaching the apex of the triangle and showing signs of a potential upside breakout. The recent price action shows higher lows being formed, indicating growing buying interest at lower levels.
Volume Analysis:
Volume is healthy at 319.61K shares, significantly above the average of 192.25 K. The increased participation suggests growing interest as the stock approaches a crucial decision point. Volume patterns show consistent buying support during dips to the triangle's lower boundary, while recent sessions have seen upticks in volume accompanying the move higher.
Key Support & Resistance Levels:
- Immediate Resistance: ₹720-730 zone (upper triangle boundary and previous resistance)
- Major Resistance: ₹750-760 (prior swing high from December)
- Triangle Support: ₹580-600 zone (marked with green arrows - multiple successful tests)
- Key Support: ₹560-570 (breakdown level that would invalidate the pattern)
- Dynamic Resistance: Descending trendline from November highs
Technical Patterns:
1. Symmetrical Triangle: Well-defined triangle formation since January, with converging trendlines
2. Triple Bottom: Multiple successful tests of the ₹580-600 support zone (green arrows)
3. Ascending Triangle Element: The recent higher lows suggest buyers are becoming more aggressive
4. Compression Pattern: Decreasing volatility as price approaches the triangle apex, typically before significant moves
Trade Setup - Breakout Play:
Entry Strategy:
- Primary Entry: ₹695-700 on confirmed breakout above triangle resistance with volume
- Secondary Entry: ₹680-685 on any pullback to current levels (anticipatory entry)
Targets:
- First Target: ₹730-735 (immediate resistance)
- Second Target: ₹760-770 (measured move from triangle base)
- Final Target: ₹800-820 (extension target based on triangle height)
Risk Management:
- Stop Loss: ₹640 (below recent swing low and triangle support)
- Tight Stop: ₹660 for aggressive traders
- Position Size: Maximum 2% of portfolio at risk
Alternative Setup - Continuation Play
For conservative traders waiting for confirmation:
- Entry: ₹735-740 (after clearing first resistance zone)
- Stop Loss: ₹695 (below breakout level)
- Targets: ₹780, ₹820, ₹860
Risk-Reward Analysis:
- Primary Setup R:R = 1:2.5 (Entry ₹690, Stop ₹640, Target ₹770)
- The triangle pattern suggests a potential 15-20% move upon breakout
- A failed breakout risk exists if volume doesn't confirm the move
Key Catalysts to Watch:
The stock appears to be in the final stages of its triangle consolidation. A breakout above ₹720 with strong volume (above 400K shares) would confirm the pattern and likely trigger momentum buying. Conversely, a breakdown below ₹640 would invalidate the bullish setup and could lead to a test of ₹560-570 levels.
The decreasing volatility and tightening price range suggest a significant move is imminent. Given the multiple successful tests of support and the overall market context, the probability favours an upside resolution, making this an attractive risk-reward setup for both swing and position traders.
Traders should monitor volume closely on any breakout attempt, as genuine breakouts from triangle patterns typically require volume confirmation to sustain the move.
Keep in the Watchlist.
NO RECO. For Buy/Sell.
📌Thank you for exploring my idea! I hope you found it valuable.
🙏FOLLOW for more
👍BOOST if you found it useful.
✍️COMMENT below with your views.
Meanwhile, check out my other stock ideas on the right side until this trade is activated. I would love your feedback.
Disclaimer: "I am not a SEBI REGISTERED RESEARCH ANALYST AND INVESTMENT ADVISER."
This analysis is intended solely for informational and educational purposes and should not be interpreted as financial advice. It is advisable to consult a qualified financial advisor or conduct thorough research before making investment decisions.

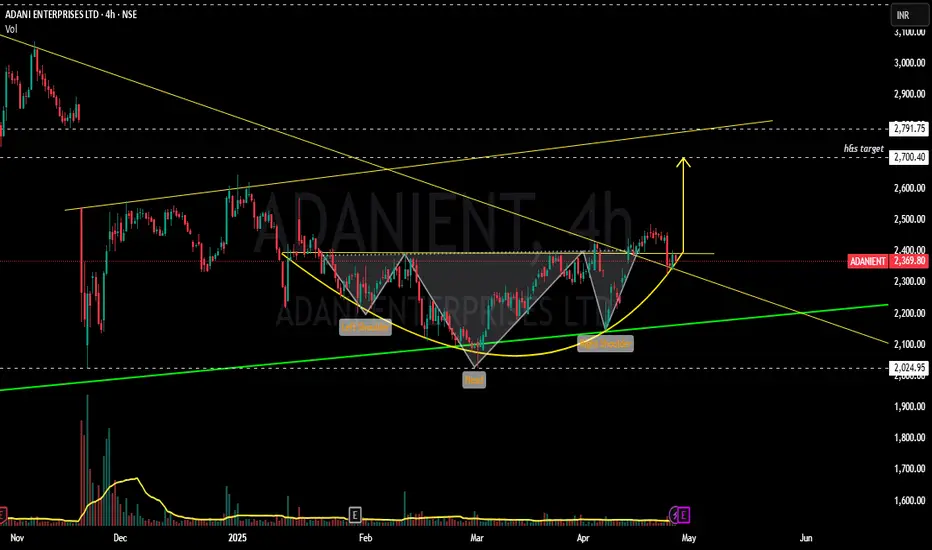
ADANIENT - Bulls getting ready to bump up ?????!!!Y essss!!! !
Chart patterns inculcating me the above titled opinion.
1. Monthly timeframe shows the symmetrical triangle pattern from 2020 till now, now the stock at support line(chart image shown below)
2. Weekly time frame shows us the INSIDE BAR candlestick pattern(mother baby pattern) with good volumes....with the low umtested till now.(made the low of 2025 on 22 nov 2024)
3. Daily time frame shows the Breakout attempt out of the 11 month old trendline.
4. Now, with the results on may 1, we can expect a volatile move.... .with the inverted h&s pattern around the corner.
Voluminous Entry can be made after the BREAKOUT WITH GOOD VOLUMES...
will update once the breakout happens.
Just add it to your watchlist and keep an eye on it.
THIS IS JUST MY OPINION..NOT A TIP NOR ADVICE.
Thank you .
CITY UNION BANK - Buy above 188₹BUY BUY BUY CUB - Dont miss opportunity if 188₹ levels are broken
Ascending triangles tend to be bullish as they indicate the continuation of an upward trend. In some cases, they may point to the reversal of a downtrend. A descending triangle is bearish. That's because it points to the continuation of a downtrend or the reversal of an uptrend.

Unlocking Breakouts with the Symmetrical Triangle PatternUnderstanding the Symmetrical Triangle Chart Pattern
Hello Traders!
Today, we’ll discuss one of the most powerful chart patterns used to predict breakout opportunities — the Symmetrical Triangle . This pattern is a sign of market consolidation, where price is moving within a narrowing range, and a breakout is expected once the price escapes from this converging trend.
The Symmetrical Triangle consists of two trendlines:
Ascending Trendline : Connecting the rising lows.
Descending Trendline : Connecting the falling highs.
Key Characteristics of the Symmetrical Triangle Pattern:
Consolidation Period : The price moves between the two trendlines, showing decreasing volatility.
Breakout : Once the price breaks above the upper trendline (ascending trendline) or below the lower trendline (descending trendline), it signals a strong trend continuation or reversal.
Volume Analysis : Volume usually decreases during the consolidation phase, followed by a surge in volume during the breakout, confirming the direction.
How to Trade the Symmetrical Triangle?
Entry Point : After the breakout occurs (above the ascending trendline or below the descending trendline), enter the trade in the direction of the breakout.
Stop Loss : Place a stop loss just below the breakout level to protect your position from false breakouts.
Target : The target can be estimated by measuring the height of the triangle from the base and projecting that distance from the breakout point.
Example of Symmetrical Triangle in Action
In the Godfrey Phillips India chart , we can see a Symmetrical Triangle forming between 2021 and 2023. The price broke out of the pattern in late 2022, giving traders a strong upward momentum. Based on the measured move, the target was met after a clear breakout above the ascending trendline , which resulted in a price rise of 42.37%.
Conclusion
The Symmetrical Triangle is a reliable continuation pattern that provides great trading opportunities. Make sure to watch for volume confirmation during the breakout, and always use a stop loss to protect yourself from unexpected reversals.
Happy Trading! 🚀📈

Pre and Post Breakout with Pattern trading I make educational content videos for swing / positional trading

3 Price action pattern for swing trading I daily make educational content videos for swing / positional trading

Paytm - CMP 950 - Monthly - Symmetrical Expanding TrianglePaytm has created Symmetrical Expanding Triangle in Monthly time frame
RSI going up continuously, still not in overbought zone
MACD is looking good
Price is above 20 Months EMA
volume is good for past 4-5 months
Crossed 930 resistance with good volume
DII has increased holding in June and Sep 2024, FII has decreased holdings
Target 1 : 1160++
Target 2 : 1350 , This could be next Resistance
if price sustain at 1350 and give breakout from triangle with good volume then Target 3 could be ATH - 1955++

KAYA LTD - Symmetrical Triangle - MonthlyKAYA LTD formed Symmetrical Triangle pattern on Monthly chart.
Formed symmetrical triangle and given breakout with very huge volume and retest done .
RSI is looking good and taking support
ROCE going minus every year since last 5-7 years :(
poor sales growth since last 5 years :(
FII's and DII's has increased their holding little bit since last 2 quarter.
What will happen next quarter ? will it go sideways or downtrend will start ?
Resistance1 : 505-511
Resistance 2 : 590-600
No Entry, No Targets until positive results or news coming :)

Double Symmetrical Triangle Breakout Plan in Navine FluorineI daily make educational content videos for swing / positional trading

Detailed Price action analysis and swing trading ideas for 8 JanI make educational content videos for swing / positional trading

TEXRAIL: Technical Signals Point to 20% PotentialThe chart provides a comprehensive overview of the key breakout levels and potential upward movement scenarios.
symmetrical triangle Breakout
RSI is above 60 and showing an upward trend
Surpass the hidden resistance and establish it as support
Disclaimer: The information contained in this technical analysis report is intended solely for informational and educational purposes. It should not be interpreted as financial advice or a recommendation to buy or sell any security. Investors are strongly encouraged to conduct their own research and consult with a qualified financial advisor before making any investment decisions.

GICRE Triangle Breakout 1DGICRE attempting to breakout from a triangle pattern on 1D timeframe. It is also forming a flag pattern on 1W timeframe. Enter after bullish confirmation.

DCAL: Symmetrical Triangle Pattern BreakoutDCAL has recently exhibited a noteworthy breakout from a symmetrical triangle pattern on the daily timeframe, accompanied by a corresponding increase in trading volume. The stock price has successfully breached the upper trendline of the symmetrical triangle, a development that is often indicative of bullish momentum. Such a breakout, supported by substantial volume, suggests a likely continuation of upward price movement.
The MACD signal line has crossed above the MACD line, a bullish signal that reinforces the potential for further upward price action. This crossover indicates increasing momentum and buying strength. The RSI is currently reading above 85, suggesting that the stock is in overbought territory. While this may indicate strong buying interest, it is also a signal to monitor for potential overextension in the price movement.
Based on the current technical indicators and chart patterns, a position around the price level of 194 . A stop-loss order is suggested at 180 to manage risk effectively. The target price for this trade is estimated at 223 , providing a favourable risk-reward ratio of approximately 1:2.
Disclaimer: This technical analysis report is provided for informational and educational purposes only. It should not be interpreted as financial advice or a recommendation to buy or sell any security. Individuals should conduct their own thorough research and/or consult with a financial advisor before making any investment decisions.

The Symmetrical Triangle: Real Success Rates + Breakout.The Symmetrical Triangle: Real Success Rates + Breakout.
The symmetrical triangle is an important chart pattern in technical analysis, deserving special attention from professional traders.
This formation is characterized by a convergence of prices between two trendlines, one descending and the other ascending, creating a consolidation zone where indecision between buyers and sellers is palpable.
Statistical Analysis
Empirical data reveals that the success rate of the symmetrical triangle for a trend continuation is approximately 54%. This percentage, although higher than 50%, underlines the importance of a cautious approach and rigorous risk management in using this pattern.
Breakout Point
The breakout of the symmetrical triangle usually occurs when the price has traveled approximately 75% of the distance to the apex. This point is crucial for traders, as it often represents the moment when volatility increases and a new trend can be established.
Risks and False Exits
It is essential to note that the symmetrical triangle has a relatively high rate of false exits. Statistics indicate that approximately 13% of cases in a bear market can result in a false exit to the bottom. This phenomenon underlines the need for additional confirmation before entering a position.
Strategy of use
To effectively exploit the symmetrical triangle, professional traders must:
-Identify the formation accurately.
-Wait for the breakout near the point of convergence of the trendlines.
-Confirm the breakout with other technical indicators or an increase in volume.
-Put in place strict risk management to protect against false exits.
In conclusion, the symmetrical triangle, although being a valuable tool in the trader's arsenal, requires a methodical approach and a thorough understanding of its characteristics to be used effectively in a trading strategy.

Symmetrical Triangle Setup With Consolidation about to BlastNSE:INDIGOPNTS on the Weekly timeframe is making a Symmetrical Triangle setup that can break on the upside because the price has been consolidated for the past 14 weeks in a Narrow Range after Getting Accumulated Near the Key Zone, Followed By a Volume Blast.
A Close or Breakout of the Setup Next Week will be confirmed if Followed by Similar Volumes.
Keep this on your Watchlist. Meanwhile, Check out my other stock ideas below until this trade gets activated. I would love your feedback.
Disclaimer: This analysis is intended solely for informational and educational purposes and should not be interpreted as financial advice. It is advisable to consult a qualified financial advisor or conduct thorough research before making investment decisions.

Diverse Trading Strategies for UGRO Capital LtdUGRO Capital Ltd is currently exhibiting a symmetrical triangle pattern, characterized by converging trend lines drawn in black. This technical formation is indicative of a potential continuation or reversal pattern, often signaling an impending breakout, either upward or downward.
Within this chart pattern, the upper trend line serves as a short-term resistance zone, while the price action has encountered difficulties in surpassing this level. A counter-trendline, represented by a dotted black line, suggests an attempt to break free from the prevailing downtrend; however, the stock continues to face resistance from the upper trend line.
The stock has demonstrated notable resilience, establishing multiple support points, clearly identified by the blue line on the chart. These instances of price bounces indicate a consistent level of buying interest and present evidence of the stock's strength. The formation of higher lows during this period signifies a bullish sentiment, suggesting the potential for upward price movement. MACD & RSI values also denotes strong buying pressure and suggests a significant potential for price reversal.
Recent trading activity shows a significant surge in volume over the past two days, substantially exceeding the average trading volumes. This spike is a critical sign of accumulating buying pressure, further supporting the bullish outlook for UGRO Capital Ltd . Increased volume during price ascents often serves as confirmation of the strength of the momentum.
While the current technical indicators present a constructive outlook, a definitive breakout can only be confirmed when the stock price successfully clears the upper trend line resistance. Upon achieving this milestone, the next target of interest will likely be the established resistance level at 299, which could be revisited in the foreseeable future if bullish momentum continues.
Disclaimer: The information provided in this analysis is purely for informational and educational purposes and should not be construed as financial advice. Investors are strongly encouraged to consult with a qualified financial advisor or conduct thorough research prior to making any investment decisions.

Exide Symmetrical triangle breakoutExide is showing strong technical pattern breakout. It is expected to touch 620 and possibly 650/700 as per chart.

LUPIN - Symmetrical Triangle - Breakout -Daily The chart for **Lupin Ltd.** shows a **Bullish Ascending Triangle** pattern, a continuation formation that often leads to a breakout to the upside. Below is a comprehensive breakdown of both the technical and fundamental analysis for Lupin Ltd.
### **Technical Analysis:**
1. **Symmetrical Triangle Pattern**:
- The stock price formed an **Symmetrical triangle** where the resistance level near **2,298.00 INR** was tested multiple times, while the lows were rising, creating higher lows over time.
- The breakout above the upper trendline occurred with a solid move, confirmed by a spike in volume, which validates the breakout.
2. **Volume**:
- Volume shows a notable increase during the breakout phase, which suggests strong buying interest. This volume confirmation adds weight to the strength of the breakout.
- Periods of low volume within the triangle indicate consolidation, which is typical before an upward breakout.
3. **Price Targets**:
- The height of the triangle is approximately **189.70 INR**, which projects a possible price target of around **2,427.50 INR**.
- This target aligns with a resistance level and acts as the next logical area where sellers might emerge.
- The stock has already moved up **3.12%** today, signaling bullish momentum that could take the price toward this target.
4. **Support Levels**:
- **2,221.55 INR** is the lower bound of the triangle and acts as the nearest support level.
5. **Box Ranges**:
- The chart also displays a series of rectangular box ranges during previous consolidations. The stock repeatedly consolidated in tight ranges before breaking out to new highs, showing a stair-stepping behavior indicative of a strong uptrend.
6. **Risk Management**:
- A stop-loss can be placed below **2,221.55 INR**, the previous support level, to manage risk in case of a false breakout.
### **Fundamental Analysis**:
1. **Company Overview**:
- **Lupin Ltd.** is one of the major pharmaceutical companies in India, with a strong presence in global markets. The company specializes in branded and generic formulations as well as Active Pharmaceutical Ingredients (APIs).
- Lupin's product portfolio is well-diversified across therapeutic areas, including cardiovascular, diabetes, asthma, and infectious diseases.
2. **Financial Health**:
- Lupin has seen improving revenues, supported by both domestic and international sales. Recent financial reports indicated strong earnings growth due to increasing market share in the U.S. and other global markets.
- The company’s **EBITDA margin** has improved, reflecting better cost management and operational efficiencies.
3. **Sector Outlook**:
- The pharmaceutical sector, especially in India, is expected to grow due to rising healthcare demand and increasing global supply chain integration.
- Lupin benefits from India's position as a leading producer of generic drugs, which should contribute to sustained revenue growth in the coming years.
4. **Recent Developments**:
- Lupin's recent investments in R&D and the launch of new drugs in the U.S. market have bolstered investor confidence. The company's focus on launching niche drugs with limited competition has allowed it to command higher margins.
- Regulatory approval of several key drugs in the U.S. and Europe is expected to drive future growth, enhancing the company's global footprint.
5. **Valuation**:
- Lupin's stock trades at a reasonable **P/E ratio** compared to its peers, making it an attractive investment in the pharmaceutical space. Given its growth prospects, the current valuation might still offer upside potential.
### **Conclusion**:
- **Technical Outlook**: The ascending triangle breakout indicates a bullish setup with a potential price target of **2,427.50 INR**. The stock is in a strong uptrend, as confirmed by the breakout and volume.
- **Fundamental Outlook**: Lupin Ltd. is well-positioned for growth with improving financial performance, a robust product portfolio, and expansion into global markets. The company's future prospects, combined with favorable sector dynamics, make it a solid long-term investment.
As with any stock, managing risk with appropriate stop-loss levels is crucial, particularly around the key support levels.

800 Day Symmetrical Triangle Pattern BreakoutI daily make educational content video for swing / positional trading

AVGO -Symmetrical triangle -Daily - Unusual volume **Broadcom Inc. (AVGO)** chart and presents a technical analysis of the stock on a daily timeframe.
Key highlights:
1. **Bullish Pattern**: The chart seems to show a series of bullish moves with higher highs and higher lows, which are connected by yellow lines. This pattern may be interpreted as an symmetrical triangle, a bullish continuation pattern.
2. **Breakout**: A breakout is indicated on the right side of the chart, which seems to have occurred on **high volume**, further supporting the bullish momentum.
Retested the breakout trendline and bounced.
3. **Measured Move Projection**: The breakout projection indicates a potential price target of **$227.78**, which is calculated from the height of the triangle (about $60.12 from the low). This is approximately **48.25%** higher than the start of the upward move.
4. **Stop-Loss (SL)**: A stop-loss level is mentioned around **$165**, to manage risk in case the breakout fails.
5. **Volume**: A significant increase in volume is noted at the breakout, which adds confidence to the strength of the move.
### Potential Scenario:
- If the breakout holds, the target of **$227.78** could be achieved in the next rally.
- However, a pullback or consolidation near **$165** could be possible before the price moves higher.
