Part 2 Intraday Master Class How Beginners Should Approach Options
For beginners:
Start with index options (Nifty/BankNifty) – deep liquidity.
Avoid naked selling – too risky.
Focus on simple strategies like:
Buying Calls/Puts
Bull Call Spread
Bear Put Spread
Always trade with a clear stop-loss.
Understand Greeks before complex trades.
Keep position size small in the beginning.
Tarde

Part 9 Trading Master ClassOption Expiry and Settlement
Every option contract has a fixed expiry date, after which it becomes invalid. In India, for example, index options like NIFTY and BANKNIFTY expire weekly or monthly, while stock options usually have monthly expiries.
There are two types of settlements:
Cash Settlement: The difference between the strike and market price is credited or debited in cash (used in index options).
Physical Settlement: The actual delivery of stocks occurs (used in stock options in India).
Understanding expiry cycles is crucial, as price movements near expiry can become highly volatile due to time decay and traders closing positions.

Part 9 Trading Master Class With Experts Option Chain and Market Data
Traders analyze the option chain—a table showing available strikes, premiums, and open interest.
Key Insights from Option Chain:
Open Interest (OI):
High OI at a strike → strong support or resistance zone.
Change in OI:
Helps identify where traders are building positions.
Put-Call Ratio (PCR):
Indicator of market sentiment.
PCR > 1 → bullish sentiment; PCR < 1 → bearish.
Option chain analysis helps identify market bias, expected ranges, and potential breakout zones.

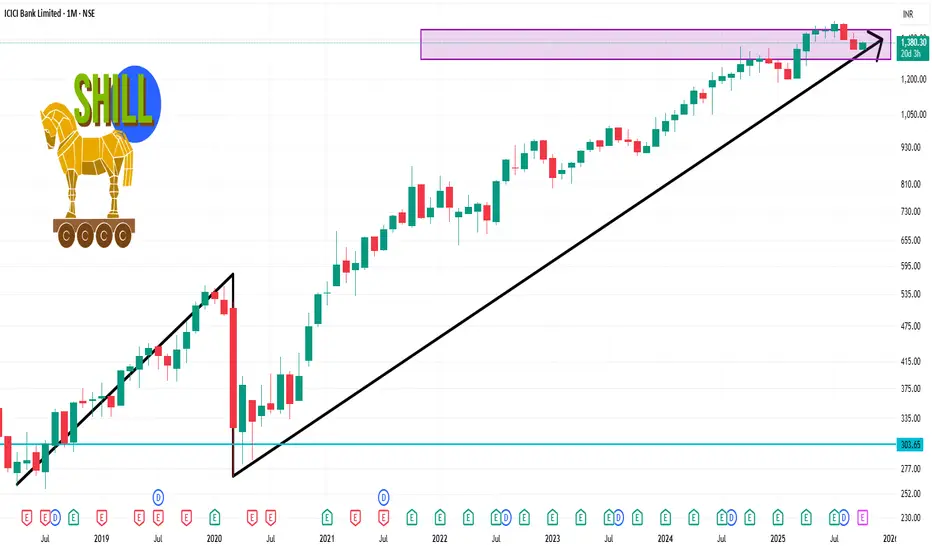
ICICIBANK 1 Month Time Frame 📊 Monthly Technical Levels
Pivot Point: ₹1,374.47
Support Levels:
S1: ₹1,316.13
S2: ₹1,284.27
S3: ₹1,225.93
Resistance Levels:
R1: ₹1,406.33
R2: ₹1,464.67
R3: ₹1,496.53
These levels are derived from standard pivot point calculations and can serve as key reference points for traders.
🔍 Technical Indicators
Relative Strength Index (RSI): Currently at 46.06, indicating a neutral condition, suggesting no immediate overbought or oversold conditions.
Moving Averages: The stock is showing a buy signal across various moving averages, with 8 buy signals and 4 sell signals, suggesting a bullish trend.
Technical Indicators: A strong buy signal is observed, with 10 buy signals and no sell signals, indicating positive momentum.
Part 6 Learn Institutional TradingStrategies, Risks, and Rewards in Option Trading
Option trading is not just about buying and selling — it’s about strategy. Traders can design positions that match their view of the market: bullish, bearish, or neutral. Some popular strategies include:
Covered Call: Selling call options on a stock already owned to earn premium income.
Protective Put: Buying puts to safeguard existing long positions against potential losses.
Straddle and Strangle: Using both call and put options to profit from large market movements regardless of direction.
Iron Condor: Combining multiple options to earn profit in a range-bound market.
Each strategy involves a balance between risk and reward. For example, buying options offers limited risk (the premium paid) but unlimited profit potential, while selling options can provide steady income but expose traders to significant losses if the market moves sharply.

Part 4 Learn Institutional TradingThe Two Sides: Option Buyer vs Option Seller
Every option trade involves two parties — a buyer and a seller (writer). Their goals are opposite:
Role Right / Obligation Risk Reward
Buyer of Call/Put Right, no obligation Limited to premium Unlimited (Call) / High (Put)
Seller (Writer) Obligation Potentially unlimited Limited to premium
Example:
If you sell a call option on Reliance at ₹3,000, and the stock rises to ₹3,200 — you must sell it at ₹3,000, incurring a loss. But if the stock stays below ₹3,000, you keep the premium as profit.
Thus, option sellers have higher risk, but they statistically profit more often due to time decay.

Retail Trading Profits: Success in the Modern Financial Market Understanding Retail Trading
Retail traders participate in financial markets primarily through brokerage accounts, online trading platforms, and mobile applications. Their decisions are often guided by technical analysis, market news, financial statements, and social trading trends. Unlike institutional traders, who have access to advanced analytical tools, high-frequency trading systems, and large capital, retail traders rely on individual research, risk management, and discipline to generate profits.
Retail trading profits are influenced by:
Market Knowledge: Understanding how markets operate, the forces driving price movements, and economic indicators.
Risk Management: Controlling losses through stop-loss orders, position sizing, and portfolio diversification.
Trading Strategy: Choosing approaches such as day trading, swing trading, trend following, or options trading.
Psychology: Maintaining emotional discipline to avoid impulsive decisions driven by fear or greed.
Key Sources of Retail Trading Profits
1. Stock Market Trading
Retail traders often focus on equity markets. Profits arise from buying undervalued stocks and selling them at higher prices or leveraging derivatives like options and futures. Retail traders can target dividends, capital gains, or a combination of both.
2. Derivatives and Options
Options and futures provide opportunities for magnified profits but also carry significant risks. Retail traders can profit from market movements without owning the underlying asset by employing strategies such as:
Call and Put Options: Speculating on price increases or decreases.
Spreads and Straddles: Hedging risk while capitalizing on volatility.
Leverage: Using borrowed capital to amplify returns, which can also amplify losses.
3. Forex Trading
Retail forex trading involves currency pairs. Traders earn profits from exchange rate fluctuations by leveraging global economic news, interest rate decisions, and geopolitical developments.
4. Cryptocurrency Trading
The rise of cryptocurrencies has created volatile markets with potential for high returns. Retail traders profit through short-term trading or long-term holdings, often using technical indicators to identify price patterns.
5. Commodity Trading
Gold, silver, oil, and agricultural commodities provide alternative avenues for retail trading profits. Commodity trading relies on understanding global supply-demand dynamics and macroeconomic trends.
Strategies for Achieving Retail Trading Profits
1. Technical Analysis
Retail traders extensively use charts, indicators, and historical price data to predict market movements. Common tools include:
Moving Averages
Relative Strength Index (RSI)
Bollinger Bands
Fibonacci Retracements
Technical analysis helps traders identify entry and exit points, momentum, and trend reversals.
2. Fundamental Analysis
This involves evaluating the intrinsic value of stocks or assets based on financial statements, earnings reports, economic indicators, and industry trends. Retail traders use fundamental analysis to make long-term investment decisions rather than short-term speculation.
3. Risk Management
Profitable retail traders focus on protecting capital. Effective strategies include:
Setting stop-loss and take-profit levels
Diversifying across asset classes
Avoiding over-leverage
Limiting exposure to single trades
4. Trading Psychology
The psychological aspect of trading is crucial for consistent profits. Retail traders must control emotions, maintain discipline, and avoid chasing losses. Successful traders develop routines, journaling practices, and mental frameworks to stay objective.
Challenges to Retail Trading Profits
Despite the opportunities, retail trading is fraught with challenges:
High Competition: Retail traders compete with institutional investors who have better tools, information, and capital.
Emotional Biases: Fear, greed, and overconfidence can lead to impulsive trades and losses.
Market Volatility: Unpredictable market swings can wipe out gains quickly.
Information Overload: Excessive news and social media chatter can create confusion and poor decision-making.
Overtrading: Frequent trades in search of profits often lead to higher costs and lower net returns.
Best Practices for Maximizing Retail Trading Profits
Develop a Trading Plan: Clearly define goals, risk tolerance, and strategies.
Continuous Learning: Stay updated with market trends, technical tools, and financial news.
Use Demo Accounts: Practice strategies without risking real capital.
Leverage Technology: Use algorithmic tools, trading apps, and analytics to enhance decision-making.
Focus on Discipline: Stick to your plan, control emotions, and maintain realistic profit expectations.
Regular Review: Analyze past trades to learn from mistakes and refine strategies.
Conclusion
Retail trading profits are achievable, but they require a combination of knowledge, strategy, discipline, and risk management. While the potential for financial gain is significant, the challenges are equally formidable. By understanding the markets, employing structured strategies, managing risks, and cultivating strong trading psychology, retail traders can navigate market complexities and improve the probability of long-term profitability.

Part 11 Trading Master Class Strike Price
The strike price is the pre-decided price at which the option buyer can buy (call) or sell (put) the underlying asset.
Expiry Date
Options have a limited life. The expiry date is the last day the option can be exercised—after this, it becomes worthless.
Premium
The premium is the cost paid by the buyer to purchase the option. It’s determined by factors like time left to expiry, volatility, and distance from the strike price.
Leverage
Options provide high leverage—you can control large positions with a small amount of money. However, this also increases potential risk.

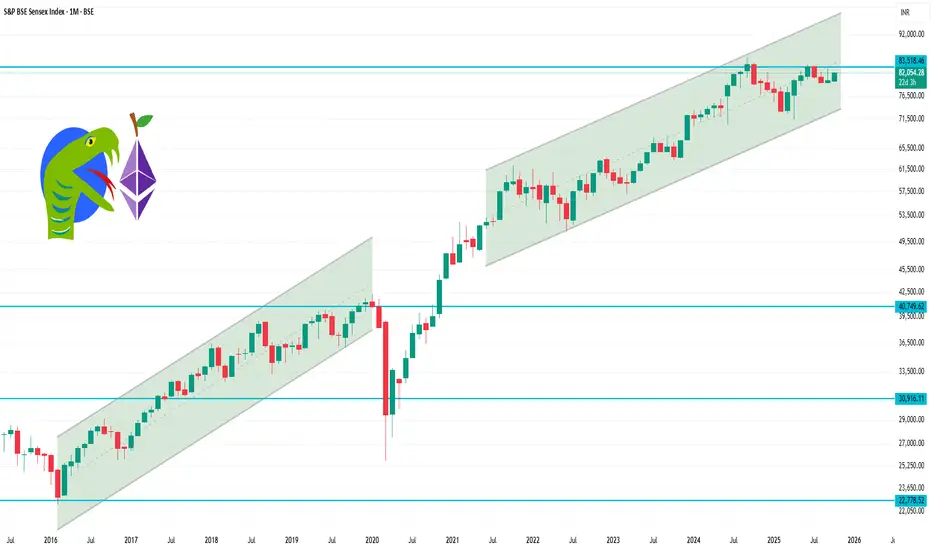
Sensex 1 Month Time Frame 1-Month Performance:
Closing Level: 81,773.66
Change: +1.22%
High: 82,257.74
Low: 81,646.08
52-Week High: 84,099.53
52-Week Low: 71,425.01
Over the past month, the Sensex has experienced a modest upward trend, reaching a high of 82,257.74 and a low of 81,646.08
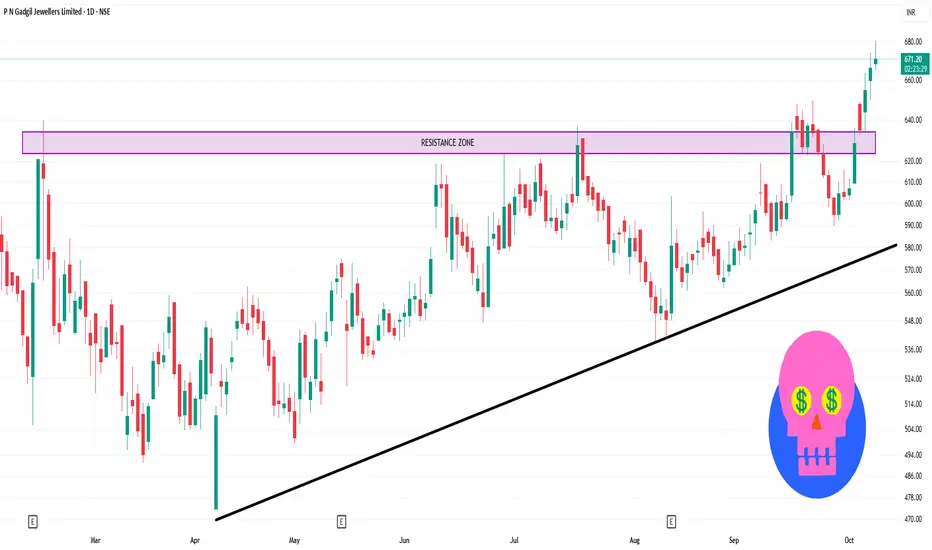
PNGJL 1 Day Time Frame 📈 Intraday Levels (1-Day Time Frame)
Opening Price: ₹668.50
Day’s Range: ₹665.10 – ₹680.65
VWAP (Volume-Weighted Average Price): ₹671.71
Previous Close: ₹666.45
Upper Circuit Limit: ₹733.05
Lower Circuit Limit: ₹599.80
🔧 Technical Indicators
Pivot Points: Classic Pivot Point at ₹663.48, with resistance levels at ₹672.61 (R1) and ₹687.38 (R2). Support levels are at ₹653.02 (S1) and ₹639.58 (S2).
Technical Analysis: The stock is currently in a "Strong Buy" position based on daily analysis, with 9 buy signals and 0 sell signals.
📊 Summary
P N Gadgil Jewellers Ltd is exhibiting a strong bullish trend on the 1-day time frame, with the stock trading above key pivot points and technical indicators signaling upward momentum. The stock has shown resilience, maintaining its position above ₹670.00 throughout the trading session.
For intraday traders, monitoring the resistance levels at ₹672.61 and ₹687.38 could provide insights into potential price targets, while support levels at ₹653.02 and ₹639.58 may act as indicators for possible pullbacks.
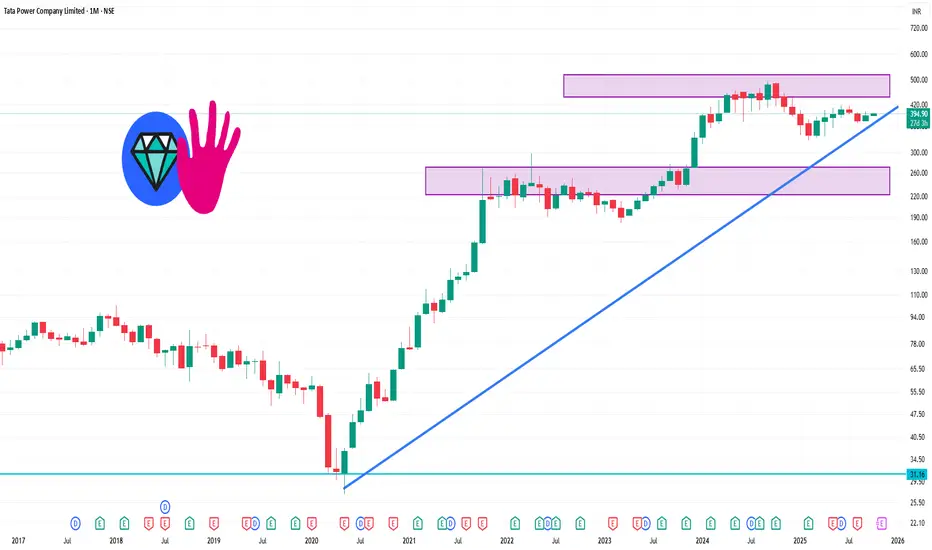
TATAPOWER 1 Month Time frame 📊 1-Month Technical Overview
Over the past month, the stock has shown a modest upward movement of approximately 1.90%
TradingView
.
🔄 Pivot Points (Monthly)
Support Levels: ₹387.57, ₹375.23, ₹361.82
Resistance Levels: ₹413.32, ₹426.73, ₹440.14
The central pivot point stands at ₹400.98
📊 Technical Indicators
Relative Strength Index (RSI): 56.79 (Neutral)
Moving Average Convergence Divergence (MACD): 0.06 (Bullish)
Commodity Channel Index (CCI): -482.5 (Bullish)
Ultimate Oscillator: 80.16 (Bullish)
Simple Moving Averages (SMA): 20-day: ₹394.82, 50-day: ₹394.90, 200-day: ₹393.54 (All Bullish)
Exponential Moving Averages (EMA): 20-day: ₹394.92, 50-day: ₹394.79, 200-day: ₹393.68 (All Bullish)
🧠 Summary
Tata Power's stock is exhibiting a bullish trend over the past month, supported by positive technical indicators and sustained upward momentum. The current price is approaching key resistance levels, suggesting potential for further gains if these levels are breached. However, investors should remain cautious of broader market conditions and sector-specific challenges that could impact performance.
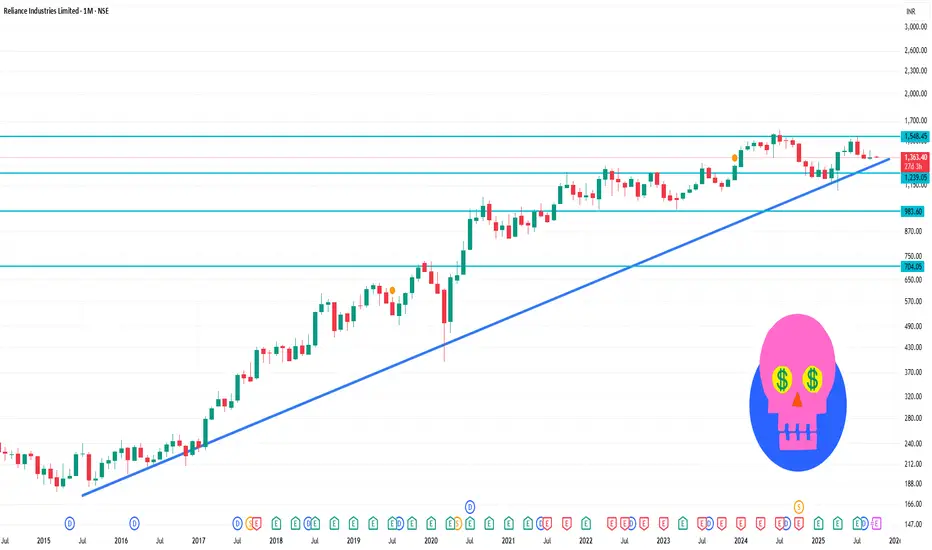
RELIANCE 1 Month Time Frame 📊 Monthly Pivot Levels (Standard)
Pivot Point: ₹1,375.53
Support Levels:
S1: ₹1,329.07
S2: ₹1,294.13
S3: ₹1,247.67
Resistance Levels:
R1: ₹1,410.47
R2: ₹1,456.93
R3: ₹1,491.87
These levels are derived from standard pivot point calculations, which are commonly used to identify potential support and resistance zones.
🔄 Technical Indicators Overview
Relative Strength Index (RSI): Approximately 41.5, indicating a neutral to slightly bearish condition.
Moving Averages: The stock is trading below its 50-day and 200-day moving averages, suggesting a bearish trend.
MACD: Currently negative, reinforcing the bearish momentum.
Short-Term Trading vs Long-Term Trading1. Introduction
Financial markets offer multiple avenues for wealth creation. From stocks, commodities, and currencies to derivatives and bonds, the market landscape is diverse. Two primary approaches dominate this landscape:
Short-Term Trading (STT): Trading where positions are held for hours, days, or weeks.
Long-Term Trading (LTT): Investing where positions are held for months, years, or even decades.
Choosing between these approaches is not merely a matter of preference; it involves evaluating capital availability, risk tolerance, skill level, and desired outcomes.
2. Short-Term Trading
2.1 Definition
Short-term trading refers to buying and selling financial instruments over a brief period to capitalize on price fluctuations. The goal is to profit from market volatility, irrespective of long-term market trends.
2.2 Types of Short-Term Trading
Intraday Trading:
Positions are opened and closed within the same trading day.
No overnight risk is taken.
Traders rely heavily on technical analysis, charts, and indicators.
Swing Trading:
Trades last from a few days to several weeks.
Aims to capture price swings within an intermediate trend.
Combines technical and fundamental analysis.
Scalping:
Ultra-short-term trading, often holding positions for minutes or seconds.
Focuses on micro price movements and liquidity.
2.3 Key Features of Short-Term Trading
Time Horizon: Minutes to weeks.
Analysis Tools: Technical analysis dominates; charts, volume, momentum, moving averages.
Capital Requirements: Moderate to high, depending on leverage and trade frequency.
Risk Level: High; price volatility can lead to substantial gains or losses.
Psychological Demands: High stress; requires constant monitoring and quick decision-making.
Transaction Costs: Frequent trades increase brokerage and taxes.
2.4 Advantages of Short-Term Trading
Quick capital turnover.
Multiple profit opportunities in volatile markets.
Ability to exploit technical market inefficiencies.
Flexibility to adjust positions rapidly.
2.5 Disadvantages of Short-Term Trading
High stress and emotional pressure.
Requires significant time commitment.
Transaction costs can erode profits.
High risk of losses during unexpected market events.
2.6 Strategies in Short-Term Trading
Trend Following: Riding the market trend until a reversal signal appears.
Counter-Trend: Betting against the current trend for short-term correction profits.
Breakout Trading: Entering trades when price breaks support or resistance levels.
Momentum Trading: Using indicators like RSI or MACD to capture strong price movements.
3. Long-Term Trading
3.1 Definition
Long-term trading, or investing, involves holding positions over extended periods, ranging from months to years, focusing on the fundamental value of an asset rather than short-term price fluctuations.
3.2 Types of Long-Term Trading
Position Trading:
Holding trades for months to years.
Focused on macroeconomic trends, corporate fundamentals, and industry growth.
Value Investing:
Buying undervalued stocks and holding until the market recognizes their true value.
Popularized by investors like Warren Buffett.
Dividend Investing:
Focused on income generation through dividends alongside capital appreciation.
3.3 Key Features of Long-Term Trading
Time Horizon: Months to decades.
Analysis Tools: Fundamental analysis dominates; financial statements, P/E ratios, cash flows.
Capital Requirements: Can start small but often requires patience to realize returns.
Risk Level: Generally lower; time helps smooth out market volatility.
Psychological Demands: Patience and discipline are essential; minimal day-to-day stress.
Transaction Costs: Lower due to fewer trades.
3.4 Advantages of Long-Term Trading
Benefits from compounding over time.
Less stress compared to short-term trading.
Lower transaction costs.
Less impacted by daily market volatility.
3.5 Disadvantages of Long-Term Trading
Requires patience and discipline.
Capital is tied up for longer periods.
Market shocks (e.g., recessions, policy changes) can affect returns temporarily.
3.6 Strategies in Long-Term Trading
Buy and Hold: Purchase quality assets and hold for long periods.
Dollar-Cost Averaging: Investing a fixed amount regularly to mitigate timing risks.
Growth Investing: Targeting companies with strong future growth potential.
Index Fund Investing: Diversifying risk through market indices like S&P 500 or Nifty 50.
4. Risk Management
Both approaches require risk management:
4.1 Short-Term Risk Management
Stop-loss orders to limit losses.
Position sizing based on volatility.
Diversifying trades to reduce market dependency.
Avoiding over-leverage.
4.2 Long-Term Risk Management
Portfolio diversification across sectors and assets.
Regularly reviewing fundamentals.
Maintaining emergency funds to avoid forced liquidation.
Hedging with derivatives or protective instruments if necessary.
5. Psychological Considerations
5.1 Short-Term Trading Psychology
Emotional control is critical; impulsive decisions can cause losses.
Fear and greed dominate daily trading.
Traders must develop a clear strategy and stick to it.
5.2 Long-Term Trading Psychology
Patience and resilience are key.
Avoid reacting to market noise.
Focus on long-term goals rather than short-term market movements.
6. Tools and Technology
Both trading types benefit from modern technology:
Short-Term Traders: Charting software, trading platforms, algorithmic tools, high-speed data feeds.
Long-Term Traders: Research platforms, financial news, fundamental databases, portfolio trackers.
7. Tax Implications
Taxation varies by country and can influence trading strategies:
Short-Term Trading: Usually taxed at higher rates as short-term capital gains.
Long-Term Trading: Often enjoys lower tax rates on long-term capital gains.
8. Case Studies
8.1 Short-Term Trading Example
Day trader using RSI and MACD indicators to trade Nifty futures within a single day.
Captures profit of 0.5%-1% per trade but executes 10-15 trades per week.
8.2 Long-Term Trading Example
Investor buys shares of a growing IT company and holds for 5 years.
Benefits from dividends and capital appreciation as the company expands.
Conclusion
Short-term and long-term trading represent different philosophies of engaging with the financial markets:
Short-Term Trading is action-oriented, volatile, and requires skill, discipline, and constant attention.
Long-Term Trading is patience-oriented, fundamentally driven, and benefits from compounding over time.
A comprehensive understanding of both allows traders to design a strategy that balances risk, reward, and personal lifestyle, ensuring sustainable financial growth in dynamic markets.
Trading Master Class With ExpertsPart 1: Introduction to Option Trading
Options are financial derivatives that derive their value from an underlying asset such as stocks, indices, commodities, or currencies. Unlike shares, buying an option doesn’t mean you own the asset—it gives you the right but not the obligation to buy or sell the asset at a pre-agreed price within a set period. This flexibility makes options a powerful tool for hedging, speculation, and income generation.
Part 2: What is a Derivative?
A derivative is a financial contract whose value depends on another asset. Futures and options are the two most popular derivatives. While futures require you to buy/sell at expiry, options give you the choice. This “choice” is what makes them unique—and sometimes tricky.
Part 3: The Two Types of Options
Call Option – Gives the buyer the right to buy an asset at a fixed price (strike price).
Example: If you buy a call option of Reliance at ₹2500, and the stock moves to ₹2600, you can still buy it at ₹2500.
Put Option – Gives the buyer the right to sell an asset at a fixed price.
Example: If you buy a put option at ₹2500 and the stock falls to ₹2400, you can still sell it at ₹2500.
Part 4: Key Terminologies
Strike Price – The pre-decided price of buying/selling.
Premium – The cost paid to buy the option.
Expiry Date – The last date till which the option is valid.
In-the-Money (ITM) – Option has intrinsic value.
Out-of-the-Money (OTM) – Option has no intrinsic value.
At-the-Money (ATM) – Strike price is close to market price.
Part 5: Call Option in Detail
A call option is ideal if you expect the price of an asset to rise. Buyers risk only the premium paid, while sellers (writers) can face unlimited losses if prices rise sharply. Traders often buy calls for bullish bets and sell calls to earn premium income.
Part 6: Put Option in Detail
A put option is profitable when asset prices fall. Buyers of puts use them for protection against a market crash, while sellers hope prices won’t fall so they can pocket the premium. Investors holding stocks often buy puts as insurance against downside risk.
Part 7: How Option Premium is Priced
Option premium = Intrinsic Value + Time Value
Intrinsic Value: Actual value (e.g., if Reliance is ₹2600 and strike is ₹2500, intrinsic = ₹100).
Time Value: Extra cost traders pay for the possibility of favorable movement before expiry.
Pricing is also influenced by volatility, interest rates, and dividends.
Part 8: The Greeks in Options
The Greeks measure option sensitivity:
Delta – Measures how much option price moves for a ₹1 move in stock.
Gamma – Measures how delta changes with stock movement.
Theta – Measures time decay (options lose value as expiry approaches).
Vega – Measures sensitivity to volatility.
Rho – Measures sensitivity to interest rates.
Part 9: Why Traders Use Options
Options are versatile. Traders use them to:
Speculate on price movements with limited risk.
Hedge against adverse market moves.
Generate Income by selling options (collecting premiums).
Leverage positions with less capital compared to buying shares directly.
Part 10: Buying vs Selling Options
Buying Options: Limited risk (premium), unlimited profit potential.
Selling Options: Limited profit (premium), unlimited risk.
Example: Selling a naked call when markets rise aggressively can cause heavy losses.

Part 6 Institutional TradingPart 1: Role of Implied Volatility
Implied volatility (IV) reflects market expectations of future price movement.
High IV → Expensive options, profitable for sellers if volatility drops.
Low IV → Cheap options, profitable for buyers if volatility rises.
IV is a key factor in selecting strategies and timing trades.
Part 2: Time Decay in Options (Theta)
Options lose value as expiration approaches due to time decay.
Long options: Lose value over time if price doesn’t move.
Short options: Benefit from decay as premium erodes.
Understanding time decay is critical for timing trades.
Part 3: Hedging with Options
Options are powerful hedging tools:
Protect portfolios from market downturns using puts.
Lock in future prices for commodities.
Reduce risk while maintaining upside potential.
Hedging requires understanding correlation and position sizing.
Part 4: Speculation Using Options
Options allow leveraged speculation:
Small capital can control large positions.
Enables directional bets on bullish, bearish, or volatile markets.
High leverage carries high risk and potential loss of the entire premium.
Part 5: Options Market Participants
Key participants include:
Hedgers: Reduce risk from price fluctuations.
Speculators: Take positions for profit from price movements.
Arbitrageurs: Exploit pricing inefficiencies.
Market Makers: Provide liquidity by quoting bid and ask prices.
Part 6: Options on Indices vs Stocks
Stock Options: Based on individual stocks, more sensitive to company events.
Index Options: Based on market indices, less prone to individual stock risk.
Index options often used for hedging broad market exposure.
Part 7: Regulatory Environment
Options trading is regulated to ensure market integrity:
Exchanges like NSE, BSE in India; CBOE in the US.
Margin requirements for sellers.
Reporting and compliance rules.
Surveillance to prevent manipulation.
Part 8: Risks in Option Trading
Risks include:
Market Risk: Price moves against the position.
Time Decay Risk: Value erodes as expiration nears.
Liquidity Risk: Inability to exit positions at fair price.
Volatility Risk: Unexpected market volatility.
Proper risk management is critical for survival in options trading.
Part 9: Trading Platforms and Tools
Options are traded through online brokers and trading platforms:
Real-time data, option chains, and Greeks calculators.
Advanced platforms allow strategy backtesting.
Mobile apps support tracking and execution on-the-go.
Part 10: Conclusion and Best Practices
Option trading is a versatile financial instrument offering leverage, hedging, and income generation opportunities. Key best practices:
Understand the product before trading.
Focus on risk management, not just profit.
Start with simple strategies before moving to complex spreads.
Use Greeks to monitor risk and optimize trades.
Keep learning, as markets and strategies evolve continuously.
Options are powerful tools, but they require knowledge, discipline, and patience to trade successfully.

Part 3 Institutional TradingPart 1: Introduction to Option Trading
Option trading is a sophisticated financial instrument that allows traders to speculate on or hedge against the future price movements of an underlying asset. Options provide rights, not obligations, giving traders flexibility compared to traditional stock trading. Unlike futures, where contracts are binding, options give the choice to exercise or let expire. This makes them attractive for hedging, income generation, and speculative strategies.
Part 2: What is an Option?
An option is a contract between a buyer and seller that gives the buyer the right, but not the obligation, to buy or sell an underlying asset at a predetermined price (strike price) on or before a specific date (expiration).
Call Option: Right to buy the underlying asset.
Put Option: Right to sell the underlying asset.
Options derive their value from the underlying asset, which can be stocks, indices, commodities, or currencies.
Part 3: Key Terminology in Option Trading
Understanding options requires familiarity with core terms:
Strike Price: Price at which the option can be exercised.
Expiration Date: Last date the option can be exercised.
Premium: Price paid by the buyer to purchase the option.
In-the-Money (ITM): Option has intrinsic value.
Out-of-the-Money (OTM): Option has no intrinsic value.
At-the-Money (ATM): Option’s strike price is near the current market price.
Part 4: Types of Option Contracts
Options can be categorized as:
American Options: Can be exercised any time before expiration.
European Options: Can be exercised only on expiration.
Exotic Options: Complex options with non-standard features, e.g., barrier, Asian, or digital options.
Part 5: Option Payoff Structure
Option payoffs determine profit or loss:
Call Option Payoff: Profit if underlying price > strike price at expiration.
Put Option Payoff: Profit if underlying price < strike price at expiration.
Graphs are often used to visualize potential profit/loss for both buyers and sellers.
Part 6: Option Pricing Components
Option prices (premiums) are influenced by:
Intrinsic Value: Difference between strike price and underlying price.
Time Value: Additional value due to time remaining until expiration.
Volatility: Higher volatility increases option premiums.
Interest Rates & Dividends: Affect option valuation for stocks.
Part 7: Option Pricing Models
Common models used to calculate option premiums:
Black-Scholes Model: For European options, considers volatility, interest rate, strike price, and time.
Binomial Model: Uses a tree of possible prices to calculate option value.
Monte Carlo Simulation: Used for complex or exotic options.
Part 8: The Greeks – Measuring Risk
Greeks quantify how an option’s price changes with market variables:
Delta: Sensitivity to underlying price.
Gamma: Rate of change of delta.
Theta: Time decay impact.
Vega: Sensitivity to volatility.
Rho: Sensitivity to interest rates.
Greeks help traders manage risk and structure positions.
Part 9: Option Strategies for Beginners
Simple strategies include:
Long Call: Buying a call to profit from price rise.
Long Put: Buying a put to profit from price fall.
Covered Call: Selling a call against owned stock for income.
Protective Put: Buying a put to hedge an existing stock.
Part 10: Advanced Option Strategies
Advanced strategies include:
Spreads: Buying and selling options of the same type to limit risk.
Vertical Spread, Horizontal/Calendar Spread, Diagonal Spread.
Straddles & Strangles: Betting on high volatility without direction bias.
Butterfly & Condor: Complex strategies for range-bound markets.

Divergance Secrets1. Introduction to Option Trading
In the world of financial markets, traders and investors are constantly looking for ways to maximize returns while managing risks. Beyond the conventional buying and selling of stocks, bonds, or commodities lies the fascinating arena of derivatives. Among derivatives, options stand out as one of the most versatile and widely used financial instruments.
An option is essentially a contract that gives the holder the right, but not the obligation, to buy or sell an underlying asset at a predetermined price before or at a specified expiration date. This flexibility allows traders to hedge risks, speculate on market movements, or design complex strategies to suit different risk appetites.
Option trading is a double-edged sword: it can generate extraordinary profits in a short span but also result in significant losses if misunderstood. Hence, before stepping into this market, it is essential to understand the fundamentals, mechanics, and strategies behind option trading.
2. Basics of Options
To understand option trading, let us first dissect the essential components.
2.1 Call Options
A call option gives the buyer the right, but not the obligation, to buy the underlying asset at a predetermined price (strike price) within a specific period.
If the asset’s price rises above the strike price, the call option holder can buy at a lower price and profit.
If the price falls below the strike, the buyer may let the option expire worthless, losing only the premium paid.
Example: If you buy a call option on Stock A at ₹100 strike and the stock rises to ₹120, you profit by exercising the option or selling it in the market.
2.2 Put Options
A put option gives the buyer the right, but not the obligation, to sell the underlying asset at the strike price before or at expiration.
If the asset price falls below the strike, the put holder benefits.
If it rises above the strike, the option may expire worthless.
Example: If you buy a put option on Stock A at ₹100 and the stock falls to ₹80, you can sell it at ₹100, making a profit.
2.3 Strike Price
The pre-agreed price at which the underlying asset can be bought or sold.
2.4 Premium
The price paid by the option buyer to the seller (writer) for acquiring the option contract. It represents the upfront cost and is influenced by time, volatility, and underlying asset price.
2.5 Expiration Date
Options have a finite life and must be exercised or left to expire on a specific date.
3. Types of Options
Options vary based on style, market, and underlying assets.
American Options – Can be exercised anytime before expiration.
European Options – Can only be exercised on the expiration date.
Equity Options – Based on shares of companies.
Index Options – Based on stock indices like Nifty, S&P 500, etc.
Commodity Options – Based on gold, silver, crude oil, etc.
Currency Options – Based on forex pairs like USD/INR.
4. Participants in Option Trading
Every option trade involves two primary parties:
Option Buyer – Pays the premium, enjoys the right but no obligation.
Option Seller (Writer) – Receives the premium but carries the obligation if the buyer exercises the contract.
The buyer has limited risk (premium paid), but the seller has theoretically unlimited risk and limited profit (premium received).
5. Why Trade Options?
Traders and investors use options for multiple reasons:
Hedging – Protecting existing investments from adverse price moves.
Speculation – Betting on market directions with limited risk.
Income Generation – Writing options to collect premiums.
Leverage – Controlling a large position with a relatively small investment.

Part 2 Candle Stick Pattern 1. Introduction to Option Trading
In the world of financial markets, traders and investors are constantly looking for ways to maximize returns while managing risks. Beyond the conventional buying and selling of stocks, bonds, or commodities lies the fascinating arena of derivatives. Among derivatives, options stand out as one of the most versatile and widely used financial instruments.
An option is essentially a contract that gives the holder the right, but not the obligation, to buy or sell an underlying asset at a predetermined price before or at a specified expiration date. This flexibility allows traders to hedge risks, speculate on market movements, or design complex strategies to suit different risk appetites.
Option trading is a double-edged sword: it can generate extraordinary profits in a short span but also result in significant losses if misunderstood. Hence, before stepping into this market, it is essential to understand the fundamentals, mechanics, and strategies behind option trading.
2. Basics of Options
To understand option trading, let us first dissect the essential components.
2.1 Call Options
A call option gives the buyer the right, but not the obligation, to buy the underlying asset at a predetermined price (strike price) within a specific period.
If the asset’s price rises above the strike price, the call option holder can buy at a lower price and profit.
If the price falls below the strike, the buyer may let the option expire worthless, losing only the premium paid.
Example: If you buy a call option on Stock A at ₹100 strike and the stock rises to ₹120, you profit by exercising the option or selling it in the market.
2.2 Put Options
A put option gives the buyer the right, but not the obligation, to sell the underlying asset at the strike price before or at expiration.
If the asset price falls below the strike, the put holder benefits.
If it rises above the strike, the option may expire worthless.
Example: If you buy a put option on Stock A at ₹100 and the stock falls to ₹80, you can sell it at ₹100, making a profit.
2.3 Strike Price
The pre-agreed price at which the underlying asset can be bought or sold.
2.4 Premium
The price paid by the option buyer to the seller (writer) for acquiring the option contract. It represents the upfront cost and is influenced by time, volatility, and underlying asset price.
2.5 Expiration Date
Options have a finite life and must be exercised or left to expire on a specific date.
3. Types of Options
Options vary based on style, market, and underlying assets.
American Options – Can be exercised anytime before expiration.
European Options – Can only be exercised on the expiration date.
Equity Options – Based on shares of companies.
Index Options – Based on stock indices like Nifty, S&P 500, etc.
Commodity Options – Based on gold, silver, crude oil, etc.
Currency Options – Based on forex pairs like USD/INR.
4. Participants in Option Trading
Every option trade involves two primary parties:
Option Buyer – Pays the premium, enjoys the right but no obligation.
Option Seller (Writer) – Receives the premium but carries the obligation if the buyer exercises the contract.
The buyer has limited risk (premium paid), but the seller has theoretically unlimited risk and limited profit (premium received).
5. Why Trade Options?
Traders and investors use options for multiple reasons:
Hedging – Protecting existing investments from adverse price moves.
Speculation – Betting on market directions with limited risk.
Income Generation – Writing options to collect premiums.
Leverage – Controlling a large position with a relatively small investment.

Option Trading 1. Speculation with Options
Options allow leverage, letting traders profit from small price movements with limited capital. Risk is limited to the premium paid for buyers, but sellers face potentially unlimited risk.
2. Option Styles
Options come in different styles:
European Options: Can be exercised only at expiry.
American Options: Can be exercised anytime before expiry.
Bermudan Options: Exercise possible on specific dates before expiry.
3. Factors Affecting Option Prices
Option premiums are influenced by:
Underlying asset price
Strike price
Time to expiry
Volatility
Interest rates
Dividends
Understanding these factors helps in predicting option price movement.
4. Intrinsic vs. Extrinsic Value
Intrinsic value: Real value if exercised now.
Extrinsic value: Additional premium based on time and volatility.
Example: If a stock trades at ₹520 and the call strike is ₹500, intrinsic value = ₹20, rest is extrinsic value.
5. Option Strategies
There are basic and advanced option strategies:
Single-leg: Buying a call or put.
Multi-leg: Combining options to reduce risk or maximize profit (e.g., spreads, straddles, strangles).
Example: Covered call involves holding the stock and selling a call to earn extra premium.
6. Risk Management
Options trading requires strict risk management:
Limit exposure per trade.
Use stop-loss orders.
Diversify strategies.
Monitor Greeks to assess risk dynamically.
7. Advantages of Options
Flexibility in trading.
Leverage for small capital.
Hedging against price swings.
Profit in any market condition using proper strategies.
8. Disadvantages of Options
Complexity compared to stocks.
Time decay can erode value.
Unlimited risk for option sellers.
Requires continuous monitoring of market movements.
9. Real-life Examples
Hedging: A farmer selling wheat futures and buying put options to secure a minimum price.
Speculation: A trader buying Nifty call options before earnings season to profit from upward movement.
Income: Selling covered calls on owned stocks to earn premiums regularly.
10. Conclusion
Option trading is a powerful tool for hedging, speculation, and income generation, but it requires knowledge, discipline, and risk management. Understanding strike prices, premiums, Greeks, and strategies ensures that traders can capitalize on market movements effectively. Beginners should start with simple strategies and gradually explore complex multi-leg positions as they gain confidence.

PCR Trading Strategies1. Introduction to Options
Options are financial derivatives that give the holder the right, but not the obligation, to buy or sell an underlying asset at a predetermined price (strike price) before or on a specific date (expiry). Unlike futures, which require the contract to be fulfilled, options allow flexibility. Options are widely used in stock markets, commodities, currencies, and indices.
2. Types of Options
There are two main types of options:
Call Option: Gives the buyer the right to buy the underlying asset.
Put Option: Gives the buyer the right to sell the underlying asset.
Example: Buying a call option of Tata Motors with a strike price of ₹450 allows you to buy the stock at ₹450, regardless of the market price.
3. Option Participants
Option trading involves two primary participants:
Buyer (Holder): Pays a premium and has the right to exercise the option.
Seller (Writer): Receives the premium and assumes the obligation to fulfill the contract if exercised.
4. Premium in Options
The premium is the price paid by the buyer to acquire the option. It consists of:
Intrinsic value: Difference between strike price and current market price.
Time value: Additional cost for potential future profit until expiry.
Example: If a stock is ₹500, and a call option with a ₹480 strike costs ₹25, the intrinsic value is ₹20, and the time value is ₹5.
5. Strike Price
The strike price is the predetermined price at which the underlying asset can be bought (call) or sold (put). Selecting the right strike price is crucial for option strategies.
6. Expiry Date
Options have a limited life. The expiry date determines the last day the option can be exercised. Indian markets follow weekly, monthly, and quarterly expiries.
7. Moneyness of Options
Options are categorized by their moneyness:
In-the-Money (ITM): Exercise is profitable.
At-the-Money (ATM): Strike price equals underlying price.
Out-of-the-Money (OTM): Exercise is unprofitable.
Example: A call option at ₹480 when the stock trades at ₹500 is ITM.
8. Option Greeks
Option Greeks are metrics that measure risk and price sensitivity:
Delta: Price change sensitivity to the underlying asset.
Gamma: Rate of change of Delta.
Theta: Time decay effect on option premium.
Vega: Sensitivity to volatility.
Rho: Sensitivity to interest rates.
9. Long vs. Short Positions
Long Call/Put: Buying options to profit from upward (call) or downward (put) movement.
Short Call/Put: Selling options to collect premium, often used in hedging.
10. Hedging with Options
Options are widely used for risk management. Investors hedge positions to protect against adverse market movements.
Example: If you own Infosys shares, buying a put option can limit downside risk.

Public vs Private Banks in Trading1. Introduction
Banking institutions play a crucial role in the financial ecosystem, acting as intermediaries between savers and borrowers, facilitating economic growth, and influencing market stability. Within India, banks are broadly classified into public sector banks and private sector banks, both of which participate in trading activities but with different operational strategies, risk appetites, and market impacts.
Trading by banks refers to activities such as:
Equity trading: Buying and selling shares of companies.
Debt trading: Involving government bonds, corporate bonds, and other fixed-income instruments.
Derivatives trading: Futures, options, swaps for hedging or speculative purposes.
Forex trading: Buying and selling foreign currencies.
Commodity trading: Participation in commodity markets, often indirectly.
The distinction between public and private banks in these trading activities affects liquidity, market volatility, investor confidence, and overall financial stability.
2. Overview of Public and Private Banks
2.1 Public Sector Banks (PSBs)
Public sector banks are banks in which the government holds a majority stake (usually over 50%), giving it significant control over operations and policies. Examples in India include:
State Bank of India (SBI)
Punjab National Bank (PNB)
Bank of Baroda (BoB)
Characteristics:
Government ownership provides implicit trust and perceived safety.
Mandated to serve social and economic objectives, sometimes at the cost of profitability.
Larger branch networks, especially in semi-urban and rural areas.
Regulatory oversight tends to be stricter, focusing on stability rather than aggressive profits.
2.2 Private Sector Banks
Private banks are owned by private entities or shareholders with the primary objective of profit maximization. Examples include:
HDFC Bank
ICICI Bank
Axis Bank
Characteristics:
More technologically advanced and customer-centric.
Flexible, agile, and willing to explore new trading strategies.
High focus on efficiency, profitability, and risk-adjusted returns.
Typically have fewer rural branches but dominate urban and digital banking.
3. Role of Banks in Trading
Banks are central players in the financial markets. Their trading activities can be categorized as:
3.1 Proprietary Trading
Banks trade with their own capital to earn profits. Private banks often engage more aggressively due to higher risk appetite.
3.2 Client Trading
Banks execute trades on behalf of clients, such as corporates, mutual funds, or high-net-worth individuals. Both public and private banks participate, but private banks may offer more advanced advisory and trading platforms.
3.3 Hedging and Risk Management
Banks use derivatives and other instruments to hedge risks associated with:
Currency fluctuations
Interest rate changes
Commodity price movements
Public banks often hedge conservatively due to regulatory oversight, whereas private banks may engage in complex derivative strategies.
4. Trading in Different Market Segments
4.1 Equity Markets
Public Banks: Typically invest in blue-chip companies and government initiatives; tend to hold stable equity portfolios.
Private Banks: Active in IPOs, mutual funds, and portfolio management; may leverage proprietary trading desks for short-term gains.
4.2 Debt Markets
Public Banks: Major participants in government bonds, treasury bills, and large-scale debt issuance.
Private Banks: Active in corporate bonds, debentures, and structured debt instruments.
4.3 Forex Markets
Public Banks: Facilitate trade-related foreign exchange, hedging imports/exports; conservative trading.
Private Banks: Aggressive forex trading, currency swaps, and derivatives to maximize profits.
4.4 Commodity Markets
Public Banks: Minimal direct participation; may finance commodity traders.
Private Banks: May engage in commodity-linked derivatives for proprietary or client trading.
4.5 Derivatives Markets
Public Banks: Hedging-driven; lower exposure to high-risk derivatives.
Private Banks: Speculation and hedging; higher use of futures, options, and structured products.
5. Comparative Performance Analysis
5.1 Profitability
Private banks typically have higher net interest margins and return on equity.
Public banks focus on financial inclusion and stability; profits are secondary.
5.2 Risk Management
Public banks prioritize capital preservation; may carry higher non-performing assets (NPAs).
Private banks employ advanced risk modeling; NPAs are lower, but exposure to market risks is higher.
5.3 Market Impact
Public banks stabilize markets during crises due to government backing.
Private banks drive market innovation through new trading products and digital platforms.
6. Regulation and Compliance
Both public and private banks in India are regulated by the Reserve Bank of India (RBI).
Public Banks: Must follow government mandates on priority sector lending, capital adequacy, and lending limits.
Private Banks: While regulated, they enjoy more freedom in investment strategies, provided they adhere to Basel III norms and RBI guidelines.
7. Technological and Digital Edge
Public Banks
Historically slower in adopting technology.
Initiatives like Core Banking Solutions (CBS) have modernized operations.
Digital trading platforms are limited.
Private Banks
Early adopters of digital trading platforms, mobile banking, and AI-based trading analytics.
Focus on client-driven solutions like portfolio optimization, robo-advisory, and high-frequency trading.
8. Case Studies
8.1 State Bank of India (SBI)
Large-scale government bond trading.
Stable equity portfolio; focus on corporate and retail clients.
Conservative derivatives trading.
8.2 HDFC Bank
Active in equity derivatives and forex trading.
Aggressive risk-adjusted proprietary trading strategies.
Strong digital platforms for client trading.
9. Challenges and Opportunities
Public Banks
Challenges:
High NPAs, bureaucratic hurdles, and slower adoption of technology.
Limited risk-taking capacity restricts trading profits.
Opportunities:
Government support can stabilize during crises.
Potential for technology partnerships to modernize trading platforms.
Private Banks
Challenges:
Vulnerable to market volatility and regulatory scrutiny.
Aggressive trading strategies can backfire during crises.
Opportunities:
High profit potential through innovative trading and fintech integration.
Can attract high-net-worth clients and institutional investors.
10. Impact on Financial Markets
Public Banks: Act as stabilizers; provide liquidity during market stress.
Private Banks: Drive market efficiency and innovation; increase competition.
Combined Effect: Both types ensure a balanced ecosystem where stability and growth coexist.
11. Future Trends in Banking and Trading
Integration of AI and Machine Learning:
Private banks leading in algorithmic trading and predictive analytics.
Public banks adopting AI for risk management and operational efficiency.
Blockchain and Digital Assets:
Both sectors exploring blockchain for secure and transparent trading.
Cryptocurrency exposure remains limited but monitored.
Sustainable and ESG Investments:
Increasing focus on green bonds, socially responsible funds, and ESG-compliant derivatives.
Global Market Expansion:
Private banks expanding cross-border trading.
Public banks supporting government-backed international trade financing.
12. Conclusion
Public and private banks serve complementary roles in the trading ecosystem:
Public Banks: Conservative, stable, government-backed, stabilizing force in markets.
Private Banks: Agile, profit-oriented, technologically advanced, driving market innovation.
A robust financial system requires both sectors to function effectively. Public banks ensure economic stability, especially in times of crisis, while private banks provide innovation, efficiency, and competitive trading solutions. For investors, understanding these differences is critical when assessing bank stock investments, trading opportunities, or market trends.
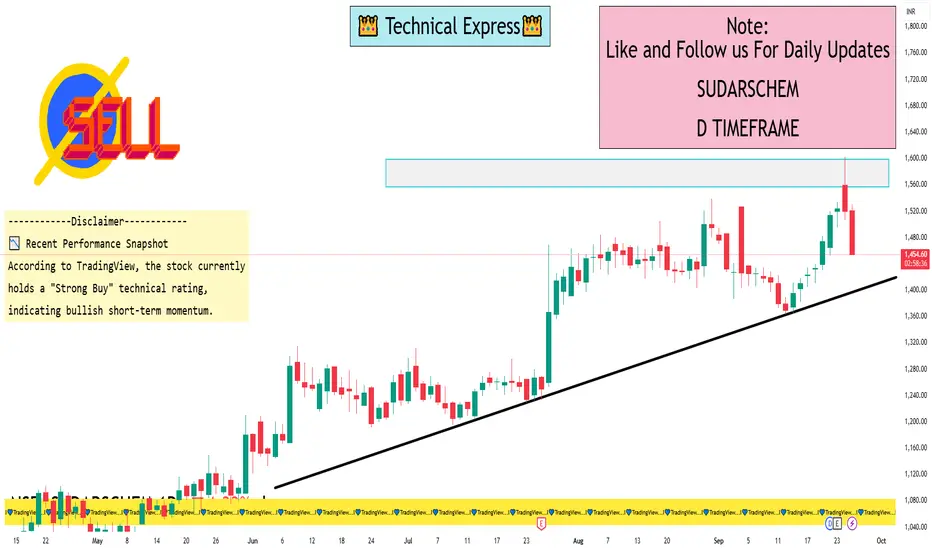
SUDARSCHEM 1 Day View📊 Key Intraday Levels
Opening Price: ₹1,521.00
Day’s High: ₹1,529.80
Day’s Low: ₹1,454.40
Previous Close: ₹1,520.50
VWAP (Volume-Weighted Average Price): ₹1,489.72
Upper Circuit Limit: ₹1,824.60
Lower Circuit Limit: ₹1,216.40
📈 Technical Overview
According to TradingView, the stock currently holds a "Strong Buy" technical rating, indicating bullish short-term momentum.
📉 Recent Performance Snapshot
Despite the current decline, Sudarshan Chemical has shown robust performance over the past year, with a 1-year return of approximately 38.25%.
🧠 Intraday Outlook
The stock is currently testing its support levels. A sustained move below ₹1,445 could lead to further declines. Conversely, a rebound above ₹1,530 may signal a potential reversal. Traders should monitor these levels closely for potential entry or exit points.
🔍 Summary
While the stock is experiencing a pullback today, its overall technical outlook remains positive. Investors should monitor key support levels around ₹1,454 and ₹1,440, as a breach could signal further downside. Conversely, a recovery above ₹1,500 may indicate a resumption of the uptrend.
Part 2 Ride The Big Moves 1. Option Pricing and Valuation
Option prices are determined by two main components:
1.1 Intrinsic Value
The difference between the current price of the underlying asset and the option’s strike price.
1.2 Time Value
The remaining portion of the premium, reflecting time until expiration and volatility. Options with longer time to expiration usually have higher time value.
1.3 Factors Affecting Option Prices
Underlying Asset Price: Movement in the underlying asset directly affects the option’s value.
Strike Price: Determines whether the option is ITM, ATM, or OTM.
Time to Expiration: Longer expiration provides higher flexibility and premium.
Volatility: Higher volatility increases option premiums.
Interest Rates: Rising interest rates can increase call option values and decrease put option values.
Dividends: Expected dividends reduce the value of call options.
1.4 Option Pricing Models
Black-Scholes Model: Widely used for European options, factoring in asset price, strike price, time, volatility, and risk-free rate.
Binomial Model: Flexible and suitable for American options, where early exercise is possible.
2. Risk and Reward in Options Trading
2.1 Risk for Option Buyers
The maximum risk for buyers is limited to the premium paid. If the market moves unfavorably, the option can expire worthless, but the loss cannot exceed the initial investment.
2.2 Risk for Option Sellers (Writers)
Sellers face potentially unlimited risk:
For a call writer without owning the underlying asset (naked call), losses can be infinite if the asset price rises sharply.
For put writers, losses occur if the asset price falls significantly below the strike price.
2.3 Reward Potential
Buyers have unlimited profit potential for calls and substantial profit for puts if the market moves favorably.
Sellers earn the premium as maximum profit, regardless of market movement, assuming they manage positions correctly.
3. Hedging and Speculation Using Options
3.1 Hedging
Options are a powerful tool for risk management. For instance:
Investors holding a stock can buy put options to protect against downside risk.
Traders can use options to lock in profit targets or minimize losses.
3.2 Speculation
Speculators use options to capitalize on market movements with limited capital. Examples:
Buying calls to profit from an anticipated rise.
Buying puts to profit from an anticipated fall.
Using complex strategies to exploit volatility or time decay.
4. Options in Different Markets
4.1 Stock Options
Options on individual stocks are most popular and widely traded. They provide leverage and hedging opportunities.
4.2 Index Options
Options on market indices like Nifty or S&P 500 allow traders to speculate on broader market trends.
4.3 Commodity Options
Used in commodities markets like gold, crude oil, and agricultural products for hedging or speculation.
4.4 Currency Options
Provide protection or speculation opportunities in the forex market against currency fluctuations.
