Divergence based TradingDivergence occurs when the stochastic oscillator's peaks or troughs disagree with the price. For instance, if the stochastic makes lower highs while the price is rising, it indicates a bearish divergence. Likewise, higher stochastic lows against lower price lows indicate a bullish divergence
Tata

Candle Sticks Pattern part 1Candlestick patterns are a visual representation of price movements in financial markets, used in technical analysis to identify potential trend reversals or continuations. Each candlestick represents a specific time period and shows the opening, closing, high, and low prices during that period. By recognizing these patterns, traders can gain insights into market sentiment and make more informed trading decisions.

Institutional Trading part 6Institutional trading consists of the purchase and sale of financial assets by institutions through their traders. This definition of institutional trading applies to institutional equity trading, institutional stock trading, institutional options trading - any subcategory.

Institutional Trading part 3Institutional trading refers to the buying and selling of securities on behalf of large organizations or institutions, like mutual funds, pension funds, and insurance companies. Unlike retail traders who trade with their personal accounts, institutional traders manage money for others, often in large volumes. They may also have access to more complex financial instruments and investment opportunities.

Institutional Trading part 1Institutional trading consists of the purchase and sale of financial assets by institutions through their traders. This definition of institutional trading applies to institutional equity trading, institutional stock trading, institutional options trading - any subcategory.

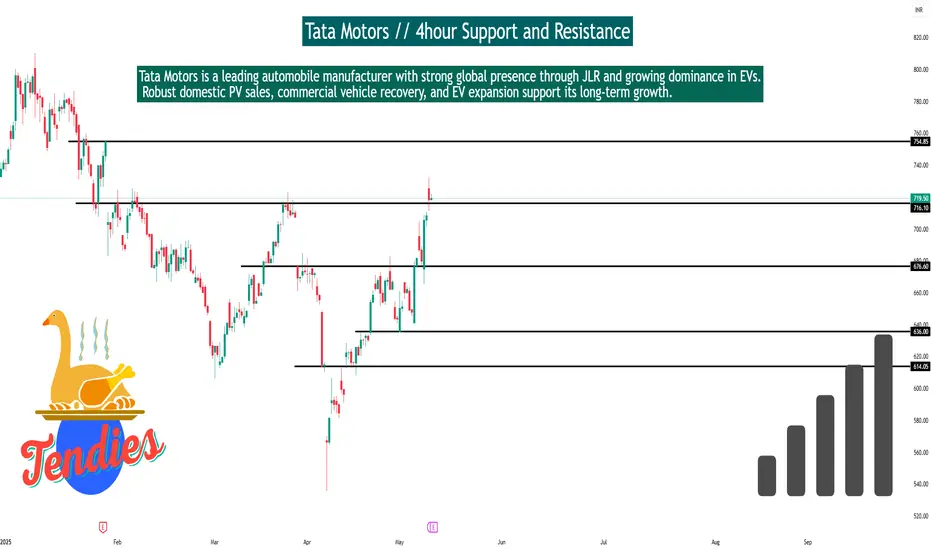
Tata Motors // 4hour Support and ResistanceTata Motors Futures – 4-Hour Timeframe Support & Resistance
Technical Structure:
Trend: Bullish with steady upward channel
Current Price: ~₹1,070
Support Levels:
₹1,045 – recent swing low
₹1,020 – 50-EMA zone & prior demand area
Resistance Levels:
₹1,085 – immediate resistance
₹1,110 – upper trendline & breakout zone
Outlook:
Holding above ₹1,045 keeps momentum positive. Break above ₹1,085 can fuel a rally toward ₹1,110+. Watch price action near support for intraday trade setups.
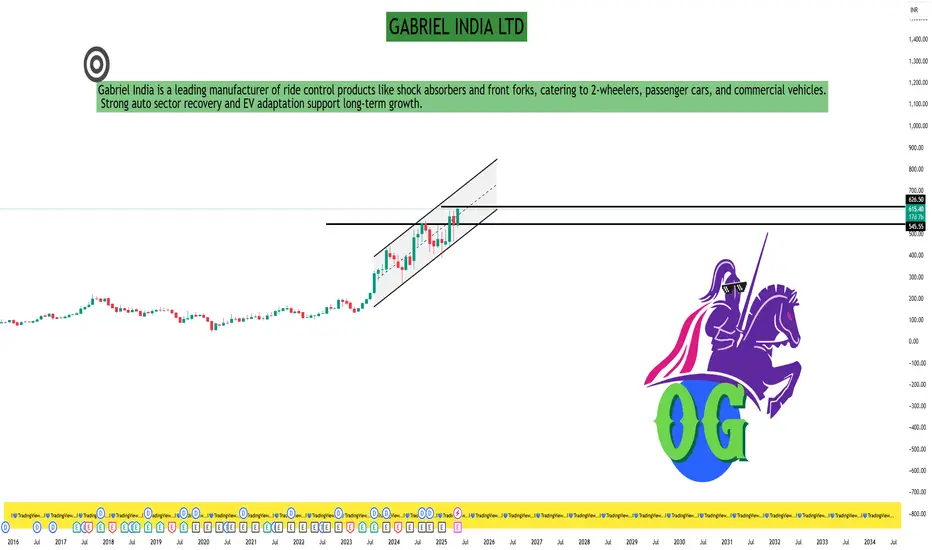
GABRIEL INDIA LTD#GABRIEL
Stock: Gabriel India Ltd
Hits new 52W high at ₹615.40 (+7.83%) today
Strong fundamentals with 77.2% YoY profit growth, 24.7% revenue growth, and high institutional interest.
Auto components leader with solid momentum and rising EPS.
▲ Slightly overvalued now, but great long-term potential in auto sector.
Watch for dips-this could be a gem for long-term investors!
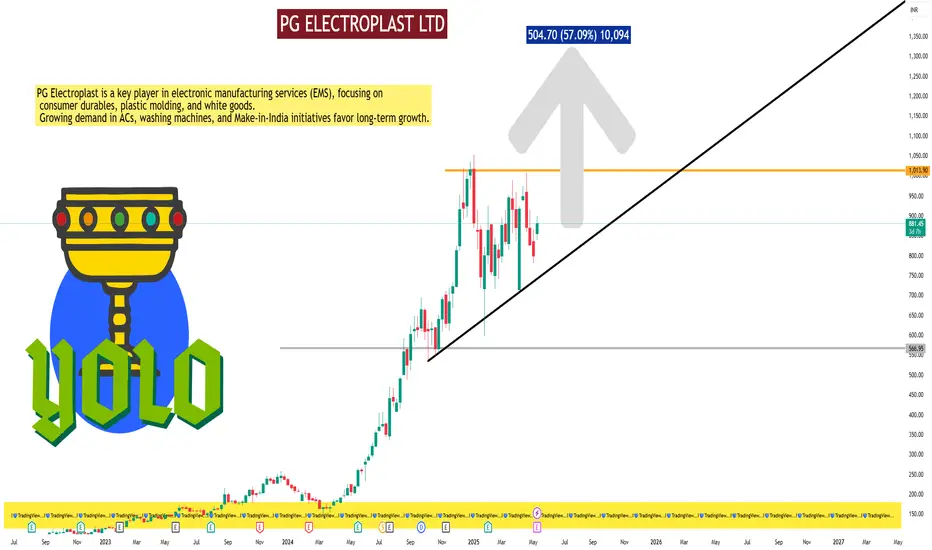
PG ELECTROPLAST LTD#PGEL
Stock: PG Electroplast Ltd
Strong Contender in EMS Space
Industry: Consumer Durables - Consumer Electronics
2 Current Price: *881
3 52W Low to High: 200 → 1,054
(+327%)
Recent Jump: +10.4% in 1 Day on High Volume
| 1-Year Target: 1,385 (Upside: 57%)
Fundamentals
Revenue Growth (YoY): 77%
Net Profit Growth (YoY): 113%
PEG Ratio: 0.8 (Undervalued Growth)
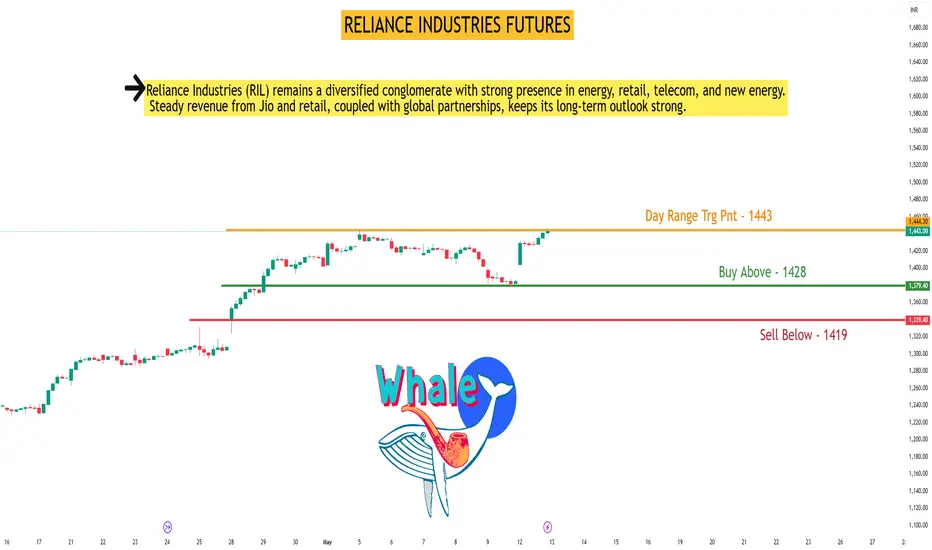
RELIANCE INDUSTRIES FUTURESRELIANCE Future Intraday Technical Analysis Date - 13-May-25 (Tuesday)
Day Range Trigger Point: 1443 | Expected Move: 41 pts
Buy Above: 1428
Average Buy Position: 1424
Target 1: 1468 |
Target 2: 1483
Stop-loss: 1415
Sell Below: 1419
Target 1: 1417 | Target 2: 1402
Stop-loss: 1432
Trading Strategy & Key Insights:
• Trade with structure confirmation and volume breakout strength. • Best Entry Timing:
✓ Before 10:30 AM or after 1:30 PM - Enter instantly on breakout.
✓ Between 10:30 AM to 1:30 PM - Prefer entries near SL zone.
? Respect stoploss & follow volume cues for validation.
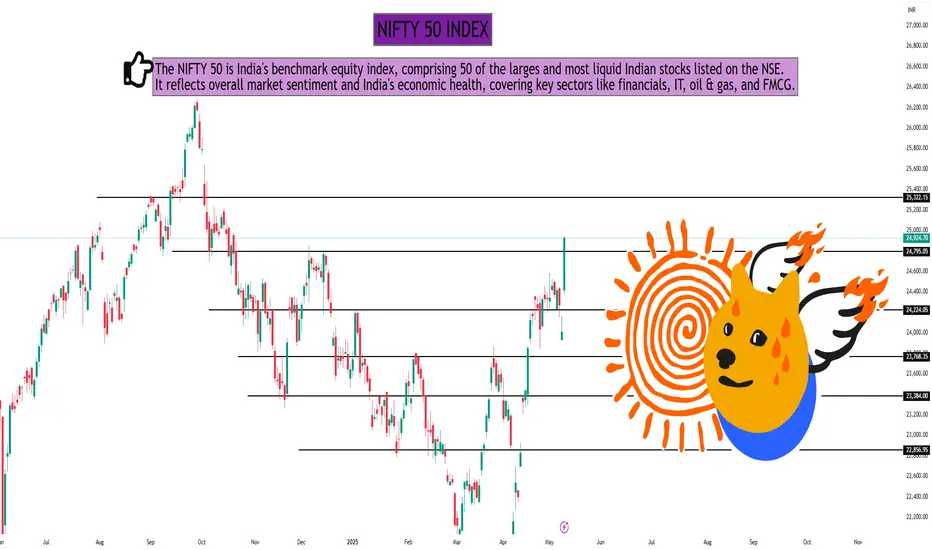
NIFTY 50 INDEX NIFTY 50 Index – 1-Day Timeframe Analysis
Technical Structure:
Trend: Uptrend intact; recent candles show strong bullish momentum.
Price Action: Forming higher highs; currently trading near resistance.
Support Levels: 22,500 / 22,200
Resistance Levels: 22,850 / 23,000
Indicators:
RSI: Around 68 – nearing overbought but still bullish
MACD: Positive crossover sustained
Volume: Rising on green candles – confirms buying interest
Outlook:
If NIFTY sustains above 22,850, a breakout toward 23,200 is likely. A rejection could lead to short-term pullback toward 22,500 support.
Support and Resistance part 2The support and resistance (S&R) are specific price points on a chart expected to attract the maximum amount of either buying or selling. The support price is a price at which one can expect more buyers than sellers. Likewise, the resistance price is a price at which one can expect more sellers than buyers.

Advanced Trading part 2Advanced trading encompasses sophisticated strategies, tools, and techniques used by experienced traders to navigate complex financial markets and potentially generate higher returns. It involves a deeper understanding of market dynamics, risk management, and technical analysis beyond the basics.

Institutional Trading StrategiesInstitutional traders, including high-frequency trading (HFT) firms, hedge funds, proprietary trading firms, and buy-side institutions, leverage sophisticated strategies powered by algorithmic trading and API automation to gain an edge in financial markets.

Instituional trading part 4Institutional trading refers to the buying and selling of securities on behalf of large organizations or institutions, like mutual funds, pension funds, and insurance companies. Unlike retail traders who trade with their personal accounts, institutional traders manage money for others, often in large volumes. They may also have access to more complex financial instruments and investment opportunities.

Financial MarketsFinancial markets are platforms where individuals, companies, and governments trade financial instruments like stocks, bonds, currencies, and derivatives. These markets facilitate the flow of capital, enabling businesses to raise funds, individuals to invest, and governments to manage their finances.

MACD ( Moving Average Convergence Divergence)MACD, or Moving Average Convergence Divergence, is a momentum indicator used in technical analysis to identify changes in the strength, direction, and duration of a trend. It's calculated by finding the difference between two exponential moving averages (EMAs), typically a 12-period and a 26-period EMA.

Option and Database Trading Options data providers collect specific data points that can later be used to determine price movements over time. These price changes in the stock market help investors and brokers decide which stocks might be ideal to sell or buy given current market conditions.

Institutional Trading part 5Institutional traders are defined as traders who engage in the buying and selling of securities for the accounts that they manage for any institution or a group of people. Some of the most common examples of institutional traders are mutual funds, pension funds, insurance companies, and exchange-traded funds. These institutional traders are capable of investing in securities that are generally not available for retail traders. These securities include both swaps and forwards

Institutional Trading part 4Institutional trading consists of the purchase and sale of financial assets by institutions through their traders. This definition of institutional trading applies to institutional equity trading, institutional stock trading, institutional options trading - any subcategory.

Divergence SecretsIn trading, divergence occurs when the price action of an asset moves in the opposite direction to what a technical indicator, such as a momentum oscillator, indicates. This discrepancy can signal a potential change in trend momentum or a possible reversal of the existing trend.

Institutional TradingInstitutional trading involves the buying and selling of financial assets, like stocks and bonds, by large financial institutions. These institutions, such as hedge funds, mutual funds, and pension funds, manage money on behalf of others and trade in significant volumes, potentially influencing market prices. They often require specialized services and technology to execute large trades.

Technical Trading AnalysisTechnical trading is a broader style that is not necessarily limited to trading. Generally, a technician uses historical patterns of trading data to predict what might happen to stocks in the future. This is the same method practiced by economists and meteorologists: looking to the past for insight into the future.

Divergence AnalysisDivergence in technical analysis occurs when the price of an asset moves in the opposite direction of a related technical indicator or oscillator. It signals that the momentum underlying the price trend is changing, which may foreshadow a potential shift in the trend's direction.
