Database Trading part 3Trading data is a sub-category of financial market data. It provides real-time information about stock and market prices as well as historical trends for assets such as equities, fixed-income products, currencies and derivatives. Trading data also includes information about trades historically and over the course of a trading day, such as the latest bid, asking price and time of the last trade
Tata

MACD Trading part 2MACD full form: Moving Average Convergence Divergence and is one of the most widely used momentum indicators in technical analysis. Gerald Appel was the creator of this indicator at the end of the 1970s. By computing the distinction between two time period intervals, which are a compilation of historical time series, this indicator is used to define momentum and its directional resilience. MACD uses moving averages of two distinct time intervals (most commonly historical closing prices of securities), and a momentum oscillator line is calculated by deducting the two moving averages, which is also known as 'divergence.'

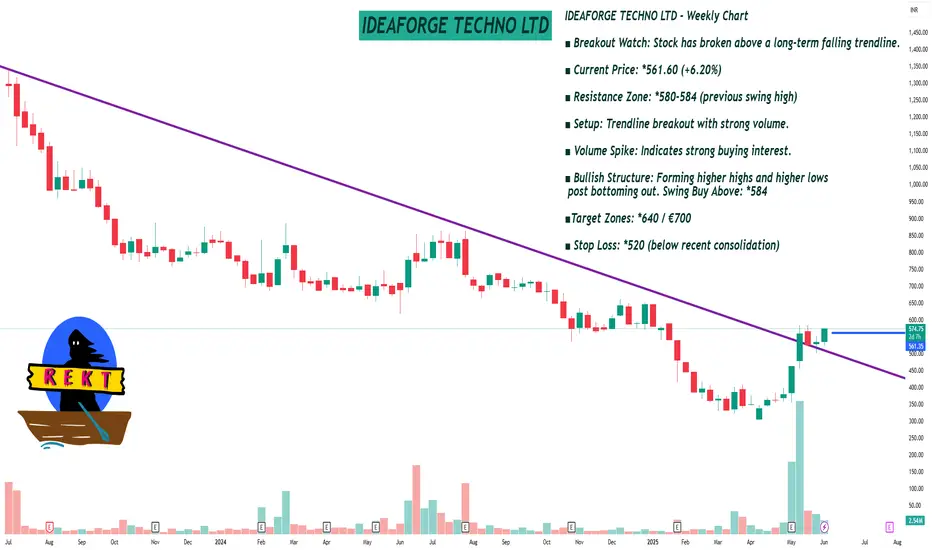
IDEAFORGE TECHNO LTDSwing Trade Alert
#IDEAFORGE
IDEAFORGE TECHNO LTD - Weekly Chart
■ Breakout Watch: Stock has broken above a long-term falling trendline.
■ Current Price: *561.60 (+6.20%)
■ Resistance Zone: *580-584 (previous swing high)
■ Setup: Trendline breakout with strong volume.
■ Volume Spike: Indicates strong buying interest.
■ Bullish Structure: Forming higher highs and higher lows post bottoming out. Swing Buy Above: *584
■Target Zones: *640 / €700
■ Stop Loss: *520 (below recent consolidation)
HINDUSTAN ZINC LTDAs of June 4, 2025, Hindustan Zinc Ltd (NSE: HINDZINC) is trading at ₹468.75, reflecting a 3.44% increase for the day.
📊 Daily Support and Resistance Levels
Based on pivot point analysis:
Central Pivot Point (P): ₹466.93
Support Levels:
S1: ₹459.46
S2: ₹450.18
S3: ₹442.71
Resistance Levels:
R1: ₹476.21
R2: ₹483.68
R3: ₹492.96
These levels are derived from standard pivot point calculations and are commonly used by traders to identify potential support and resistance zones.
📈 Technical Overview
Trend: The stock has demonstrated strong upward momentum, with a 3.44% increase on the day.
Technical Indicators:
RSI (14-day): 62.24, indicating bullish momentum.
MACD: 7.03, suggesting a positive trend.
ADX: 18.90, indicating a developing trend.
Stochastic Oscillator: 78.66, nearing overbought territory.
Supertrend: 426.69, supporting bullish sentiment.
Parabolic SAR (PSAR): 436.97, indicating an upward trend.
Volatility: The stock exhibits moderate volatility, with a beta coefficient of 1.10.
🔍 Additional Insights
Hindustan Zinc Ltd has shown a strong bullish trend in recent sessions. The RSI and MACD indicators suggest continued upward momentum, while the proximity to resistance levels warrants cautious optimism. Traders should monitor these levels closely for potential breakout or reversal signals.
Please note that stock prices are subject to market risks and can change rapidly. It's advisable to consult with a financial advisor before making investment decisions.

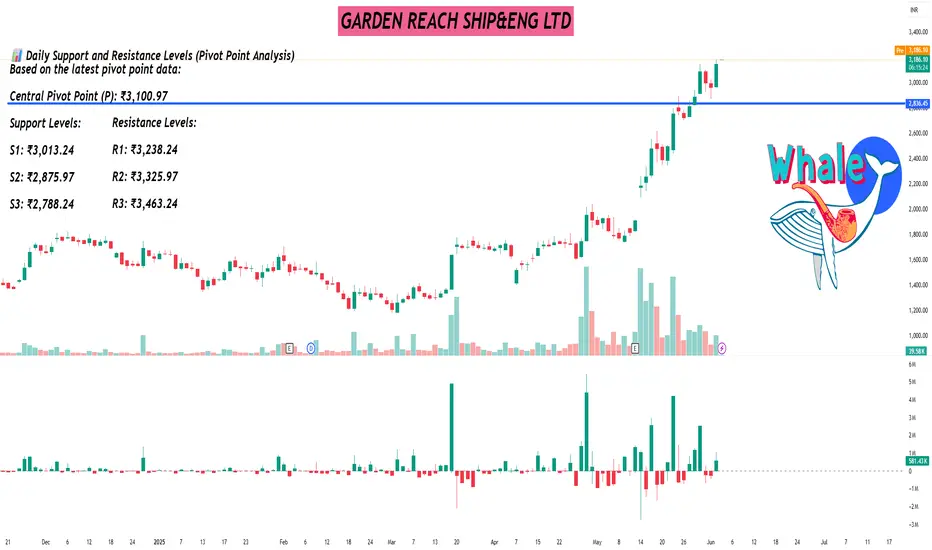
GARDEN REACH SHIP&ENG LTDAs of June 4, 2025, Garden Reach Shipbuilders & Engineers Ltd (NSE: GRSE) is trading at ₹3,150.50, marking a 6.22% increase for the day and reaching a new 52-week high .
📊 Daily Support and Resistance Levels (Pivot Point Analysis)
Based on the latest pivot point data:
Central Pivot Point (P): ₹3,100.97
Support Levels:
S1: ₹3,013.24
S2: ₹2,875.97
S3: ₹2,788.24
Resistance Levels:
R1: ₹3,238.24
R2: ₹3,325.97
R3: ₹3,463.24
These levels are derived from standard pivot point calculations and are commonly used by traders to identify potential support and resistance zones .
📈 Technical Overview
Trend: The stock has demonstrated strong upward momentum, with a 15.15% increase over the past week and a 64.35% rise over the past month .
Volatility: GRSE exhibits high volatility, with a beta coefficient of 3.08, indicating that the stock is more volatile than the market average .
Relative Strength Index (RSI): The 14-day RSI stands at 75.78, suggesting that the stock is in overbought territory, which may precede a price correction .
🔍 Additional Insights
Recent technical indicators suggest that GRSE is experiencing strong bullish momentum. However, the elevated RSI indicates that the stock may be overbought, and investors should be cautious of potential short-term corrections.
Please note that stock prices are subject to market risks and can change rapidly. It's advisable to consult with a financial advisor before making investment decisions.
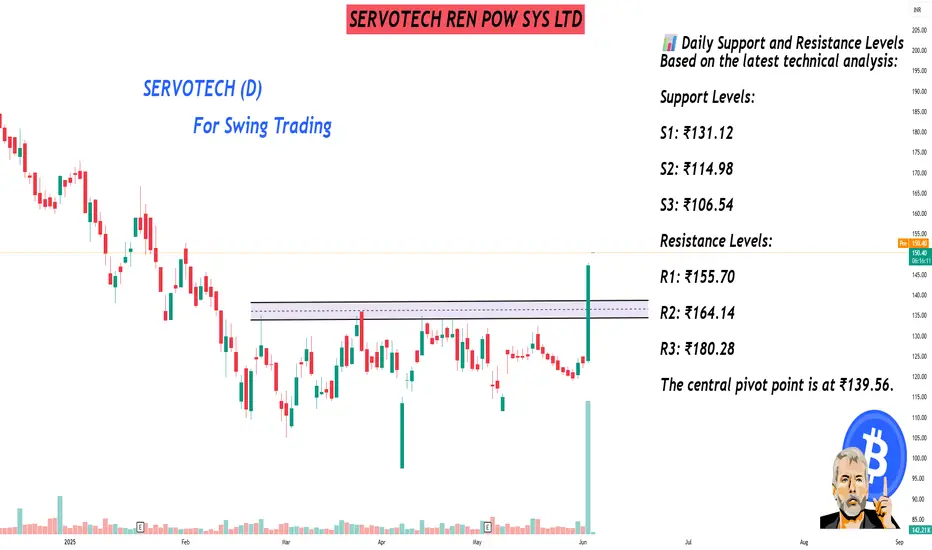
SERVOTECH REN POW SYS LTDAs of June 4, 2025, Servotech Renewable Power Systems Ltd (NSE: SERVOTECH) is trading at ₹147.26.
📊 Daily Support and Resistance Levels
Based on the latest technical analysis:
Support Levels:
S1: ₹131.12
S2: ₹114.98
S3: ₹106.54
Resistance Levels:
R1: ₹155.70
R2: ₹164.14
R3: ₹180.28
The central pivot point is at ₹139.56.
📈 Technical Overview
Trend: The stock has exhibited strong upward momentum, with a 19.39% return in one day, 13.95% over the past month, and 33.27% in the last three months.
Technical Indicators: The Relative Strength Index (RSI) is at 82.637, indicating overbought conditions. Other indicators like MACD and ADX suggest a strong bullish trend.
Volatility: The stock has shown average daily movements with good trading volume, indicating medium risk.
🔍 Additional Insights
Servotech Renewable Power Systems Ltd recently garnered attention due to significant developments, including a visit from Errol Musk, which may have influenced investor sentiment.
Please note that stock prices are subject to market risks and can change rapidly. It's advisable to consult with a financial advisor before making investment decisions.
NDR AUTO COMPONENTS LTDAs of June 3, 2025, NDR Auto Components Ltd (NSE: NDRAUTO) is trading at ₹994.50.
📊 Daily Support and Resistance Levels
Based on pivot point analysis:
Support Levels:
S1: ₹949.17
S2: ₹933.58
S3: ₹917.17
Resistance Levels:
R1: ₹981.17
R2: ₹997.58
R3: ₹1,013.17
The central pivot point is at ₹965.58.
📈 Technical Overview
Trend: The stock has shown strong upward momentum, rising approximately 47% over the past month.
Technical Indicators: Currently trading above key resistance levels, suggesting bullish sentiment.
Volatility: With a beta of 1.92, the stock exhibits higher volatility compared to the market.
🔍 Additional Insights
NDR Auto Components recently reported a 41.17% increase in net profit for the March 2025 quarter, indicating strong financial performance.
Please note that stock prices are subject to market risks and can change rapidly. It's advisable to consult with a financial advisor before making investment decisions.

NATIONAL FERT. LTDNATIONAL FERTILIZERS LTD
1 Day Support and Resistance (Based on Latest Price: ₹107.38)
Support Levels: ₹104.50 / ₹101.20 / ₹97.80
Resistance Levels: ₹110.00 / ₹114.30 / ₹118.00
Chart Note: Strong momentum above ₹110 may push the stock towards the ₹114–₹118 zone; watch for volume confirmation.

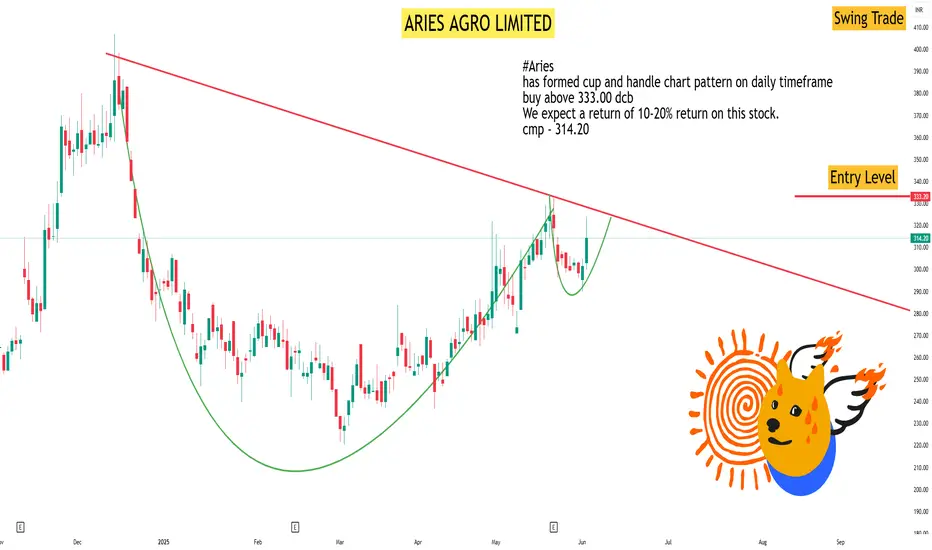
ARIES AGRO LIMITEDARIES AGRO LIMITED – 1 Day Support and Resistance (Based on Latest Price Action)
CMP: ₹314.20
Support Levels: ₹308.00 / ₹300.50 / ₹292.00
Resistance Levels: ₹320.00 / ₹333.00 / ₹348.00
Chart Note: Forming a classic Cup and Handle breakout setup. Sustaining above ₹333.00 can trigger strong upside momentum.
NIFTY50 & NIFTYBANK#NIFTY50
#NIFTYBANK
This is not a buy or sell recommendation only for educational purposes and I am not a SEBI registered.
Indian Stock Market Outlook - Wednesday, June 4, 2025
Market Overview
Nifty 50 closed at 24,542.5 on June 3, 2025.
Bank Nifty closed at 55,599.95 on June 3, 2025.
The Indian equity markets experienced a downturn on June 3, 2025, with both Nifty 50 and Bank Nifty closing lower. This decline was attributed to weak global cues and rising concerns over stretched valuations.
Global and Domestic Factors Impacting Today's Session
US Tariffs: The announcement of new tariffs by the US led to a spike in steel and aluminium prices, affecting global markets and causing shares of foreign
steelmakers to slump.
RBI Monetary Policy: The Reserve Bank of India's three-day Monetary Policy Committee meeting commenced on June 3, with the outcome expected on June 6. Investors are cautious ahead of the policy announcement.
FII Outflows: Foreign Institutional Investors have been aggressively offloading Indian equities, pulling out over *1 lakh crore so far in 2025, leading to increased market volatility.
Technical Levels
Nifty 50:
Support: 24,400
Resistance: 24,700
Bank Nifty:
Support: 55,000
Resistance: 56,500
Sectoral Performance
Underperforming Sectors: Finance and IT sectors faced significant declines due to global trade concerns and valuation pressures.
Resilient Sectors: Infrastructure and defense sectors are expected to remain resilient, driven by government initiatives and increased spending.
✰ Stocks in Focus
1. Tata Motors: Announced a dividend, attracting investor attention.
2. TCS: Declared a stock split and bonus issue, making it a stock to watch.
3. Larsen & Toubro (L&T): Expected to benefit from India's focus on infrastructure development and government projects.
4. HDFC Bank: Analysts favor top-tier banks like HDFC Bank amidst current market conditions.
5. Infosys: IT sector under pressure, but Infosys remains a key player to monitor for potential recovery.
Market Sentiment
The market sentiment remains cautious with a bearish bias due to global uncertainties and domestic policy expectations. Traders are advised to stay vigilant and consider risk management strategies during this period.
Upcoming Events
June 6, 2025: RBI Monetary Policy announcement.
Disclaimer: This newsletter is for informational purposes only and does not constitute financial advice. Please consult with a financial advisor before making any investment decisions.

Candlestick patterns part 1Candlestick patterns are graphical representations of price movements over a specific time period, used in financial technical analysis to identify potential trend reversals or continuations. Each candlestick shows the opening, closing, high, and low prices of a financial asset. Corporate Finance Institute explains that by observing these patterns, traders can gain insights into the market sentiment and potential future price movements.

PCR Trading Strategy The Put-Call Ratio (PCR) is a valuable tool for traders to gauge market sentiment and potentially identify opportunities. It's calculated by dividing the total open interest of put options by the total open interest of call options. A higher PCR (above 1) suggests bearish sentiment, while a lower PCR (below 1) indicates bullish sentiment.

Learn Institutional Trading part 4Institutional trading involves large-scale buying and selling of financial instruments, such as stocks, bonds, currencies, and commodities, executed by major organizations like mutual funds, pension funds, insurance firms, and banks.

Learn Institutional Trading part 3Institutional trading involves the buying and selling of securities (like stocks, bonds, and derivatives) by large financial institutions on behalf of their clients or for their own accounts. These institutions, including mutual funds, hedge funds, pension funds, and banks, often have significant capital and require specialized tools and strategies for executing large-scale trades.

Divergence In trading, divergence refers to a scenario where the price of an asset and a technical indicator move in opposite directions, potentially indicating a change in trend momentum. It's a discrepancy between what the price action suggests and what a technical indicator is showing. This discrepancy can signal a possible trend reversal, making it a valuable tool for traders to identify potential entry or exit points.

MACD ( Moving Average Convergence/Divergence) Trading The Moving Average Convergence/Divergence indicator is a momentum oscillator primarily used to trade trends. Although it is an oscillator, it is not typically used to identify over bought or oversold conditions. It appears on the chart as two lines which oscillate without boundaries.

Option and Database Trading In financial terms, options trading involves buying and selling contracts that give the holder the right, but not the obligation, to buy or sell an underlying asset at a specified price within a set timeframe. This contrasts with database trading, which refers to the manipulation and utilization of data within databases for various purposes, such as querying, updating, and analyzing information.

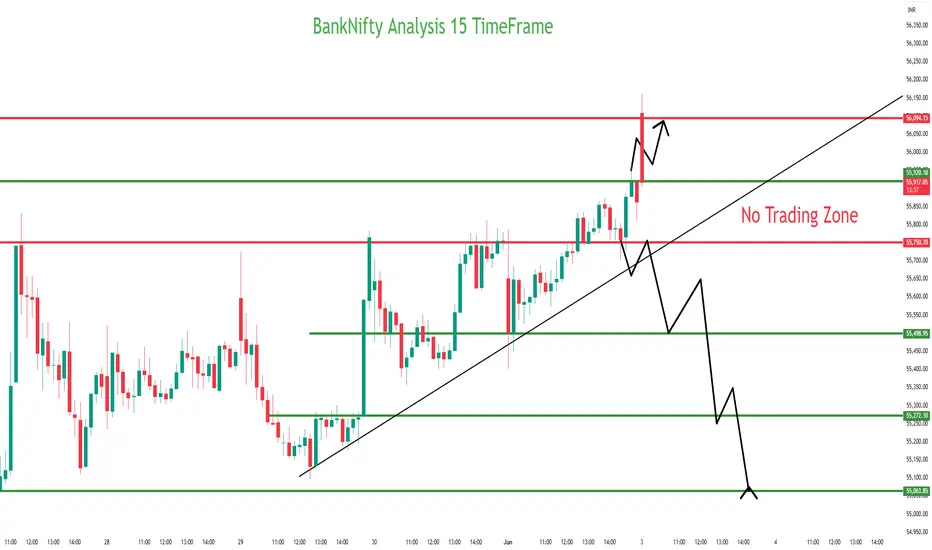
BankNifty Analysis 15 TimeFrame#Banknifty
BANKNIFTY INTRADAY ANALYSIS FOR
TODAY
Time Frame - 15 min.
Date 03/06/2025
That's my Analysis.
I do not give any advice about buying and selling. The information provided is for
educational purposes only. *
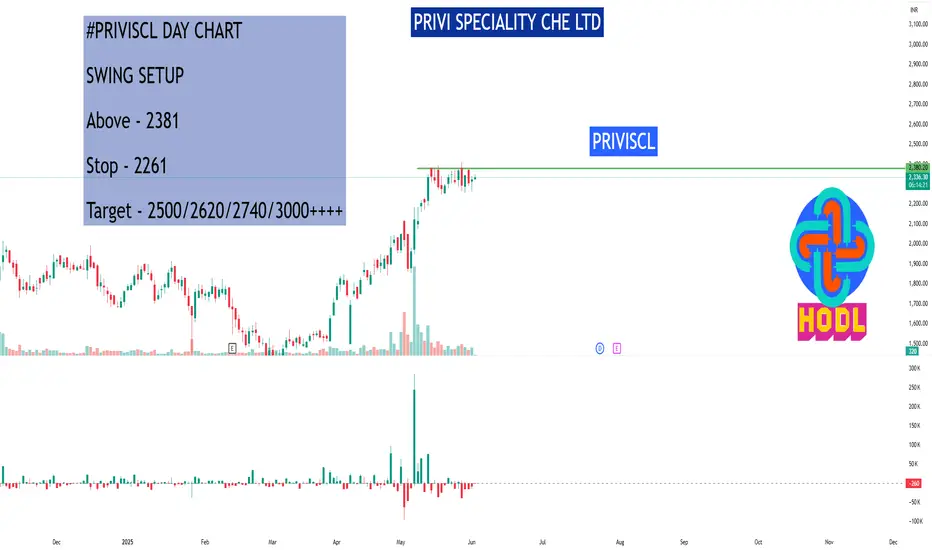
PRIVI SPECIALITY CHE LTD#PRIVISCL DAY CHART
SWING SETUP
Above - 2381
Stop - 2261
Target - 2500/2620/2740/3000++++
Disclaimer:
This is not financial advice. Please do your own research or consult with a financial advisor before making any investment decisions. Investments in stocks can be risky and may result in loss of capital.
BOROSIL RENEWABLES LTDintraday trade
stock: @bororenew
buy above: ₹562
target: ₹565, ₹568+++
#bororenew

INDIAN BANKAs of the close on June 2, 2025, Indian Bank (NSE: INDIANB) traded at ₹646.80, up 4.72% from the previous close of ₹617.65.
📊 Intraday Support and Resistance Levels
Based on technical analysis, here are the key intraday support and resistance levels for Indian Bank:
Support Levels:
₹620
₹600
₹585
Resistance Levels:
₹650
₹670
₹700
These levels are derived from recent price action and technical indicators. The stock has broken a strong resistance at ₹585 and is expected to move up further.
🧠 Analyst Insights
Technical indicators suggest a bullish trend for Indian Bank. The stock is trading above its key moving averages, indicating positive momentum. Analysts recommend monitoring the ₹650 resistance level closely; a decisive move above this could lead to further upside towards ₹670 and ₹700.
📈 Summary
Current Price: ₹646.80
Support Levels: ₹620, ₹600, ₹585
Resistance Levels: ₹650, ₹670, ₹700

YES BANK LTDAs of the close on June 2, 2025, Yes Bank Ltd. (NSE: YESBANK) ended the trading session at ₹23.28, marking an 8.38% increase from the previous close.
📊 Intraday Support and Resistance Levels
Based on recent technical analyses, here are the key support and resistance levels for Yes Bank:
Classic Pivot Points
Resistance Levels: R1: ₹24.00, R2: ₹24.71, R3: ₹26.04
Support Levels: S1: ₹21.96, S2: ₹20.63, S3: ₹19.92
Pivot Point: ₹22.67
Fibonacci Pivot Points
Resistance Levels: R1: ₹23.45, R2: ₹23.93, R3: ₹24.71
Support Levels: S1: ₹21.89, S2: ₹21.41, S3: ₹20.63
Pivot Point: ₹22.67
Camarilla Pivot Points
Resistance Levels: R1: ₹23.47, R2: ₹23.65, R3: ₹23.84
Support Levels: S1: ₹23.09, S2: ₹22.91, S3: ₹22.72
Pivot Point: ₹22.67
🧠 Analyst Insights
According to technical analysts:
A support level is identified at ₹21.30, with resistance at ₹22.90. A decisive move above ₹23 could lead to further upside towards ₹25.
The stock has crossed its key swing high near ₹22. If buying interest continues, it could see a short-term upward move, potentially reaching the ₹25–26 range. On the downside, support levels are around the ₹20–21 zone.
📈 Summary
Yes Bank's recent price action indicates a bullish trend, with the stock closing above several key resistance levels. If the stock maintains momentum above ₹23, it may target the ₹25–26 range in the near term. However, traders should monitor the support levels at ₹21.30 and ₹20.00 for potential pullbacks.

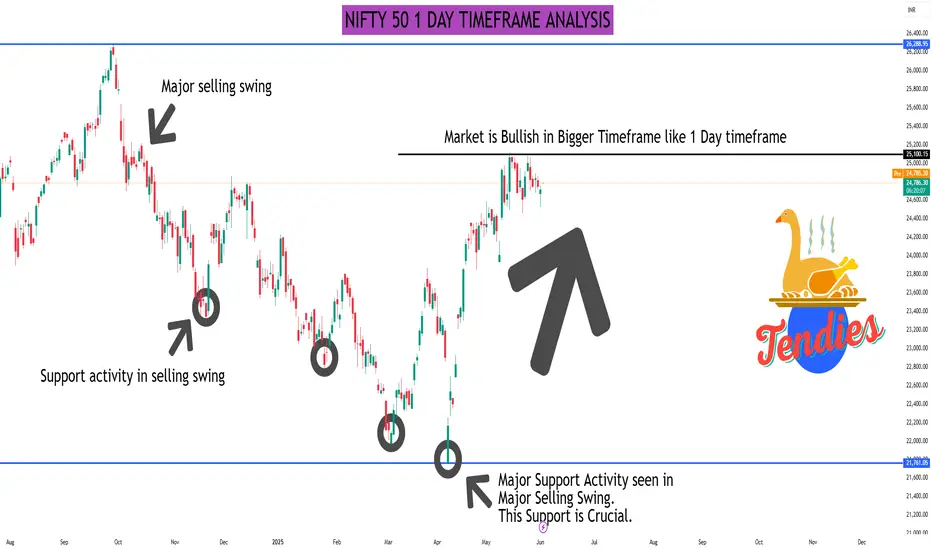
NIFTY 50 1 DAY TIMEFRAME ANALYSISTRADING PLANE FOR 3 JUNE 2025
MARKET OVERVIEW
Market is Bullish in Bigger Timeframe
But Choppy in 5 mins TF
Bias- Buying side
High Probabilty Case for Buying:
In Morning Market Shows Strength by Testing Higher Level or Sustaining On Higher Level, then Buy on after Selling Swing Completion With Strong Support Creation
Confirmation on Engulfing Candle Form after Support Creation.