Tatachemical

Tata Chemicals | Double Bottom - WeeklyDouble Bottom pattern observed in Tata Chemicals. Neck level was broken in second week of May thereby confirming the pattern. The recent fall could be counted as neck level retesting. In that case the stock will move up to 672 where the pattern target falls. However, a trendline still holds and we could see noticeable resistances at 635 and 658. A break above 635 will be key. Hence, if resistance at 635 fails Tata Chemicals could move swiftly towards double bottom target.
(Disclaimer: Our charts and contents are just for the purpose of analysis, learning and general discussion. Do not consider these as trading tips or investment ideas. Trading in Stocks, Futures and Options carry risk and is not suitable for every investor. Hence it is important to do your own analysis before making any investment or trading decisions based on you personal circumstances and it is always better to take advice from professionals)

TATACHEM short term bearishTATACHEM 4hr time frame short term bearish if 601 holds then move up till 647 if not then down to 555 possible.

TATACHEM SHORT TATA CHEMICALS Short Term SELL____FOR EDUCATIONAL PURPOSES ____ NOT A TRADING ADVICE____
TATACHEM Looking for a sharp Down move from here, is now consolidating at a Supply Zone and broke down weekly pivot.

tatachemif it crosses 614 with a good volume, we can see fair-play........if not, wait for 555 again..... and catch it at that level.

Tata Chemical Long (Risky)Stock made doji and gravestone doji pattern at downtrend also able to survive above fibonacci retracement level.
Note : Not a single indicator is supporting for long trade. Very risky trade
Buy above 592 Target = 596, 599 SL = 588(Only for risky traders)
Sell Below 588 target = 584, 581 SL = 592
#Illuminati


POSITIONAL TRADE IN TATACHEM APRIL (FUT)POSITIONAL TRADE IN TATACHEM
APRIL FUT
BUY@608
STOP@594
TARGET@628
LOT:750
QTY:4

Tata chemical buy @580 with stop of 569 7 target 600++Tata chemical is above cloud on 125 min chart, the chakou is above the price as well as free to move up, along with a positive tenken-kejun cross. Indicating a possibility of upmove in this stock.
Is a more Risky trade but one can buy small qty at 580-85 levels wih stop of 569 and target of 600-620-640.


Tata Chemicals- Short term view-BullishNSE:TATACHEM
CMP:720
1. Ascending triangle breakout done.
2. Indicators are showing bullish signals.
3.Daily,Weekly MACD crossover may happen on upcoming days&weeks.
These factors may help to reach our target levels.
Vijayaraghavan.K,
Kovilpatti

TATACHEM #SELL BELOW 687.6INTRADAY TRADE (TRADE FOR TOMORROW | NOVEMBER 16th)
TATACHEM #SELL BELOW 687.6


Tata Chem, Weekly: Probably it will test "B" zone = 585/600 NSE:TATACHEM Stock facing resistance after reaching 161.8% Fibo extension. Price action also suggests reversal on the cards. It may test "B" zone = 585/600 Levels. Stop above 780.

Continuation, Not Revenge: 3 Positive TradesYesterday I was trapped in NBCC and suffered small loss..see >>>
So the stock was already on my radar. Today, my buy setup was to wait for closing above 255 (my psychological key level yesterday) on 5 min. chart and enter above this closing candle. After few hiccups in the morning, there was a closing above the key 255 level @ 255.35. So my entry was at 255.50 with stop 254 and the first 1:1 target of 257. The target was achieved in the very same entry candle. After some consolidation, the second target 1:2 @ 258.50 was also achieved. I am still trailing with 1/3rd position.
I ll post the other two positive trades in the update section shortly.
Hit like, comment and follow.
Trade safe, be healthy.
Regards
Bravetotrade

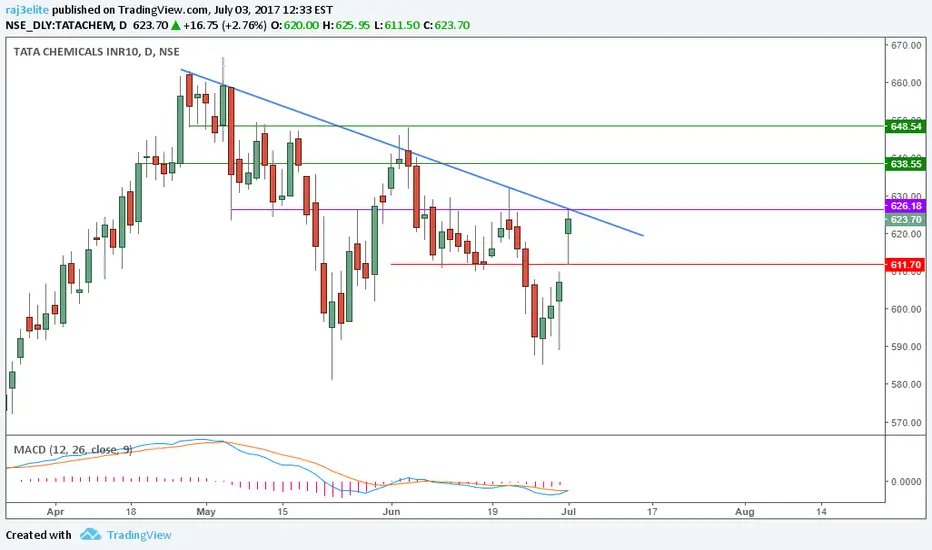
Trend Line breakout in Tata ChemicalsTrend Line breakout in Tata Chemicals on EOD chart and the price will move upside when completion of the breakout.
Trade:
Buy above - 626.50
Target 1 - 638.50
Target 2 - 648.50
Stop Loss - 611.50
Symmetric Triangle on Tata chemSymmetric Triangle formation on Tatachem and may break either side but currently seems like to break on downside. MACD also currently on below '0'. Anyway this pattern may break either side so trade only after break out happen.
Trade for Long:
Buy above - 626.50
Target 1 - 635.50
Target 2 - 644.00
Stop Loss - 613.50
Trade for Short:
Short below - 613.50
Target 1 - 603.50
Target 2 - 595.00
Stop Loss - 626.50
Note : Don't enter into trade until the pattern get the breakout.


H&S - TataChemTata Chemical is showing head a shoulders pattern. Expect downwards movement to 545 levels. This is also confirmed by the MACD falling below the signal line.
The short term chart (thanks to Vanati) shows a descending triangle pattern with a dead cat bounce.
