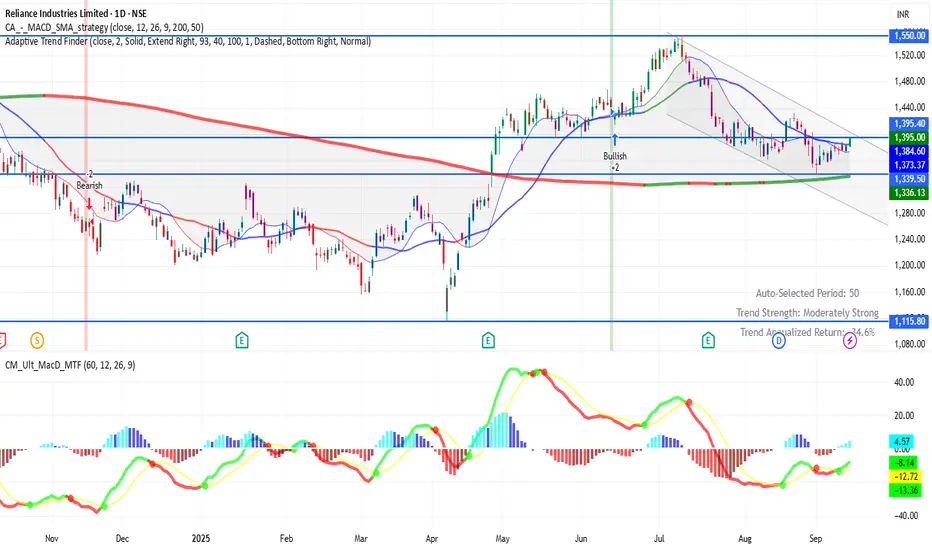
RELIANCE 1D Time frame Current Status
Price around ₹1395
Day range: ₹1380 – ₹1396
52-week range: ₹1115 – ₹1551
Key Levels
Support zones: ₹1380 → ₹1370 → ₹1350
Resistance zones: ₹1400 → ₹1410 → ₹1430
Tatamotors
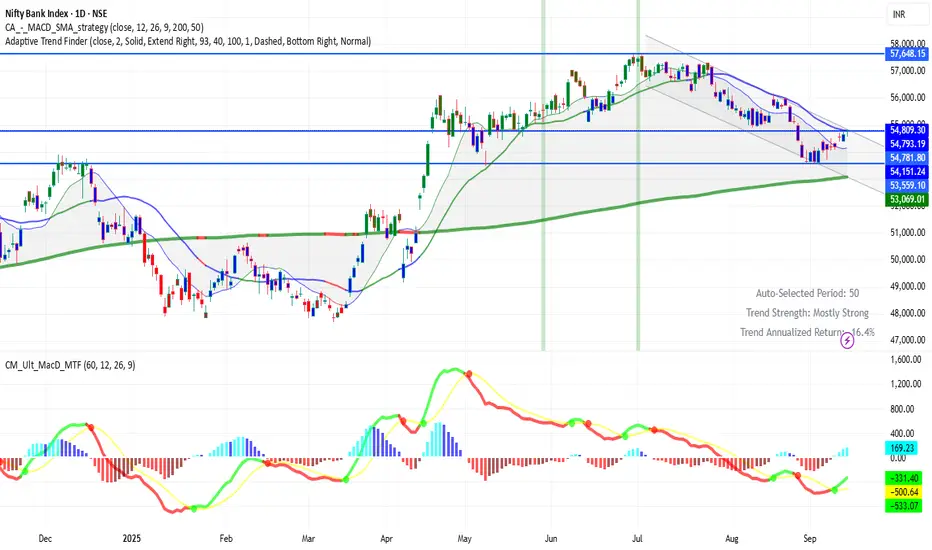
BANKNIFTY (1D timeframe)📍 Current Level
Trading around 54,809 points
🔑 Key Levels
Immediate Resistance: 55,000 → 55,200
Immediate Support: 54,400 → 54,500
Deeper Support: 53,800 → 53,500
✅ Outlook
If BankNifty breaks and holds above 55,000–55,200, more upside is possible.
If it falls below 54,400–54,500, weakness can take it down toward 53,800–53,500.
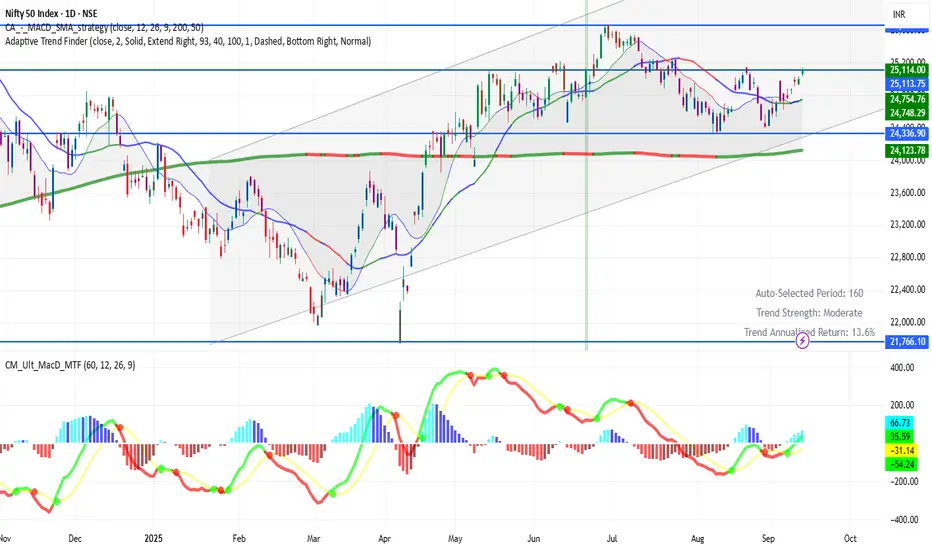
NIFTY (1D timeframe)📍 Current Level
Trading around 25,114
🔑 Key Levels
Immediate Resistance: 25,150 → 25,200
Immediate Support: 25,000 → 24,950
Deeper Support: 24,800 → 24,600
✅ Outlook
If Nifty sustains above 25,150–25,200, more upside can open up.
If it slips below 24,950–25,000, weakness may extend toward 24,800–24,600.
Part 8 Trading Master ClassIntroduction to Options
Financial markets provide several instruments to trade and invest. Among equities, futures, commodities, and currencies, options trading has gained significant popularity worldwide, including India. Options are not just speculative tools; they are also powerful instruments for hedging, income generation, and risk management.
An option is essentially a derivative contract—its value is derived from an underlying asset like a stock, index, commodity, or currency. Unlike direct stock ownership, an option gives the buyer rights but not obligations. This unique feature makes them versatile but also complex for beginners.
To truly master options, one must understand not only the basic definitions but also pricing, market psychology, and strategies.
Basic Terminology
Before diving deeper, let’s go through the essential terms:
Option Contract: Agreement between buyer and seller based on an underlying asset.
Underlying Asset: Stock, index, commodity, or currency.
Strike Price: Pre-decided price at which the option can be exercised.
Expiry Date: The last date on which the option can be exercised.
Premium: Price paid by the buyer to acquire the option.
Lot Size: Minimum quantity for which an option can be traded.
European vs. American Options: European can be exercised only on expiry; American anytime before expiry.
Call & Put Options Explained
At the heart of option trading are two instruments: Calls and Puts.
Call Option: Gives the buyer the right (not obligation) to buy the asset at the strike price.
Buyers expect prices to rise.
Sellers (writers) expect prices to stay flat or fall.
Put Option: Gives the buyer the right (not obligation) to sell the asset at the strike price.
Buyers expect prices to fall.
Sellers expect prices to stay flat or rise.
📌 Example:
If Reliance stock trades at ₹2500:
A ₹2600 call may cost ₹50 premium. If the stock rises to ₹2700, profit = (2700-2600-50) = ₹50 per share.
A ₹2400 put may cost ₹40. If stock falls to ₹2200, profit = (2400-2200-40) = ₹160 per share.

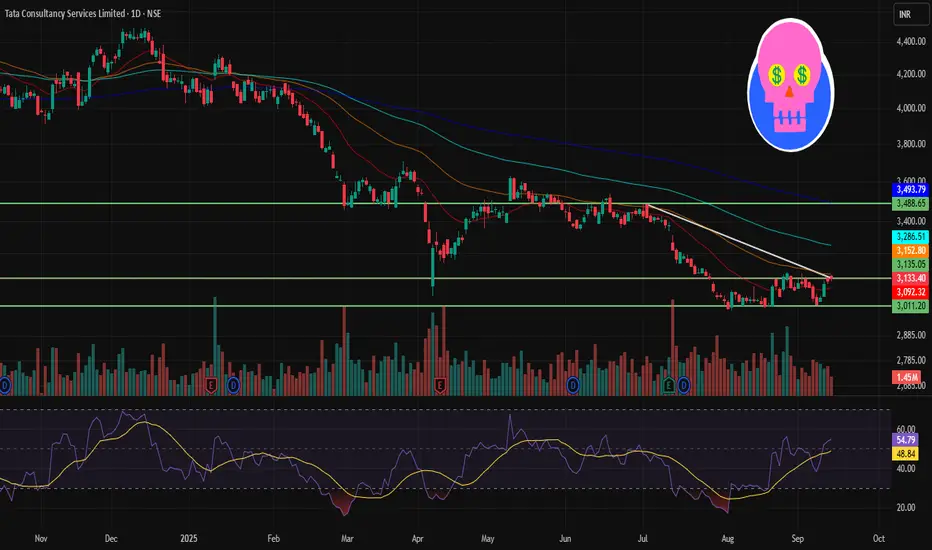
TCS 1D Time frame🔢 Current Level
~ ₹3,131
🔑 Key Resistance & Support Levels
Resistance Zones:
~ ₹3,160 – ₹3,180 (near-term resistance)
~ ₹3,200 – ₹3,220 (stronger resistance above)
Support Zones:
~ ₹3,120 – ₹3,100 (immediate support)
~ ₹3,050 – ₹3,000 (secondary support)
~ ₹2,900 (deeper support if weakness intensifies)
📉 Outlook
Bullish Scenario: If TCS holds above ~ ₹3,120 and manages to break past ~ ₹3,180 – ₹3,200, there is potential to move toward ~ ₹3,220+
Bearish Scenario: A drop below ~ ₹3,100 could lead to a slide toward ~ ₹3,050 or lower
Neutral / Range: Between ~ ₹3,100 – ₹3,180, TCS may consolidate until a clearer breakout or breakdown
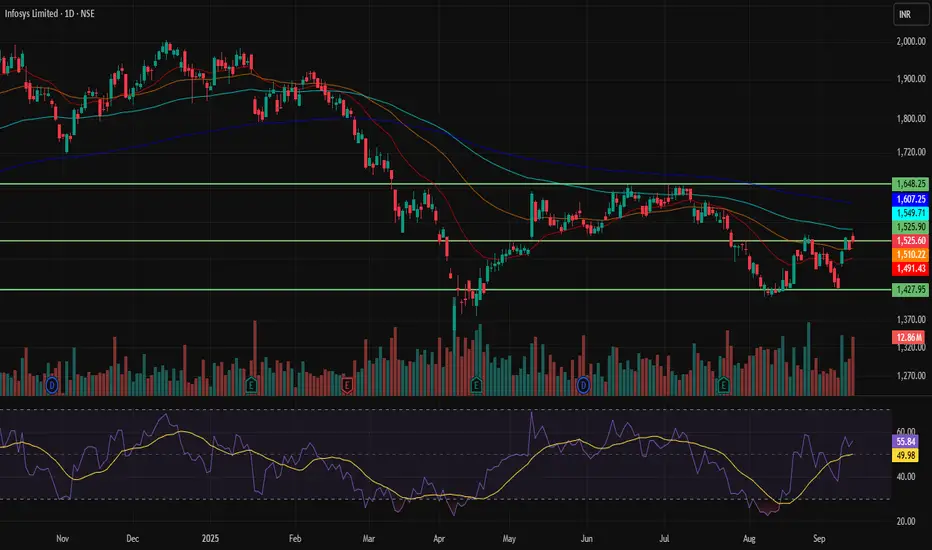
INFY 1D Time frame🔢 Current Level
Trading near ₹1,525.60
🔑 Key Resistance & Support Levels
Resistance Zones:
~ ₹1,539 – ₹1,552 (near-term resistance)
~ ₹1,560 – ₹1,570 (stronger resistance if price moves higher)
Support Zones:
~ ₹1,510 – ₹1,500 (immediate support)
~ ₹1,470 – ₹1,450 (secondary support)
~ ₹1,380 – ₹1,400 (deeper support if selling pressure builds)
📉 Outlook
Bullish Scenario: A close above ₹1,540 could fuel momentum toward ₹1,560+.
Bearish Scenario: If it slips below ₹1,510, risk opens toward ₹1,470 or even ₹1,400.
Neutral / Range: Likely sideways between ₹1,510 – ₹1,552 until a breakout.
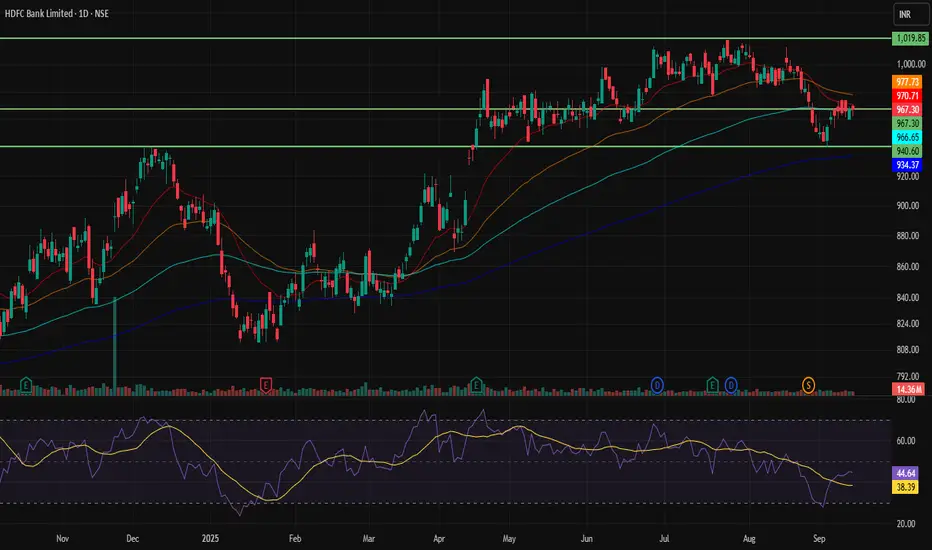
HDFCBANK 1D Time frame🔢 Current Level
Trading around ₹967
🔑 Key Resistance & Support Levels
Resistance Zones:
~ ₹970 – ₹975 (near-term resistance)
~ ₹980 – ₹985 (stronger resistance zone if it moves past the first)
Support Zones:
~ ₹962 – ₹960 (immediate support)
~ ₹955 – ₹950 (short-term support)
~ ₹945 – ₹940 (deeper support if price falls further)
📉 Outlook
Bullish Scenario: If HDFCBANK holds above ₹970 and clears resistance around ₹975, it may aim for ₹980+.
Bearish Scenario: If it drops below ₹960, it could test support in the ₹950-₹940 region.
Neutral / Range: Likely to trade sideways between ₹960-₹975 unless there’s a strong breakout or breakdown.
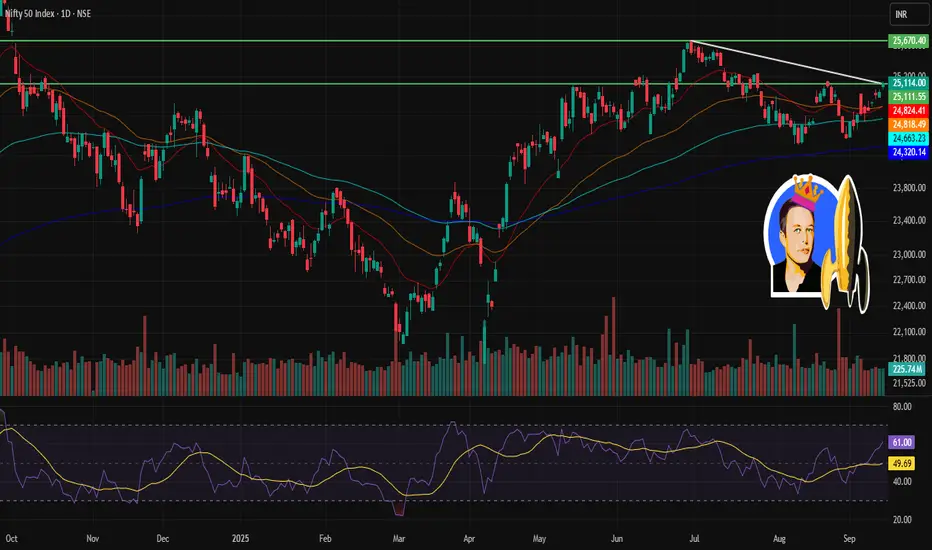
NIFTY 1D Time frame🔢 Current Level
NIFTY ~ 25,114
🔑 Key Resistance & Support Levels
Resistance Zones:
~ 25,200 – 25,250 (near-term resistance)
~ 25,400 – 25,500 (stronger resistance if it breaks above the first zone)
Support Zones:
~ 24,950 – 25,000 (immediate support)
~ 24,800 – 24,900 (short-term support)
~ 24,600 – 24,700 (deeper support, in case of downside move)
📉 Outlook
Bullish Scenario: If NIFTY holds above ~25,000 and clears ~25,250, it may head toward ~25,400-25,500.
Bearish Scenario: If it drops below ~24,950, then weakness may drag it toward ~24,800 or lower supports.
Neutral / Range: Between ~25,000 – 25,250 likely consolidation until a decisive move.
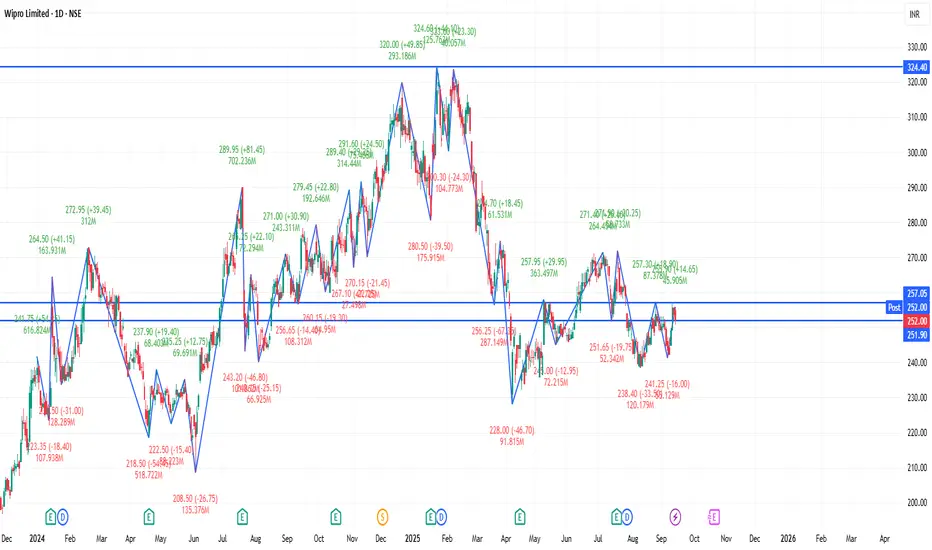
WIPRO 1D Time frame🔢 Current Level
Trading around ₹252.91
🔑 Key Resistance & Support Levels
Resistance Zones:
₹254.00 – ₹255.00 (recent highs; breakout above this may lead to further upside)
₹260.00 – ₹262.00 (stronger resistance above)
Support Zones:
₹250.00 – ₹251.00 (immediate support; failure to hold above this may lead to a decline)
₹245.00 – ₹246.00 (short-term support; a break below this could indicate weakness)
₹240.00 – ₹242.00 (deeper support zone if price dips further)
📉 Outlook
Bullish Scenario: If Wipro holds above ₹251.00, upward momentum may continue. Break above ₹255.00 can open the way toward ₹260.00+.
Bearish Scenario: If it falls below ₹245.00, risk increases toward ₹240.00 – ₹242.00.
Neutral / Range: Between ₹251.00 – ₹255.00, Wipro may consolidate before a directional move.
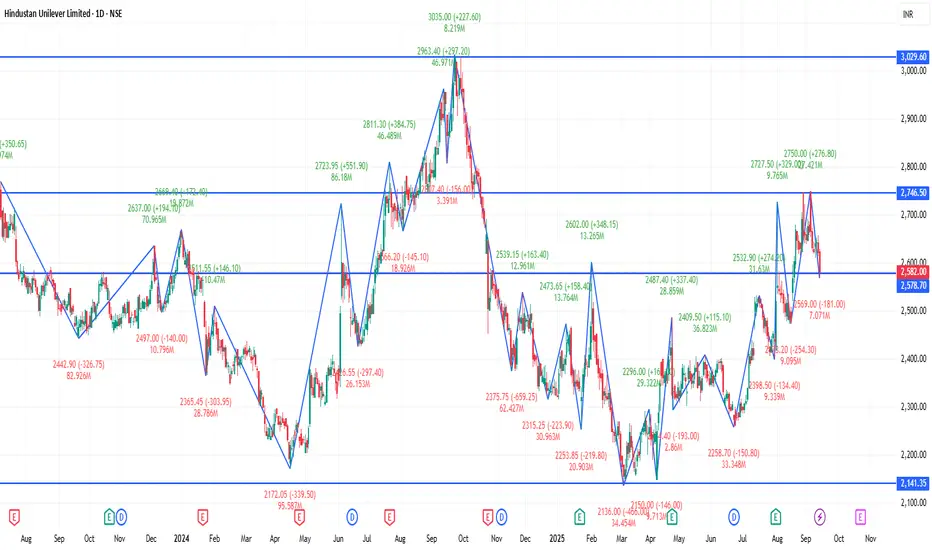
HINDUNILVR 1D Time frame:
🔢 Current Level
Trading around ₹2,578.90 - ₹2,582.00
🔑 Key Resistance & Support Levels
Resistance Zones:
₹2,634.90 – ₹2,636.40 (recent highs; breakout above this may lead to further upside)
₹2,650.00 – ₹2,660.00 (stronger resistance above)
Support Zones:
₹2,569.00 – ₹2,570.00 (immediate support; failure to hold above this may lead to a decline)
₹2,550.00 – ₹2,560.00 (short-term support; a break below this could indicate weakness)
₹2,520.00 – ₹2,530.00 (deeper support zone if price dips further)
📉 Outlook
Bullish Scenario: If HINDUNILVR holds above ₹2,570.00, upward momentum may continue. Break above ₹2,636.40 can open the way toward ₹2,650.00+.
Bearish Scenario: If it falls below ₹2,520.00, risk increases toward ₹2,510.00 – ₹2,530.00.
Neutral / Range: Between ₹2,570.00 – ₹2,636.40, the stock may consolidate before a directional move.
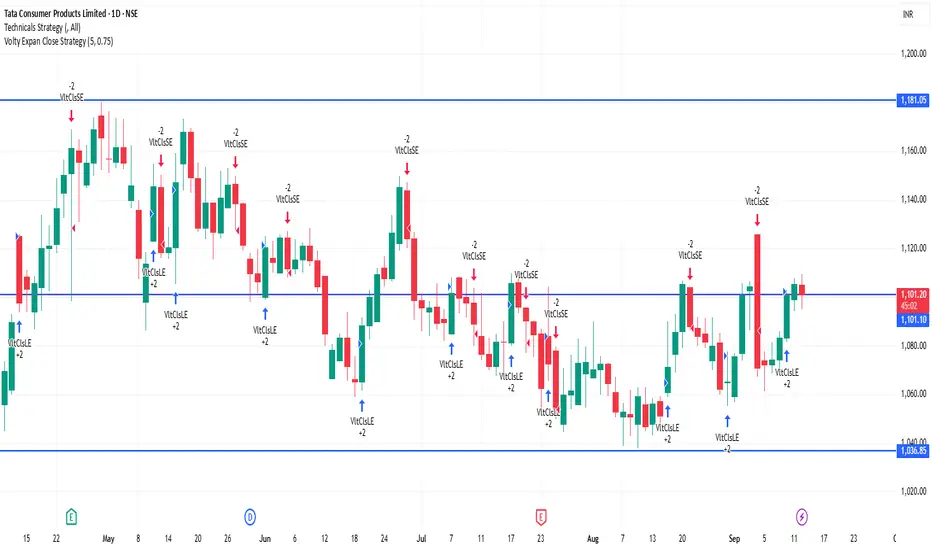
TATACONSUM 1D Time frame🔢 Current Level
Trading around ₹1,101.30
🔑 Key Resistance & Support Levels
Resistance Zones:
₹1,110 – ₹1,115 (recent highs; breakout above this may lead to further upside)
₹1,120 (psychological resistance)
₹1,130 – ₹1,140 (stronger resistance above)
Support Zones:
₹1,095 – ₹1,100 (immediate support; failure to hold above this may lead to a decline)
₹1,085 – ₹1,090 (short-term support; a break below this could indicate weakness)
₹1,070 – ₹1,080 (deeper support zone if price dips further)
📉 Outlook
Bullish Scenario: If Tata Consumer holds above ₹1,100, upward momentum may continue. Break above ₹1,115 can open the way toward ₹1,120+.
Bearish Scenario: If it falls below ₹1,085, risk increases toward ₹1,070 – ₹1,080.
Neutral / Range: Between ₹1,100 – ₹1,115, Tata Consumer may consolidate before a directional move.
RELIANCE 1D Time frame🔢 Current Level
Trading around ₹1,391.50 - ₹1,395.50
🔑 Key Resistance & Support Levels
Resistance Zones:
₹1,396 – ₹1,400 (recent highs; breakout above this may lead to further upside)
₹1,420 – ₹1,430 (stronger resistance above)
Support Zones:
₹1,380 – ₹1,385 (immediate support; failure to hold above this may lead to a decline)
₹1,370 – ₹1,375 (short-term support; a break below this could indicate weakness)
₹1,350 – ₹1,360 (deeper support zone if price dips further)
📉 Outlook
Bullish Scenario: If Reliance Industries holds above ₹1,385, upward momentum may continue. Break above ₹1,400 can open the way toward ₹1,420+.
Bearish Scenario: If it falls below ₹1,370, risk increases toward ₹1,350 – ₹1,360.
Neutral / Range: Between ₹1,385 – ₹1,400, Reliance Industries may consolidate before a directional move.
BANKNIFTY 1D Time frame🔢 Current Level
Trading around ₹54,823
🔑 Key Resistance & Support Levels
Resistance Zones:
₹54,900 – ₹55,100 (near-term resistance; breakout above this may lead to further upside)
₹55,200 – ₹55,500 (stronger resistance above)
Support Zones:
₹54,600 – ₹54,650 (immediate support; failure to hold above this may lead to a decline)
₹54,400 – ₹54,500 (short-term support; a break below this could indicate weakness)
₹53,900 – ₹54,000 (deeper support zone if price dips further)
📉 Outlook
Bullish Scenario: If BANKNIFTY holds above ₹54,650, upward momentum may continue. Break above ₹55,100 can open the way toward ₹55,500+.
Bearish Scenario: If it falls below ₹54,400, risk increases toward ₹53,900 – ₹54,000.
Neutral / Range: Between ₹54,650 – ₹55,100, BANKNIFTY may consolidate before a directional move.

Derivatives in India: Secret Strategies for Massive ReturnsChapter 1: Understanding the Derivative Landscape in India
Before diving into strategies, it’s essential to understand the structure of derivatives in India.
1.1 What Are Derivatives?
A derivative is a financial contract whose value is derived from an underlying asset—such as stocks, indices, commodities, or currencies. In India, the most popular derivatives are:
Futures: Obligatory contracts to buy/sell at a predetermined price and date.
Options: Rights (but not obligations) to buy (call) or sell (put) at a specified price.
1.2 Key Milestones in India’s Derivatives Market
2000: NSE introduced index futures (Nifty 50).
2001: Index options and stock options launched.
2002: Stock futures introduced.
2020s: Surge in retail participation, especially in weekly options like Bank Nifty and Nifty.
1.3 Why Derivatives Matter in India
High Liquidity: Nifty and Bank Nifty options are among the most traded contracts globally.
Leverage: Small capital can control large positions.
Risk Management: Hedging against market volatility.
Speculation: Rapid gains (or losses) from price swings.
Chapter 2: The Psychology of Massive Returns
Before we look at the “secret strategies,” it’s important to highlight the psychological aspect.
2.1 Retail vs. Institutional Mindset
Retail traders often chase short-term profits, influenced by tips and news.
Institutions focus on risk-adjusted returns and hedging.
2.2 The Power of Discipline
The secret to massive returns isn’t chasing every trade but mastering risk control. Successful derivative players:
Limit losses using stop-loss orders.
Diversify positions.
Understand implied volatility and time decay.
2.3 The Illusion of Quick Money
Many traders blow up accounts because derivatives magnify both profits and losses. True success comes when strategies align with market structure.
Chapter 3: Secret Derivative Strategies for Massive Returns
Now let’s uncover the advanced and lesser-known strategies that experienced traders in India deploy.
3.1 The “Covered Call” Strategy
How it works: Buy a stock and sell a call option on the same stock.
Why it works in India: Many Indian stocks (like Infosys, HDFC Bank, Reliance) have stable long-term growth. Covered calls allow investors to earn extra income through premiums.
Secret Edge: Institutions frequently roll over covered calls, effectively compounding returns.
3.2 The “Straddle & Strangle” Trick Before Events
Straddle: Buy both a call and a put at the same strike price.
Strangle: Buy a call and a put at different strike prices.
When to use: Before high-volatility events (Union Budget, RBI monetary policy, earnings).
Secret Edge: In India, implied volatility (IV) tends to spike before events, allowing traders to profit even without large price moves.
3.3 The “Iron Condor” Strategy for Sideways Markets
Setup: Sell an out-of-the-money call and put, and buy further out-of-the-money call and put.
Why it works: Indian indices often consolidate after big moves, making non-directional strategies highly profitable.
Secret Edge: Works exceptionally well during weeks when no major events are scheduled.
3.4 The “Calendar Spread” Advantage
How it works: Sell near-term options and buy long-term options.
Why it works in India: Weekly options expire every Thursday, while monthly options provide longer exposure. Traders exploit the faster time decay in short-term contracts.
3.5 The “Delta Neutral” Hedge Fund Style Strategy
Concept: Create positions where overall delta (price sensitivity) is near zero, focusing on volatility instead of direction.
Example: Combine futures and options to balance exposure.
Secret Edge: Many prop desks in India use delta-neutral positions with high leverage to scalp volatility.
3.6 Bank Nifty Weekly Options: The Retail Goldmine
Why Bank Nifty? It has the highest liquidity and volatility.
Secret Trick: Institutions often sell far out-of-the-money (OTM) options to collect premiums, while retail traders chase cheap options.
How to win: Instead of buying OTM lottery tickets, adopt option-selling strategies with strict risk management.
3.7 “Event-Based Futures Arbitrage”
Concept: Price discrepancies often exist between cash and futures markets during dividend announcements, stock splits, or mergers.
Secret Edge: Advanced traders arbitrage these mispricings for near risk-free profits.
3.8 “Sectoral Rotational Strategies”
How it works: Track which sector index (Nifty IT, Nifty Pharma, Nifty Bank) is gaining momentum.
Secret Edge: Derivatives allow leveraged plays on sectors, amplifying returns during sectoral bull runs.
Chapter 4: Institutional Secrets That Retail Misses
Institutions and proprietary trading desks in India use strategies hidden from retail eyes.
4.1 Options Writing Dominance
Data shows institutions and HNIs are net option sellers, while retail is usually on the buying side. Sellers win most of the time due to time decay (theta).
4.2 Smart Order Flow Analysis
Institutions use algorithms to analyze open interest (OI) buildup. For example:
Rising OI with price rise → Long buildup.
Rising OI with price fall → Short buildup.
Retail often ignores these signs.
4.3 Implied Volatility Arbitrage
Big players monitor volatility skews between Nifty and Bank Nifty, or between weekly and monthly contracts. They profit from mispriced options that retail never notices.
Chapter 5: Risk Management – The True Secret to Longevity
No matter how powerful your strategy, risk management is the real differentiator.
5.1 The 2% Rule
Never risk more than 2% of capital on a single trade.
5.2 Stop-Loss Discipline
Options can go to zero, but a stop-loss saves you from portfolio collapse.
5.3 Position Sizing
Institutions diversify across indices, stocks, and expiries to avoid overexposure. Retail traders should do the same.
Conclusion
Derivatives in India present unparalleled opportunities for those who know how to use them wisely. The secret strategies for massive returns aren’t really about exotic formulas—they’re about understanding volatility, market psychology, institutional behavior, and risk management.
While retail traders often chase lottery-style option buying, the real winners are those who:
Sell options with discipline.
Use spreads and hedges to limit risks.
Exploit volatility and time decay.
Align trades with institutional flows.
If you want to succeed in the derivative markets of India, stop searching for shortcuts. Instead, master these strategies, respect risk, and trade with a professional mindset. The potential for massive returns is real—but only for the disciplined few.

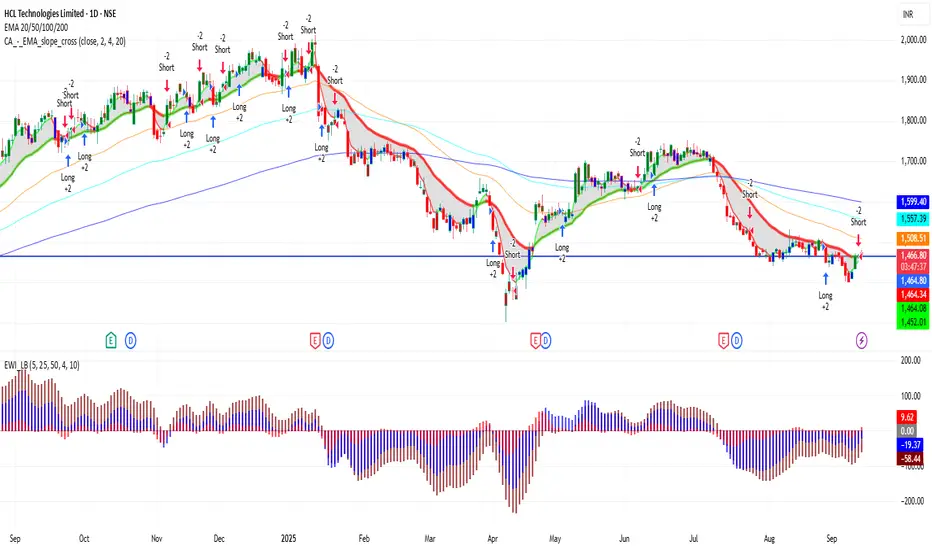
HCLTECH 1D Time frame🔢 Current Level
Trading around ₹1,465 – ₹1,470
🔑 Key Resistance & Support Levels
Resistance Zones:
₹1,476 – ₹1,480 (near-term resistance; breakout above this may lead to further upside)
₹1,494 – ₹1,520 (stronger resistance above)
Support Zones:
₹1,460 – ₹1,463 (immediate support; failure to hold above this may lead to a decline)
₹1,450 – ₹1,460 (short-term support; a break below this could indicate weakness)
₹1,431 – ₹1,440 (deeper support zone if price dips further)
📉 Outlook
Bullish Scenario: If HCL Technologies holds above ₹1,463, upward momentum may continue. Break above ₹1,480 can open the way toward ₹1,494 – ₹1,520.
Bearish Scenario: If it falls below ₹1,450, risk increases toward ₹1,431 – ₹1,440.
Neutral / Range: Between ₹1,463 – ₹1,480, HCL Technologies may consolidate before a directional move.
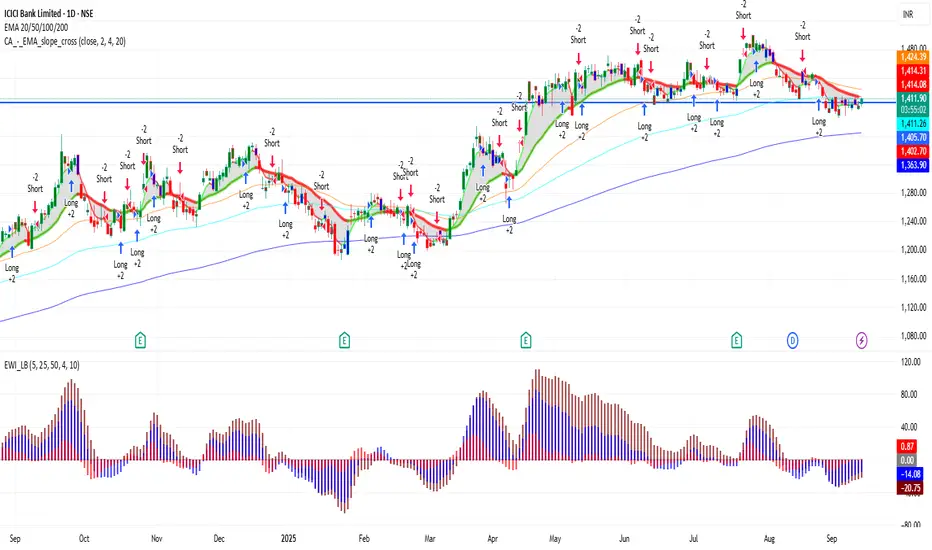
ICICIBANK 1D Time frame🔢 Current Level
ICICIBANK is trading around ₹1,401 – ₹1,412
🔑 Key Resistance & Support Levels
Resistance Zones:
₹1,407 – ₹1,415 (near-term resistance)
₹1,416 (next resistance level)
Support Zones:
₹1,390 – ₹1,392 (immediate support)
₹1,360 – ₹1,365 (stronger support if price dips further)
📉 Outlook
Bullish Scenario: If ICICIBANK holds above ₹1,392, upward momentum may continue. Break above ₹1,410 – ₹1,414 can open the way toward higher levels.
Bearish Scenario: If it falls below ₹1,360, risk increases toward ₹1,340 – ₹1,345.
Neutral / Range: Between ₹1,392 – ₹1,410, ICICIBANK may consolidate before a directional move.
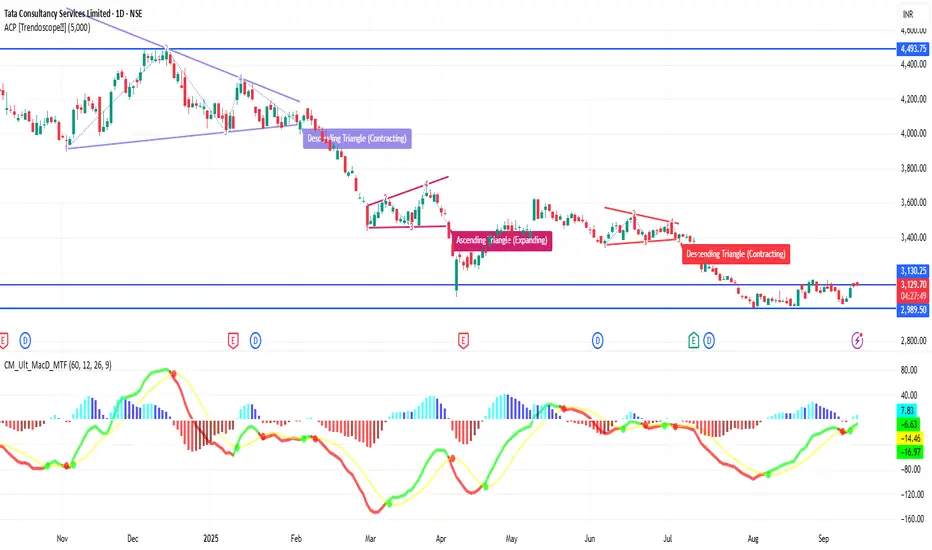
TCS 1D Time frame🔢 Current Level
Trading around ₹3,125 – ₹3,135
🔑 Key Resistance & Support Levels
Resistance Zones:
₹3,138 – ₹3,153 (near-term resistance; breakout above this may lead to further upside)
₹3,167 (stronger resistance above)
Support Zones:
₹3,095 – ₹3,110 (immediate support)
₹3,080 (stronger support if price dips further)
₹3,050 – ₹3,060 (deeper support zone)
📉 Outlook
Bullish Scenario: If TCS holds above ₹3,110, upward momentum may continue. Break above ₹3,153 can open the way toward ₹3,167+.
Bearish Scenario: If it falls below ₹3,080, risk increases toward ₹3,050.
Neutral / Range: Between ₹3,110 – ₹3,153, TCS may consolidate before a directional move.
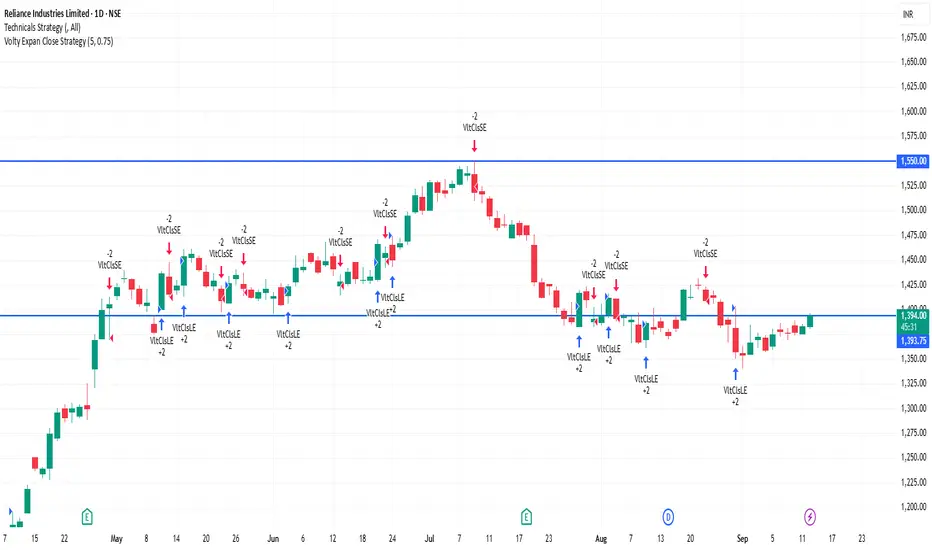
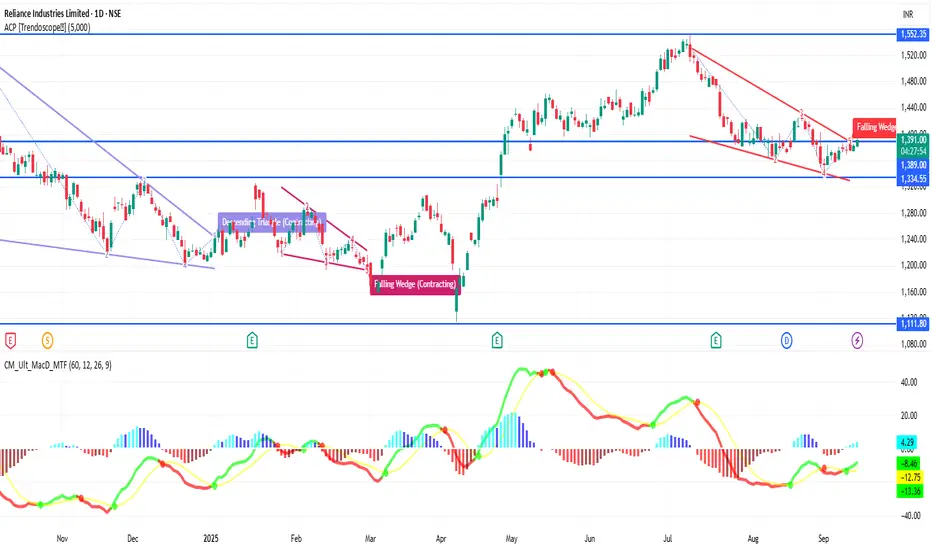
RELIANCE 1D Time frame🔢 Current Level
RELIANCE is trading around ₹1,391 – ₹1,392
🔑 Key Resistance & Support Levels
Resistance Zones:
₹1,392 – ₹1,396 (near-term resistance; breakout above this may lead to further upside)
₹1,400 (psychological resistance)
₹1,427 (stronger resistance above)
Support Zones:
₹1,380 – ₹1,385 (immediate support)
₹1,370 (short-term support; break below may indicate weakness)
₹1,350 (deeper support zone if selling pressure continues)
📉 Outlook
Bullish Scenario: If RELIANCE holds above ₹1,385, upward momentum may continue. Break above ₹1,396 can open the way toward ₹1,400+.
Bearish Scenario: If it falls below ₹1,370, risk increases toward ₹1,350.
Neutral / Range: Between ₹1,385 – ₹1,396, RELIANCE may consolidate before a directional move.
BANKNIFTY 1D Time frame📊 Current Snapshot
Current level: around 54,680 - 54,690
Today’s range: approx. 54,580 – 54,850
🔑 Key Daily Levels
Resistance Zones
54,960 (near-term resistance)
55,172 (major resistance; breakout above this could extend rally)
55,000 (psychological resistance)
Support Zones
54,462 (immediate support)
54,400 – 54,500 (important support band)
54,107 (deeper support if selling pressure continues)
📉 Outlook
Bullish Case: If Bank Nifty sustains above 54,960 – 55,172, it can move higher towards 55,300 – 55,500.
Bearish Case: If it breaks below 54,400, the index may slip toward 54,100 or even lower.
Neutral / Range: Between 54,400 – 54,960, sideways movement is likely until a breakout occurs.

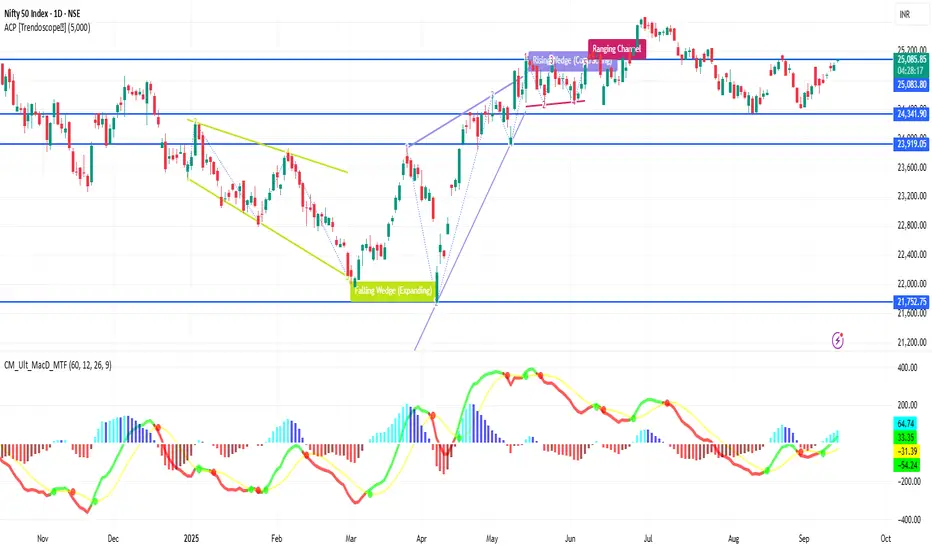
NIFTY 1D Time frame📊 Current Data
Current trading level: around 25,076 – 25,091
Today’s range: approx. 25,038 – 25,095
52-week range: 21,743 – 26,277
🔑 Key Daily Levels
Resistance Zones
25,090 (near-term resistance just above current trading)
25,153 (recent swing high, major resistance level)
Support Zones
24,994 – 24,950 (immediate support range)
24,800 (strong support zone; crucial for trend continuation)
📉 Trend View
Bullish Case: If NIFTY sustains above 25,090 and breaks 25,153, it could push higher towards 25,200+.
Bearish Case: If it fails to hold 24,950–24,994 and slips below 24,800, downside momentum could strengthen.
Neutral Zone: Between 25,000 – 25,050, NIFTY may consolidate before deciding direction.
HDFCBANK 1D Time frame🔢 Current Level
Trading around ₹964.55 - ₹967.80
🔑 Key Resistance & Support Levels
Resistance Zones:
₹970 – ₹975 (near-term resistance; breakout above this may lead to further upside)
₹980 (psychological resistance)
₹1,000 (stronger resistance above)
Support Zones:
₹960 – ₹965 (immediate support)
₹950 (stronger support if price dips further)
₹940 – ₹945 (deeper support zone)
📉 Outlook
Bullish Scenario: If HDFCBANK holds above ₹965, upward momentum may continue. Break above ₹975 can open the way toward ₹980+.
Bearish Scenario: If it falls below ₹950, risk increases toward ₹940 – ₹945.
Neutral / Range: Between ₹965 – ₹975, HDFCBANK may consolidate before a directional move.

ITC 1D Time frame📍 Current Price Action
Current price around ₹415
Day’s range: ~ ₹412 – ₹417
52-week range: ~ ₹390 – ₹528
⚙ Technical Indicators
RSI (14): ~65 → bullish momentum, nearing higher strength
MACD: Positive → supports upside bias
ADX (14): High (≈ 60-65) → strong trend strength
Stochastic / Williams %R: Showing overbought signals → risk of short-term pullback or consolidation
📊 Moving Averages & Trend Structure
Short/medium/long-term moving averages (10, 20, 50, 100, 200 day) largely give buy signals
The 5-day MA is slightly below current price → short-term pullback potential
🔧 Support & Resistance Levels
Immediate Support: ~ ₹410
Next Support Zone: ~ ₹405 – ₹400
Immediate Resistance / Pivot Territory: ~ ₹416 – ₹417
Higher Resistance: ~ ₹420 – ₹422 (if the current resistance is cleared)
🧠 Summary
ITC is in a bullish trend on the daily chart with strong momentum and multiple indicators supporting upward move. But since some overbought signals are showing up, there’s a chance for a pullback or consolidation near resistance. Key to watch: holding above ₹410 keeps the bullish bias. Breaking above ~₹416-417 convincingly could open up room toward ~₹420+. If price falls below support near ₹405-410, downside risk increases.

MARUTI 1D Time frame📍 Current Price Action
Last traded price: ~₹ 15,096
Minimal intraday change (~0.1%, slightly up)
⚙ Technical Indicators
RSI (14): ~72 → strong uptrend / overbought conditions
Stochastic RSI: Low / showing weakness → possible cooling off
CCI (14): ~92 → uptrend strength
MFI (Money Flow Index): ~84 → strong buying pressure
📊 Moving Averages & Trend Strength
Price is above 50-day and 200-day SMAs & EMAs → long-term trend is bullish
20-day SMA/EMA are more neutral-to-slightly bullish
All major moving averages are broadly supporting upwards bias
🔧 Support & Resistance / Pivot Zones
Support Levels: ~₹ 14,900 – ₹ 15,000
Resistance Levels / Pivot: ~₹ 15,300 – ₹ 15,500
🧠 Summary
Maruti is in a strong uptrend on the daily chart. Overbought indicators like RSI and MFI suggest buying strength is high, which also means risk of a short-term pullback or consolidation. Key support ~₹ 15,000 needs to hold for bulls. If price clears resistance near ₹ 15,300-15,500 convincingly, upward move likely to continue.
