TATAMOTORS - Symmetrical Triangle Breakout Watch________________________________________
🚀 Tata Motors Ltd (NSE: TATAMOTORS) | Symmetrical Triangle Breakout Watch
________________________________________
🏢 Company Overview
Tata Motors Ltd is one of India’s leading automobile manufacturers, producing cars, SUVs, electric vehicles, and commercial vehicles. After an extended consolidation phase, the stock is trading inside a symmetrical triangle formation, indicating a possible strong directional move ahead.
________________________________________
📊 Current Market Snapshot
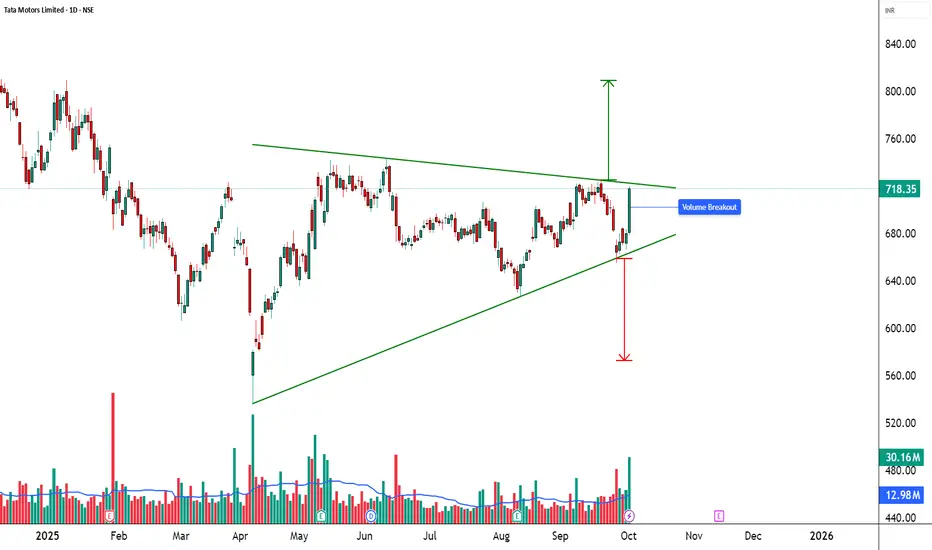
CMP: ₹718.35
Sector: Automobiles & Commercial Vehicles
Pattern Observed: 🔺 Symmetrical Triangle
Candlestick Signal: Bullish Marubozu + Strong Momentum Candle
Strength Rating: ⭐⭐⭐⭐ (Bullish Breakout Watch)
________________________________________
📈 Price Action & Chart Pattern
The stock has been consolidating within a symmetrical triangle, where buyers are defending higher lows while sellers cap gains at the resistance zone. The latest session witnessed a powerful bullish candle with extremely high volume, suggesting institutional participation.
Support Trendline: ₹665 – ₹670
Resistance Trendline: ₹720 – ₹725
Breakout Zone: Above ₹725 with strong volume
Breakdown Zone: Below ₹665 may invite fresh selling pressure
🔍 Why Important? Symmetrical triangles act as springboards for big moves once a breakout/breakdown occurs with confirmation.
________________________________________
🔎 Technical Indicators
RSI (14): 59.75 → Turning bullish with upside room.
EMA Support: Price reclaimed EMA levels, signaling renewed strength.
Volume: Recent upmove supported by 3x average volumes, a strong confirmation factor.
________________________________________
📍 Key Levels to Watch
Immediate Support: ₹665 – ₹670
Immediate Resistance: ₹720 – ₹725
Upside possible (if breakout): ₹770 – ₹800
Downside possible (if breakdown): ₹620 – ₹600
________________________________________
🔮 Bullish & Bearish Scenarios
✅ Bullish Case: A strong close above ₹725 with volume can trigger a rally towards ₹770–₹800.
⚠️ Bearish Case: Rejection at resistance and breakdown below ₹665 may drag the stock back to ₹620.
________________________________________
📝 STWP Trade Analysis
Entry: ₹718.35
Stop-loss: ₹665.75 (just below triangle support)
Risk: 52.60 points
Strength: ⚡ Strong Bullish Momentum + Extremely High Volume
Demand Zone: ₹666.65 – ₹683 | SL: 665.75
📌 Note: Strong momentum setup with excellent volume confirmation. Traders must stay disciplined with SL.
________________________________________
🎯 Final Outlook
Tata Motors is at a decisive breakout point. If the stock sustains above ₹725 with strong volumes, it could fuel a sharp rally towards ₹800. Failure to hold this zone may lead to renewed consolidation or a pullback towards ₹665. Patience and strict discipline are essential here.
________________________________________
💡 Learning Note: Symmetrical triangles with heavy-volume breakouts often lead to trend continuation setups. Combining price action, candlestick strength, and volume surge improves the accuracy of trade setups.
________________________________________
⚠️ Disclosure & Disclaimer – Please Read Carefully
The information shared here is meant purely for learning and awareness. It is not a buy or sell recommendation and should not be taken as investment advice. I am not a SEBI-registered investment adviser, and all views expressed are based on personal study, chart patterns, and publicly available market data.
Trading—whether in stocks or options—carries risk. Markets can move unexpectedly, and losses can sometimes exceed the money you have invested. Past performance or past setups do not guarantee future results.
If you are a beginner, treat this as a guide to understand how the market works and practice on paper trades before risking real money. If you are experienced, always assess your own risk, position sizing, and strategy suitability before entering trades.
Consult a SEBI-registered financial adviser before making any real trading decision. By engaging with this content, you acknowledge full responsibility for your trades and investments.
💬 Found this useful?
🔼 Give this post a Boost to help more traders discover clean, structured learning.
✍️ Drop your thoughts, questions, or setups in the comments — let’s grow together!
🔁 Share with fellow traders and beginners to spread awareness.
👉 “If you liked this breakdown, follow for more clean, structured setups with discipline at the core.”
🚀 Stay Calm. Stay Clean. Trade With Patience.
Trade Smart | Learn Zones | Be Self-Reliant 📊
________________________________________
Tatamotorsanalysis
TATA MOTORS – Technical & Educational Snapshot📊 TATA MOTORS – Technical & Educational Snapshot
Ticker: NSE: TATAMOTORS | Sector: 🚗 Automobiles
CMP: ₹ ▲ (as of 20 Aug 2025)
Rating (for learning purpose): ⭐⭐⭐⭐
Pattern Observed: 📈 Channel Breakout
Tata Motors is showing strong bullish signals across multiple technical indicators. The RSI has broken out to 62, reflecting healthy buying momentum without being overbought, while the MACD remains bullish, confirming upward momentum. The SuperTrend and VWAP are both bullish, supporting the upward trend, and the CCI at 98 along with a Stochastic of 96 indicate strong near-term strength. Additionally, the Bollinger Band squeeze has released, suggesting increased volatility and a likely breakout. Altogether, these signals point toward a potential continuation of the bullish move in the near term.
Key Levels:
Resistance: 711 | 722 | 742
Support: 681 | 662 | 651
Pullback Area: 671–685
Invalidation level: 654
STWP Trade Analysis:
Entry (Long): Above 703.35
Stop Loss: 656 or below
Reference Levels: 750 | 796
⚠️ Disclaimer – Please Read Carefully
The information shared here is meant purely for learning and awareness. It is not a buy or sell recommendation and should not be taken as investment advice. I am not a SEBI-registered investment advisor, and all views expressed are based on personal study, chart patterns, and publicly available market data.
Trading — whether in stocks or options — carries risk. Markets can move unexpectedly, and losses can sometimes be larger than the money you have invested. Past performance or past setups do not guarantee future results.
If you are a beginner, treat this as a guide to understand how the market works — practice on paper trades before risking real money. If you are an experienced trader, remember to assess your own risk, position sizing, and strategy suitability before entering any trade.
Consult a SEBI-registered financial advisor before making any real trading decision.
By reading, watching, or engaging with this content, you acknowledge that you take full responsibility for your own trades and investments.
💬 Found this useful?
🔼 Give this post a Boost to help more traders discover clean, structured learning.
✍️ Drop your thoughts, questions, or setups in the comments — let’s grow together!
🔁 Share with fellow traders and beginners to spread awareness.
✅ Follow simpletradewithpatience for beginner-friendly setups, price action insights & disciplined trading content.
🚀 Stay Calm. Stay Clean. Trade With Patience.
Trade Smart | Learn Zones | Be Self-Reliant 📊

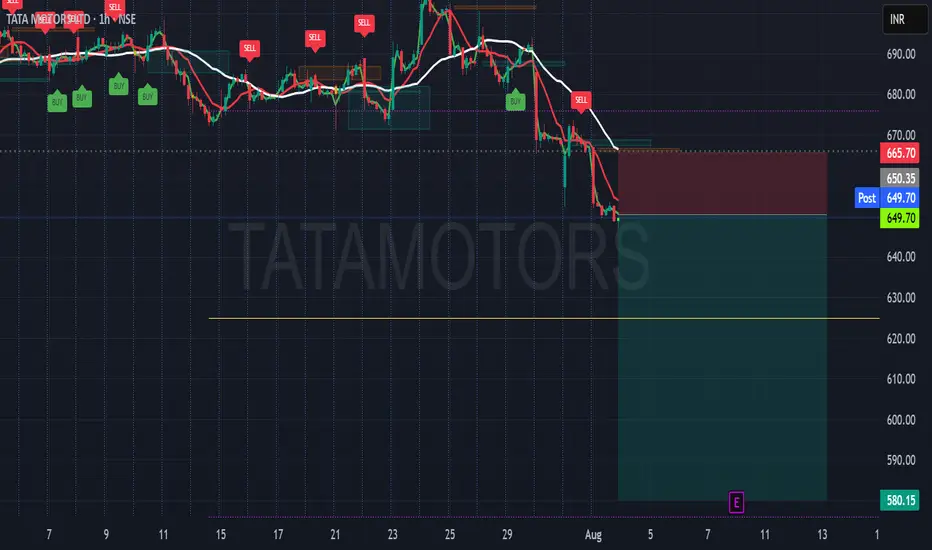
TATAMOTORS Breakdown Watch-Structure Rejection & MomentumThis 1H chart on Tata Motors highlights a structure-aware short setup, guided by the Leola Lens SignalPro overlay.
🔍 Technical Breakdown:
🔴 A fresh SELL signal appeared after price lost the adaptive trendline and failed to reclaim the resistance block.
⚪ Price retested the liquidity rejection zone near ₹650–₹652 before continuing lower.
🟣 The white base trendline is now acting as overhead pressure.
🟥 The Liquidity Control Box serves as invalidation above ₹665.70.
🟢 Potential target zones extend toward the ₹620–₹580 region, aligning with prior demand clusters.
🧠 Context Note:
The setup follows a clear structure rejection after a failed bullish attempt. Momentum confirms the shift, but risk management remains essential due to volatility and earnings
📌 For educational purposes only.
Always manage risk and confirm with your own strategy.
#TataMotors #ShortSetup #StructureTrading #IndianStocks #NSE #PriceAction #TechnicalAnalysis
TATA Motors : Buy if 1st monthly closing happen above 678 levelLevels are mentioned in the chart . TATA MOTORS might fall below 495 once.
It will be a buying level though .
Note : I am not a SEBI registered adviser . Please consider my analysis only for education purpose .

TATA MOTORS If weekly closing couldn't sustain above that red line then possibly it could 📉📉
828 level marked is pending, chances are it could test within 21st Oct 2024
Disclaimer:
It's a personal view not a financial advice and I assume no responsibility and liability whatever outcome arises.

TATA MOTORS Tata Motors is approaching the support area at 1050. We should consider a long trade near the 1050 price level.

Tata motors- BullishEntered in already tested supply zone
Possibly it wont hold
Expecting 1175 in coming days
1170 strong support now
Looks Good

Tata Motors Ltd - Positional TradeDate : 11-Aug-2024
LTP : Rs. 1068.10 (on 9-Aug-2024)
Next Resistances: (1) Rs. 1,179 --> (2) Rs. 1,284
SL : Rs. 950 on daily close basis
Technical View:
• NSE:TATAMOTORS is in it's primary uptrend and currently going through it's secondary uptrend.
• After breaking out from it's previous secondary uptrend on 25-Jul-2024, NSE:TATAMOTORS had touched the high of 1,179 on 30-Jul-2024.
• From it's previous high of 1,179 NSE:TATAMOTORS has retraced 14% to 1,008.40 level. NSE:TATAMOTORS has re-tested the previous secondary downtrend line and started the upward movement after taking a support at 50 DMA.
• On 9-Aug-2024, NSE:TATAMOTORS has closed above 20 DMA.
• RSI has re-entered buy zone on 9-Aug-2024 and trading at 54.16.
• MACD is trading at 14.21.
• Looking good from here onwards.
If you like the analysis, Boost/Like the idea and follow my ID.
Disclaimer : I am not a SEBI registered analyst/consultant and not recommending anyone to take any BUY or SELL position in stock market. Investing in stock market is risky and one should do a self analysis and validation before investing in stock market. My ideas are published for learning purpose only and are available to everyone at no cost/charge.

TATA MOTORS LOOKING GOOD FOR MORE UPSIDETatamotors have given the breakout of previous high @ 1066 levels and closed above that. Further rally can be expected in the stock if it sustains above 1095 towards 1150 and upper marked levels until 967 is intact on the downside.
To motivate us, Please like the idea If you agree with the analysis.
Happy Trading!
InvestPro India

Tata Motors : Swing Trade#tatamotors #vcpsetup #breakoutcandidate #swingtrade
Tata Motors : Swing Trade
>> Multiple VCP setup
>> Breakout Soon
>> Trending setup
>> Good Risk Reward Trade
Swing Traders can lock 10% profit & keep trailing
Please give a Boost or comment if u r Liking the analysis & Learning from it. Keep showing ur Love by following
Disclaimer : This is not a Trade Recommendations & Charts/ stocks Mentioned are for Learning/Educational Purpose. Do your Own Analysis before Taking positions.

Tata Motors Ltd - Breakout OpportunityDate : 10-May-2024
Rating : Buy - Positional Trade
LTP : Rs. 1,046.65
Targets: (1) Rs. 1,065 --> (2) Rs. 1,155
SL : Rs. 977 on daily close basis
Technical View:
• NSE:TATAMOTORS is in its primary uptrend and was recently going through it's secondary downtrend.
• After touching the high of 1,065.60 on 5-Mar-2024, it has retraced 14% to 921.20 level.
• On 10-May-2024, NSE:TATAMOTORS has broke out from its secondary down trend with higher than average volume.
• NSE:TATAMOTORS has also closed above 20 DMA and 21 DEMA on 8-May-2024.
• RSI is trading at 63.72 and MACD is trading at 11.28.
• Looking good to continue upward journey.
Disclaimer : I am not a SEBI registered analyst/consultant and not recommending anyone to take any BUY or SELL position in stock market. Investing in stock market is risky and one should do a self analysis and validation before investing in stock market. Ideas are published for learning purpose only.

Tata Motors Ltd - Breakout OpportunityDate : 6-May-2024
Rating : Buy - Positional Trade
LTP : Rs. 1,016.20
Targets: (1) Rs. 1,065 --> (2) Rs. 1,155
SL : Rs. 995.00 on daily close basis
Technical View:
• NSE:TATAMOTORS is in its primary uptrend and was recently going through it's secondary downtrend.
• After touching the high of 1,065.60 on 5-Mar-2024, it has retraced 14% to 921.20 level.
• On 2-May-2024, NSE:TATAMOTORS has broke out from its secondary down trend with higher than average volume.
• Since 25-Apr-2024, NSE:TATAMOTORS is trading above 20 DMA and 21 DEMA.
• RSI and MACD has already given cross over and trading at 58.43 and 8.93 respectively, indicating bullish momentum in coming days.
Disclaimer : I am not a SEBI registered analyst/consultant and not recommending anyone to take any BUY or SELL position in stock market. Investing in stock market is risky and one should do a self analysis and validation before investing in stock market. Publishing the ideas for learning purpose only.

Bullish Breakout in Tata MotorsA bullish flag & pole Chart Pattern Breakout on the Weekly Time frame of NSE:TATAMOTORS
Price Action supported by very good volume.
The stock is currently in uptrend making higher highs and higher lows.
One can add this stock into their stocks to buy list and initiate the long trade as per the levels mentioned on the chart
Stop loss will be on a Weekly closing basis.
Trend Analysis :- UP Trend
Chart Pattern :- Bullish flag & pole Chart Pattern
Technical Indicator :- Positive MACD Crossover
Disclaimer: This is for educational purpose only.

Bullish Bat In TatamotorsBullish Bat In Tatamotors
Buy PRZ - 610.7/613.65
SL - 606.9
Target - 621/627
Sell Tatamotors If Breaks 606.9
SL - 625.1
Target - 580/570

Tata Motor Looking So WeakTATA MOTOR : Cmp 427.75
Super Bearish On Weekly Charts.
Selling Zone - 438-448
SL - 461.5 ( Weekly Closing Basis )
Target - 360/280

Tata Motors Short Term TargetsThe FASP for Tata Motors is listed for 04-1-2023. You can add this levels to your trade setup for better results. This should not be the only indicator but an additional tool to increase your winning possibilities.
What is Fibolysis Anchor SupRes Points(FASP)?
It is a unique level arrived by using Fibonacci Retracement , Fibonacci Extension , Standard Pivot levels under various Timeframes. It is an extensively analyzed level to draw the support and resistance levels for the next day. You can use these levels along with your trade setup to increase your winning odds.
Validity of the levels: Up to 6 Months
How to use these levels?
The three levels on both sides are usually easily achievable. The Targets above are bit difficult to achieve in a single trading session. I use this fact to write intraday positions and to buy options.
Color Coding: Green is regular support and buying area, Red is strong exit area
Disclaimer: This is shared in the interest of educational purpose and for knowledge enhancement. Kindly refer it in the same light. I am not responsible for any profits or loss incurred based on this information.

TATA MOTORS NEAR DEMAND ZONEThere is a strong demand zone for Tata Motors @ 375 - 367 and looking good for upside towards 430, 450 and upper levels.
To motivate us, Please like the idea If you agree with the analysis.
Happy Trading!
InvestPro India Team


Tata motors near a break out level.Tata motors on the daily time frame has closed near a resistance zone and can give a good movement above the resistance zone.
20 and 200 ema are close enough and there can be a bullish moving averages cross over.
A intraday and swing trades can be initiated in the bullish side once the stock starts closing above the 440 level.
Target :- 453, 471
Stop loss :- Close below 20 ema on daily chart.
The stock is also good for a long term gains and can give good profits.
Markets have created new ATH and the stock can also follow the trend.
Wait for the stock to start trading above 440 levels and 3% gain can be captured in a positional trade.

TATAMOTORS LEVELS FOR MONDAY - 24-10-2022Important TATAMOTORS Levels ( Support & Resistance ) for Monday Market- 24-10-2022.
Disclaimer:
I am not SEBI Registered Analyst, This Channel Videos are 100% Education Purpose Only, Myself or my Channel Not Responsible for Your Profit/Loss, Please consult Your Financial Advisor before trading/investing on share market.

TATAMOTOR Looks Bullish for Swing TradeTata Motors looking bullish for Short term, took Trendline support. Looking to Go long around CMP @ 435with Yesterday's Low as the Stoploss and Targets Expected are 446

Tata Motors: Wolfe Wave and Butterfly gets activated TATA MOTORS
1. Coming out of its slumber
2. Two prominent patterns getting active around 440-450.
3. Buy on dips candidate with an SL of 409 (Closing basis)
4. TGTs - Bearish Butterfly: 490-500
5. Wolfe Wave TGTs: Above 500 until price reaches the TGT line.

TATAMOTORS : WILL IT MAKE OR BREAKHello !!
Welcome to the quick update of TATAMOTORS. After a huge rally until 536, it took a correction. The correction is very much important for any stock to make a new high in the long term. With the onset of various wars and market factors, it dumped badly. As of now, it is trading at around Rs 395.
I think the stock should take a bounce from here as shown in the chart. It should not go below the trend line. As of now, it is trying to break the trend line. If the stock closed under Rs 392, there will be more downside until Rs 334. We can enter this stock once the picture is clear and the stock moves above Rs 399.
The expected entry one can take should be between Rs 399 to Rs 405 only if it enters the channel again. The expected targets are as below:
Rs 417
Rs 463
Rs 528
Please wait for the right moment to enter this trade and do not panic or FOMO. The market will surely be green in a few days as nothing goes down forever.
This is not financial advice, please do your own research before investing and we are not responsible for any of your losses or profits.
Please like and share and comment on this idea if you liked it.
