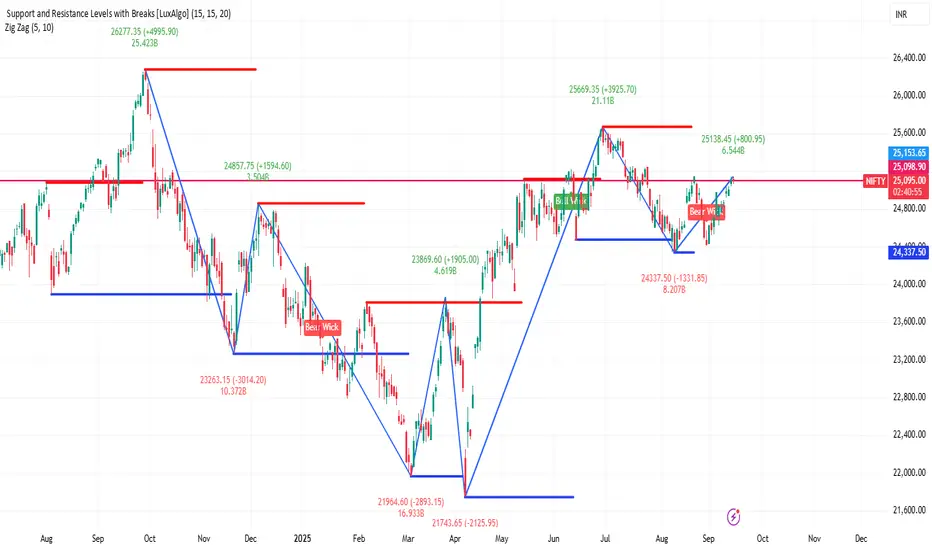
NIFTY 1D Time frameCurrent Price: ~25,085
Day’s Low: 24,900
Day’s High: 25,138
🔹 Support & Resistance (based on today’s range)
Support 1 (S1): 24,950 – 24,925
Support 2 (S2): 24,900 – 24,875
Resistance 1 (R1): 25,120 – 25,138
Resistance 2 (R2): 25,150 – 25,180
Tatasteel
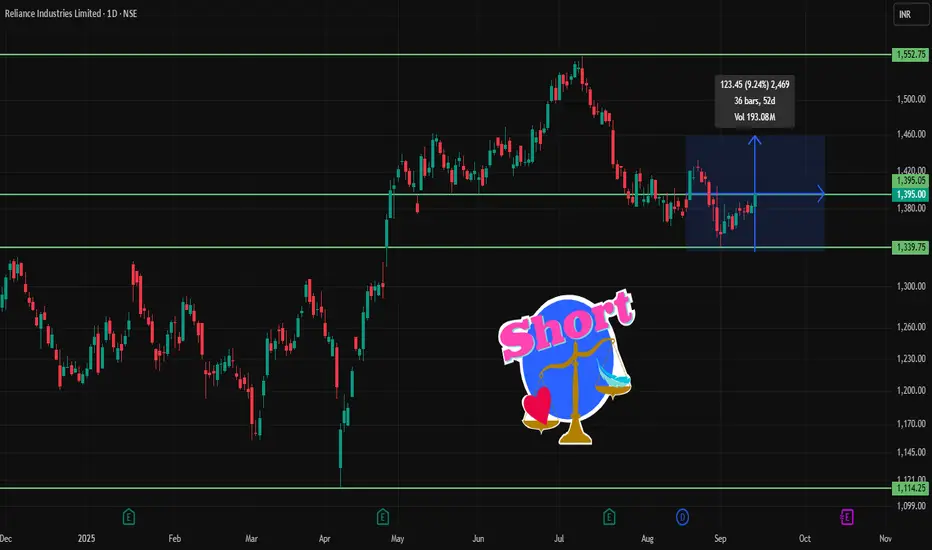
RELIANCE 1D Time frameCurrent Price & Trend
Trading around ₹1,395
Price is below many of its short- to medium-term moving averages (50-day, 100-day), suggesting resistance in that zone.
Indicators & Momentum
Relative Strength Index (RSI) is in mid-range → neither overbought nor oversold, leaning neutral.
MACD is weak to mildly bearish in daily view.
Volume has shown mixed behaviour; resistance zones are not being convincingly broken.
Trend strength indicators show some weakening or caution among buyers.
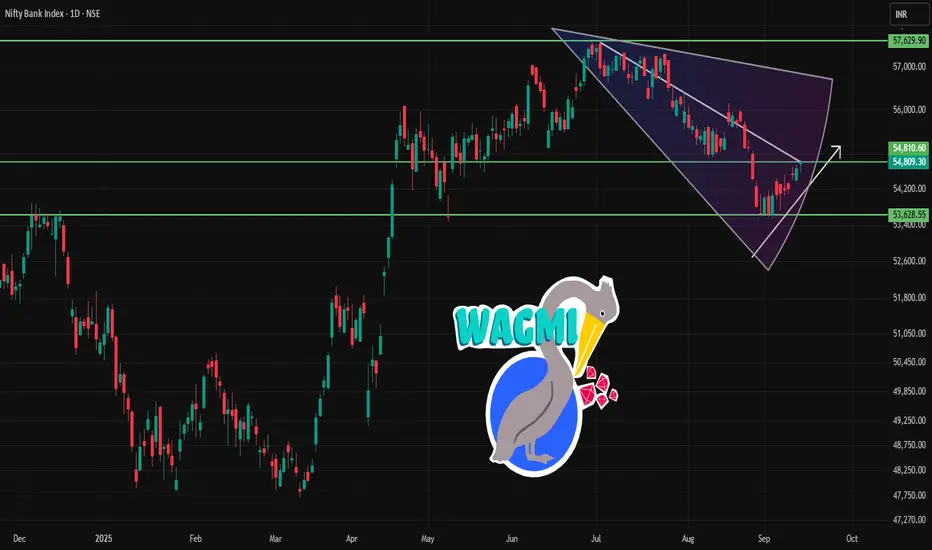
BANKNIFTY 1D Time frameCurrent Price & Trend
Current Level: 54,809
Trend: Neutral to mildly bullish
Range Context: Close to resistance zone, so movement here is crucial
Bullish Case
If Bank Nifty closes above 55,000–55,200, it can rally toward 55,500–55,700.
Sustained buying could push further toward 57,000 in coming sessions.
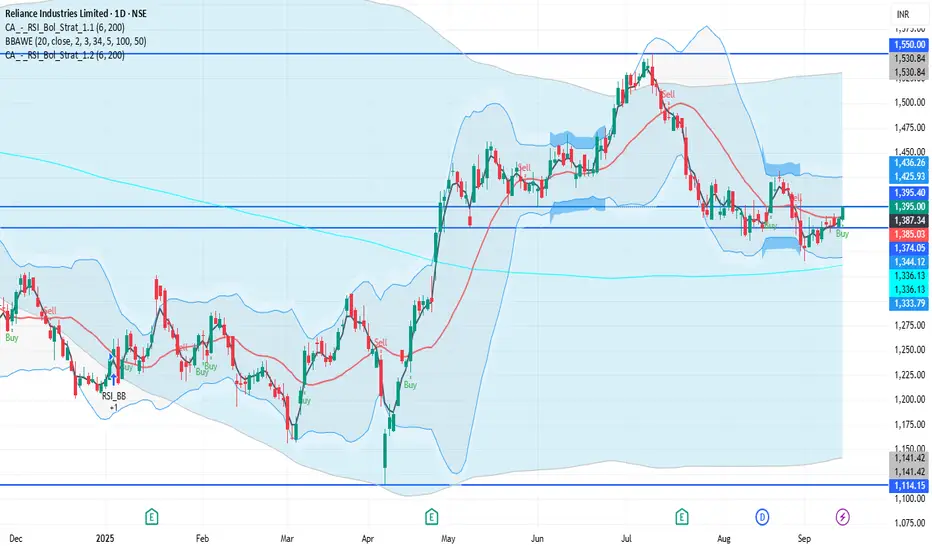
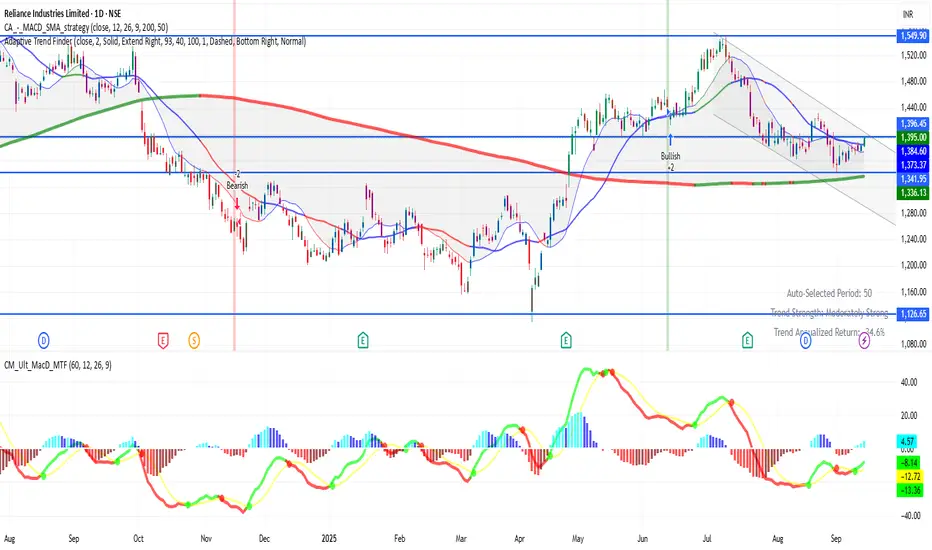
RELIANCE 1D Time frameCurrent Price & Trend
Price: ₹1,395.00
Trend: Neutral to mildly bullish; trading approximately 10.1% below its 52-week high of ₹1,551.00, achieved on July 9, 2025.
Momentum: Indicators suggest a neutral to slightly bullish outlook.
Bullish Scenario
Breakout Above ₹1,396: A sustained move above ₹1,396 could target ₹1,400 – ₹1,420 in the short term.
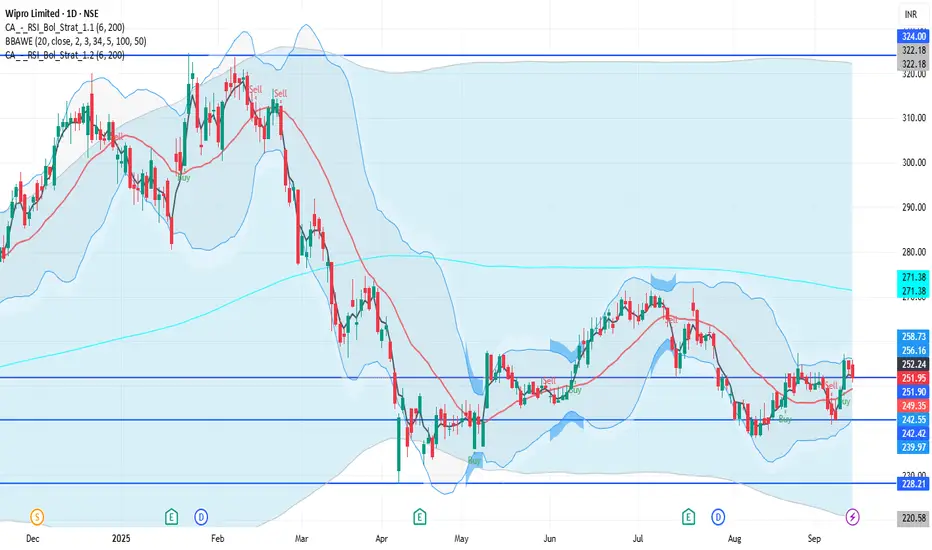
WIPRO 1D Time frameCurrent Price & Trend
Price: ₹251.95
Trend: Neutral; trading approximately 22.5% below its 52-week high of ₹324.60, reached on July 2, 2025.
Momentum: Indicators suggest a neutral to slightly bearish outlook.
Bullish Scenario
Breakout Above ₹257: A sustained move above ₹257 could target ₹265 – ₹270 in the short term.
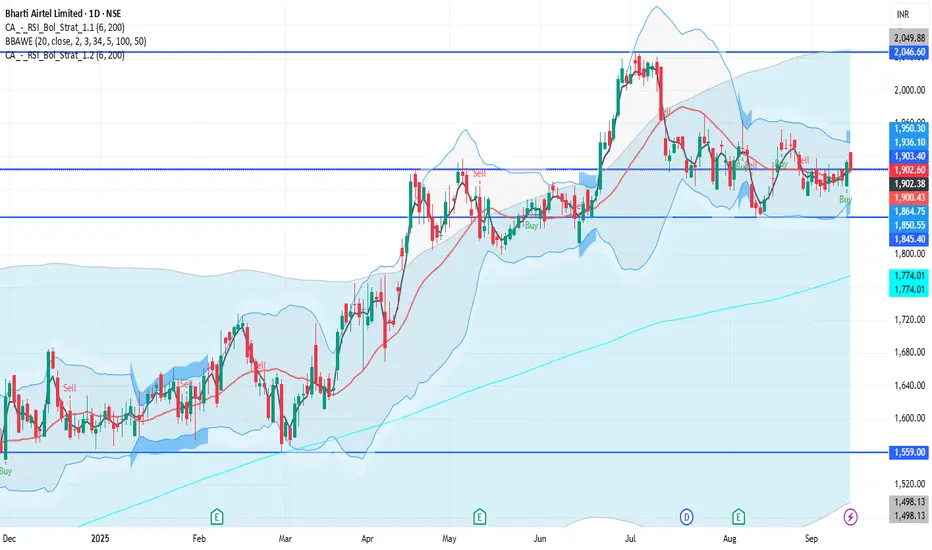
BHARTIARTL 1D Time frameCurrent Price & Trend
Price: ₹1,902.60
Trend: Neutral to mildly bullish; trading approximately 6.9% below its 52-week high of ₹2,045.50, achieved on July 2, 2025.
Momentum: Indicators suggest a neutral to slightly bullish outlook.
Bullish Scenario
Breakout Above ₹1,930: A sustained move above ₹1,930 could target ₹1,950 – ₹1,960 in the short term.
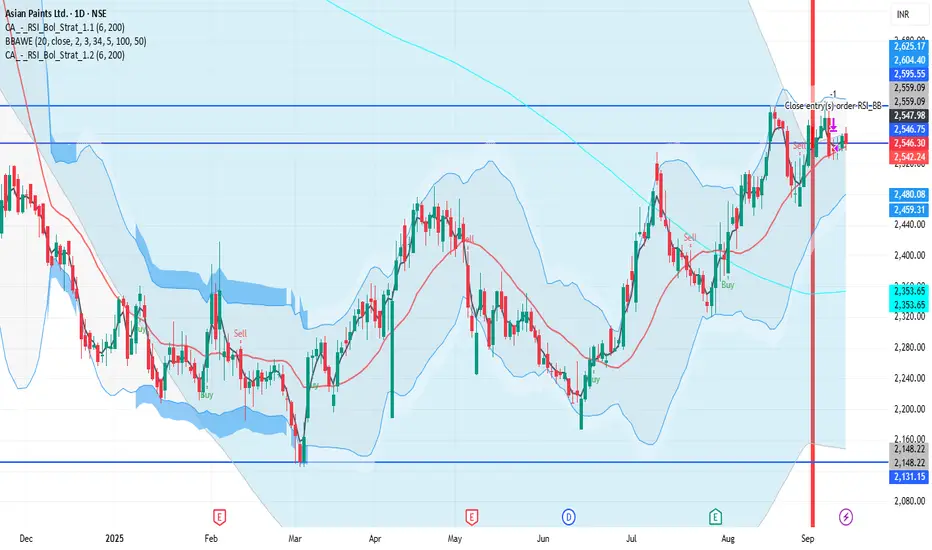
ASIANPAINT 1D Time frameCurrent Price & Trend
Price: ₹2,546.30
Trend: Consolidating near recent highs; trading approximately 25% below its 52-week high of ₹3,394.90.
Momentum: Indicators suggest a neutral to slightly bearish outlook.
Bullish Scenario
Breakout Above ₹2,580: A sustained move above ₹2,580 could target ₹2,600 – ₹2,620 in the short term.
⚠ Bearish Scenario
RELIANCE 1D Time frameCurrent Status
Price is around ₹715
The stock has been showing strength recently, with many of its moving averages (short- to long-term) supporting the rise.
Technical indicators like RSI, MACD, ADX etc. lean positive — buyers seem to have the upper hand.
There’s an inverted Head & Shoulders pattern forming, which is a bullish reversal signal if confirmed. Support zones are holding up so far.
Bullish Scenario
If Tata Motors stays above ₹700–705 support and breaks past ~₹720–725 with volume:
Possible upside to ~₹730-₹740
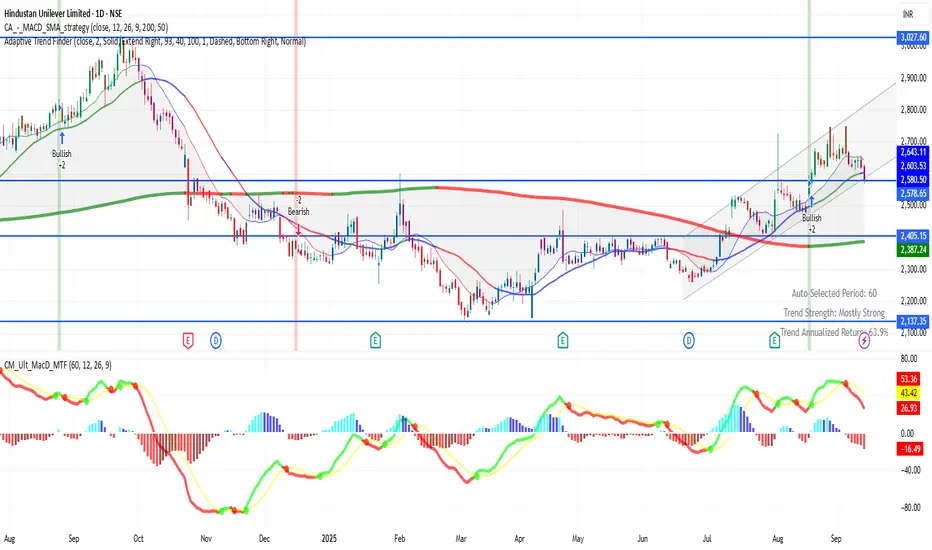
HINDUNILVR 1D Time frame General Status
Current Price: ~ ₹2,580
52-Week Range: Roughly from ₹2,136 (low) up to ~ ₹3,022 (high)
The stock has come down from its highs and is trading well below those peaks.
Bullish Scenario
If things turn favorable:
Holding above ₹2,550-₹2,500 is crucial. If that support holds, a bounce is possible toward ₹2,650-₹2,700.
If the stock breaks above that resistance cleanly, then targets in the ₹2,850-₹3,000 range could come into play.
SBIN 1D Time frameCurrent Price Action (Daily Chart)
Price Range: Stock is moving between ₹815 – ₹830 right now.
Trend: Consolidation with mild bullish bias.
Key Levels
Immediate Resistance: ₹830
Next Resistance: ₹840 – ₹850
Major Resistance: Around ₹875 (previous high)
Immediate Support: ₹815 – ₹820
Strong Support: ₹800 – ₹805
Critical Support: ₹785

HDFCBANK 1D Time frame📉 Current Market Snapshot
Closing Price: ₹967.80
Day's Range: ₹962.25 – ₹970.75
52-Week High: ₹1,018.85
52-Week Low: ₹806.50
Market Cap: ₹14,85,200 crore
P/E Ratio (TTM): 21.44
P/B Ratio: 3.38
Dividend Yield: 1.13%
EPS (TTM): ₹45.97
Book Value: ₹339.84
Face Value: ₹1.00
Volume: 14,363,519 shares
VWAP: ₹966.64

BAJFINANCE 1D Time frame📉 Current Market Snapshot
Current Price: ₹1,003.25
Previous Close: ₹970.25
Day's Range: ₹970.85 – ₹1,004.60
52-Week High: ₹1,004.60
52-Week Low: ₹645.10
Market Cap: ₹6,24,270 crore
P/E Ratio: 35.8
Book Value: ₹156
Dividend Yield: 0.44%
ROE: 19.2%
Debt-to-Equity Ratio: 3.74
Beta: 1.01
EPS (TTM): ₹28.00
Face Value: ₹1.00

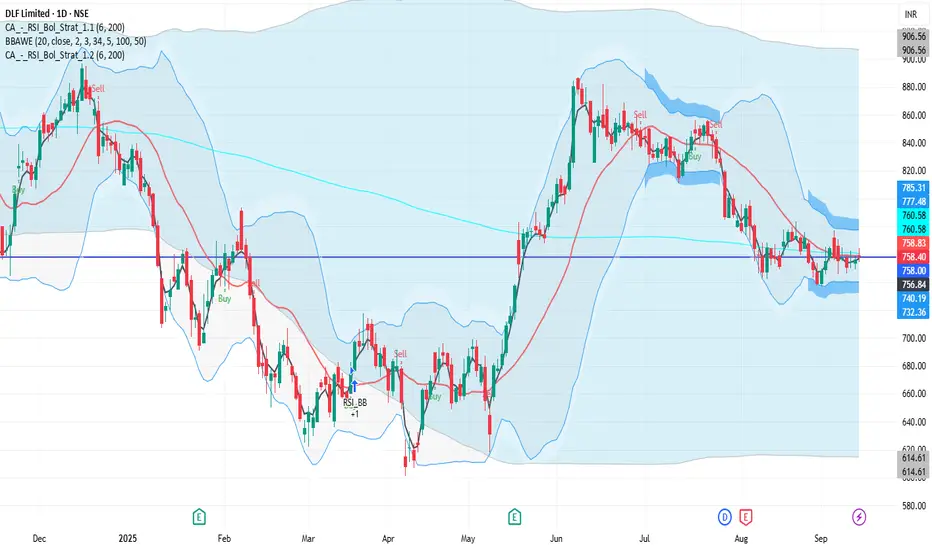
DLF 1D Time frame📉 Current Market Snapshot
Current Price: ₹758.40
Previous Close: ₹756.35
Day's Range: ₹754.20 – ₹764.40
52-Week High: ₹929.00
52-Week Low: ₹601.20
Market Cap: ₹1.87 lakh crore
P/E Ratio: 41.85
Dividend Yield: 0.79%
ROE: 10.76%
Debt-to-Equity Ratio: 0.10
Beta: 1.78
EPS (TTM): ₹18.12
Book Value: ₹172.51
Face Value: ₹2.00
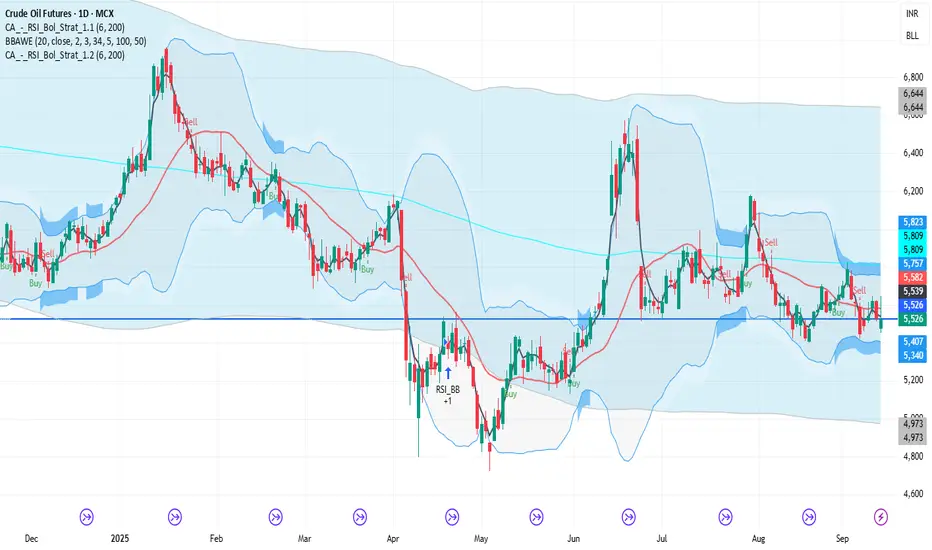
CRUDEOIL1! 1D Time frame📉 Current Market Snapshot (as of September 13, 2025)
Previous Close: ₹5,526
Day's Range: ₹5,454 – ₹5,647
Open: ₹5,480
Close: ₹5,530
📊 Key Levels
Support: ₹5,495, ₹5,442
Resistance: ₹5,663, ₹5,800, ₹5,865
NIFTY 1D Time frame📍 Current Level
25,114.00 (closing value)
Short-Term Outlook
Bullish Scenario: A sustained move above ₹25,200 could lead to a test of the 52-week high around ₹26,277.35.
Bearish Scenario: A drop below ₹25,000 may signal a potential pullback toward ₹24,800.

BPCL 1D Time frame📍 Current Price
₹318.00 (closing price)
Short-Term Outlook
Bullish Scenario: A sustained move above ₹322.65 could lead to a test of the 52-week high around ₹376.00.
Bearish Scenario: A drop below ₹312.30 may signal a potential pullback toward ₹300.00.

SBIN 1D Time frame📍 Current Price
₹823.30 (down 0.06% from previous close)
Short-Term Outlook
Bullish Scenario: A sustained move above ₹836 could lead to a test of the 52-week high around ₹875.50.
Bearish Scenario: A drop below ₹785.10 may signal a potential pullback toward ₹794.00.

HINDUNILVR 1D Time frame📍 Current Price
₹2,580.50 (down 1.58% from previous close)
Short-Term Outlook
Bullish Scenario: Sustained move above ₹2,650 could lead to a test of ₹2,700.
Bearish Scenario: Break below ₹2,553.70 may signal a deeper pullback toward ₹2,500.

MARUTI 1D Time frame📍 Current Price
₹15,325.00
Short-Term Outlook
Bullish Scenario: A sustained move above ₹15,450 could lead to a test of the 52-week high around ₹15,384.
Bearish Scenario: A drop below ₹15,100 may signal a potential pullback toward the ₹14,800 level.

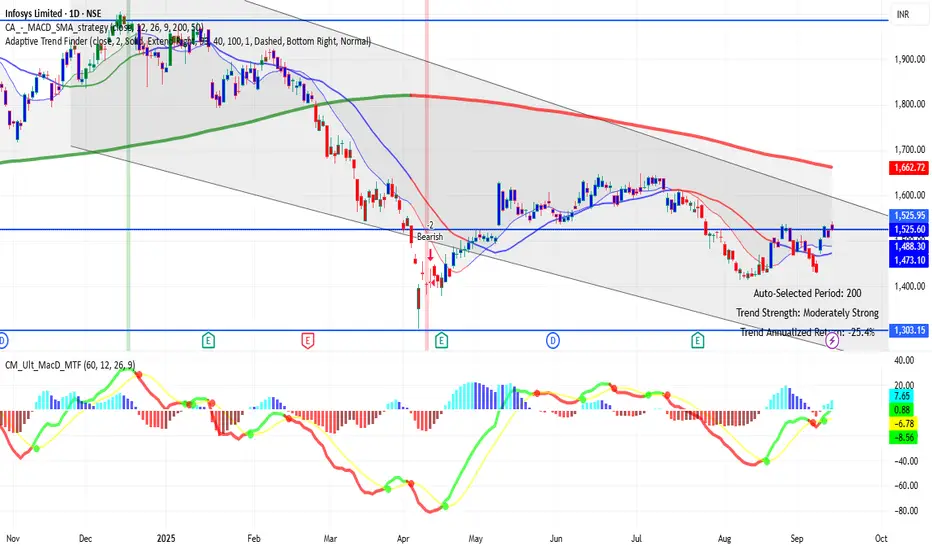
INFY (Infosys) 1D Time Frame Current Status
Price around ₹1525
Positive momentum today
Key Levels
Support: ₹1510 → ₹1500
Resistance: ₹1535 → ₹1545
Outlook
Holding above ₹1510 keeps trend bullish. Break above ₹1535–1545 can push price higher, but falling below ₹1500 may bring weakness.
Physiology of Trading in the AI Era1. Human Physiology and Trading: The Foundations
1.1 Stress and the Fight-or-Flight Response
When humans trade, they are not just using rational logic; they are also battling their physiological responses. Every trade triggers an emotional and bodily reaction. For example:
Adrenaline release when markets move rapidly in one’s favor or against them.
Increased heart rate and blood pressure during volatile sessions.
Sweating palms and muscle tension as risk builds.
This “fight-or-flight” response, mediated by the sympathetic nervous system, has been part of human survival for millennia. In trading, however, it can impair rational decision-making. A surge of cortisol (the stress hormone) may lead to panic selling, hesitation, or impulsive buying.
1.2 Dopamine and Reward Pathways
Trading can be addictive. Each win activates dopamine in the brain’s reward circuitry, similar to gambling or gaming. Traders often “chase” that feeling, even when logic dictates restraint. Losses, on the other hand, trigger stress chemicals, leading to cycles of overtrading, revenge trading, or withdrawal.
1.3 Cognitive Load and Fatigue
Traditional trading involves constant information processing—charts, news, market data, risk assessments. This consumes enormous cognitive energy. Long sessions can lead to decision fatigue, reducing accuracy and discipline.
Thus, before AI, trading was fundamentally a battle of human physiology against the demands of complex markets.
2. The AI Disruption in Trading
2.1 Rise of Algorithmic and High-Frequency Trading (HFT)
AI-driven systems can execute thousands of trades per second, scan global markets, detect patterns invisible to humans, and adjust strategies in real-time. These machines do not suffer from fear, greed, or fatigue.
For human physiology, this means:
Reduced direct execution stress (since machines handle it).
Increased monitoring stress (humans must supervise systems).
Psychological dislocation (traders may feel less control).
2.2 Machine Learning in Decision Support
AI models analyze sentiment from social media, evaluate economic indicators, and forecast price moves. Instead of staring at multiple screens, traders increasingly interpret AI dashboards and signals. This shifts the physiological strain from reaction-based stress to interpretation-based stress.
2.3 Automation and Human Role Redefinition
In the AI era, humans are less about execution and more about strategy, oversight, and risk management. Physiology adapts to:
Lower manual workload.
Higher demand for sustained attention.
Possible under-stimulation leading to boredom and disengagement.
3. Physiological Challenges of Trading with AI
3.1 Stress of Oversight
Even though AI reduces execution stress, it creates new types of anxiety:
“What if the algorithm fails?”
“What if there is a flash crash?”
“What if my model is outdated?”
This “meta-stress” is often harder to manage because the trader is not directly in control. Cortisol levels may remain high over long periods, contributing to chronic stress.
3.2 Cognitive Overload from Complexity
AI outputs are highly complex—probability charts, heatmaps, predictive models. Interpreting them requires intense concentration, taxing the prefrontal cortex (responsible for logic and planning). Prolonged exposure leads to cognitive fatigue, headaches, and reduced analytical clarity.
3.3 Screen Time and Physical Health
AI-based trading often demands sitting for long hours in front of multiple screens. This leads to:
Eye strain (computer vision syndrome).
Poor posture and musculoskeletal stress.
Reduced physical activity, increasing long-term health risks.
3.4 Emotional Detachment vs Overreliance
Some traders experience emotional detachment because AI reduces the “thrill” of trading. Others, however, become overly reliant, experiencing anxiety when AI signals conflict with personal judgment. Both conditions alter physiological balance—either numbing dopamine pathways or overstimulating stress responses.
4. Positive Physiological Impacts of AI in Trading
4.1 Reduced Acute Stress
Since AI handles rapid execution, traders are spared the intense “fight-or-flight” responses of old floor trading. Heart rate variability (HRV) studies show that algorithmic traders often experience lower peak stress events compared to manual traders.
4.2 Better Sleep and Recovery (Potentially)
If managed well, AI systems allow for reduced night sessions and improved rest. However, this is true only when traders trust their systems.
4.3 Cognitive Augmentation
By filtering noise and providing data-driven insights, AI reduces raw information overload. Traders can focus on strategic thinking, which may be less physiologically taxing than high-speed execution.
5. Neurophysiology of Human-AI Interaction
5.1 Brain Plasticity and Adaptation
Just as the brain adapted to calculators and computers, it is adapting to AI in trading. Neural pathways reorganize to prioritize pattern recognition, probabilistic thinking, and machine-interpretation skills.
5.2 The Stress of Uncertainty
The human brain dislikes uncertainty. AI, by nature, operates probabilistically (e.g., “there is a 70% chance of price rise”). This constant probabilistic feedback keeps traders in a state of anticipatory stress, leading to sustained low-level cortisol release.
5.3 Trust and the Oxytocin Factor
Neuroscience shows that trust is mediated by oxytocin. When traders trust their AI systems, oxytocin reduces stress. But if trust breaks (due to errors or losses), physiological stress spikes significantly higher than in traditional trading.
6. The Future of Trading Physiology in the AI Era
6.1 Neural Interfaces and Brain-Computer Trading
As AI advances, direct brain-computer interfaces may allow traders to interact without keyboards or screens. This will blur the line between human physiology and machine execution.
6.2 AI as Physiological Regulator
AI could not only trade but also monitor the trader’s physiological state—detecting stress, suggesting breaks, or even auto-reducing risk exposure when cortisol levels spike.
6.3 From Physiology to Philosophy
Ultimately, the AI era forces us to ask: What is the role of human physiology in a world where machines outperform us? Perhaps the answer lies not in competing, but in complementing—using uniquely human traits while allowing AI to handle mechanical execution.
Conclusion
The physiology of trading in the AI era is a fascinating intersection of biology and technology. Human bodies, wired for survival in primal environments, now face markets dominated by machines that never fatigue or feel fear. While AI reduces some physiological burdens—like execution stress—it introduces new forms of stress, such as oversight anxiety, cognitive overload, and emotional detachment.
The challenge for modern traders is not to resist AI but to manage their physiology in harmony with it. By using mindfulness, ergonomic design, physical health practices, and new neuro-adaptive tools, traders can maintain resilience.
In the long run, the physiology of trading will evolve. The human brain adapts, neural pathways shift, and AI itself may become an ally in regulating our stress. Trading in the AI era is no longer just about markets—it is about the integration of human physiology with machine intelligence.
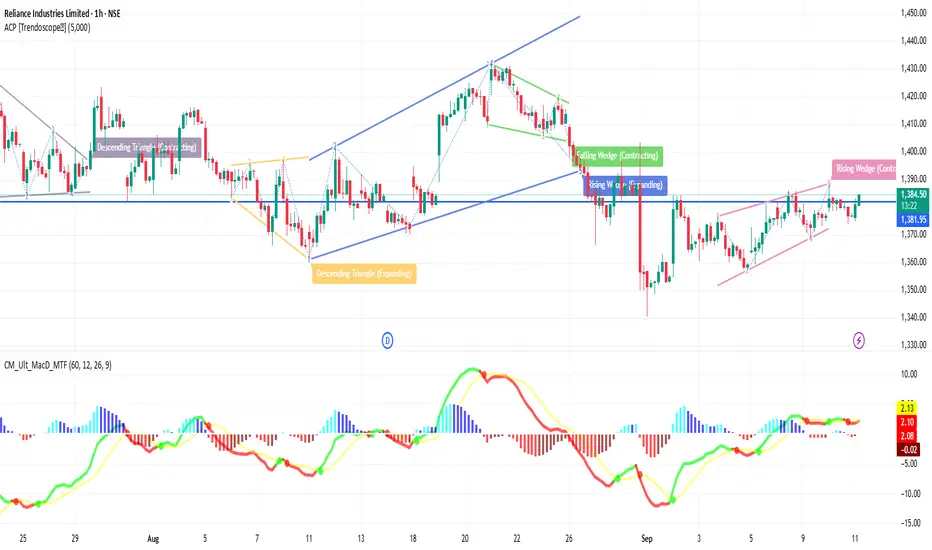
RELIANCE 1H Time framePrice Movement (1H Candles)
Reliance is trading around ₹1,381 – ₹1,383.
On the 1-hour chart, candles are showing sideways consolidation between ₹1,375 (support) and ₹1,385 (resistance).
This tells us that buyers and sellers are in balance, waiting for a breakout.
2️⃣ Support & Resistance Zones
Immediate Support: ~₹1,375 → If this breaks, price may slip toward ₹1,360.
Stronger Support: ~₹1,345 – ₹1,340 → A key zone where buyers may return strongly.
Immediate Resistance: ~₹1,385 → A breakout above can open the way to ₹1,395 – ₹1,400.
Major Resistance: ~₹1,415 – ₹1,420 → If crossed, trend becomes strongly bullish.
3️⃣ Indicators (1H View)
20 EMA: Very close to current price, showing consolidation.
50 EMA: Just below current levels, acting as dynamic support.
200 EMA: Much lower, confirming long-term uptrend is intact.
RSI: Neutral (around 50) → market is not overbought, not oversold.
MACD: Flat → no clear momentum yet, waiting for direction.
4️⃣ Trend Explanation
Right now, the 1-hour trend is neutral to mildly bullish.
If Reliance holds above ₹1,375 – ₹1,360, bulls remain in control.
A move above ₹1,385 with volume can trigger a rally toward ₹1,400+.
But if Reliance breaks below ₹1,360, weakness may appear, and the next fall could be toward ₹1,340.
5️⃣ Conclusion (1H Time Frame)
Sideways Phase: Reliance is consolidating in a narrow band.
Bullish Signal: Above ₹1,385 with good buying volume.
Bearish Signal: Below ₹1,375, deeper support around ₹1,360.
Traders should wait for a breakout or breakdown before taking big positions.
Impact of Rupee-Dollar Exchange Rate on Indian StocksIntroduction
The stock market is a complex system where numerous factors—both domestic and global—interact to determine price movements. One such crucial factor is the exchange rate between the Indian Rupee (INR) and the US Dollar (USD). The Rupee-Dollar exchange rate plays a vital role because the US Dollar is the world’s reserve currency, the primary medium of global trade, and a benchmark for financial transactions worldwide.
In India, the economy is deeply interconnected with global trade, capital flows, and financial markets. Any change in the value of the Rupee against the Dollar has wide-ranging implications on businesses, investors, and the stock market. Companies that import raw materials or export finished goods, sectors like Information Technology (IT), Pharmaceuticals, Oil & Gas, Banking, Aviation, and even Foreign Institutional Investors (FIIs), are directly influenced by these fluctuations.
This essay explores in detail how the Rupee-Dollar exchange rate impacts Indian stocks, covering the theoretical background, sectoral influences, investor behavior, macroeconomic effects, and real-world case studies.
Understanding the Rupee-Dollar Exchange Rate
The exchange rate refers to how much one unit of a currency is worth in terms of another. In India, the exchange rate most closely tracked by investors is INR/USD—the number of Rupees required to buy one US Dollar.
If 1 USD = ₹80, it means that importing something worth $1 will cost ₹80 in India.
If the Rupee depreciates (falls in value), say 1 USD = ₹85, imports become more expensive, but exporters receive more Rupees for the same Dollar earnings.
If the Rupee appreciates (gains in value), say 1 USD = ₹75, imports become cheaper, but exporters earn fewer Rupees per Dollar.
This constant push-and-pull directly influences corporate profitability and, in turn, the stock market.
Why Does the Rupee Move Against the Dollar?
The exchange rate fluctuates due to a combination of domestic and global factors:
Demand & Supply of Dollars – If India imports more than it exports, demand for Dollars rises, weakening the Rupee.
Foreign Institutional Investment (FII) Flows – When FIIs invest in Indian equities, they bring in Dollars, strengthening the Rupee. Conversely, when they pull out, the Rupee weakens.
Interest Rate Differentials – Higher interest rates in the US attract global investors, increasing demand for Dollars.
Crude Oil Prices – India is heavily dependent on crude imports. Rising oil prices increase Dollar demand, weakening the Rupee.
Geopolitical Events – Wars, sanctions, and global economic slowdowns push investors toward the Dollar as a "safe haven."
Inflation & Growth Rates – Higher inflation in India compared to the US reduces the Rupee’s purchasing power.
These factors cause daily volatility in the Rupee-Dollar exchange rate, impacting stock prices.
The Link Between Exchange Rate and Stock Market
The Rupee-Dollar relationship influences stocks in three broad ways:
Corporate Earnings Impact – Companies that earn or spend in Dollars see changes in profitability.
Foreign Investor Behavior – FIIs track currency stability before investing in emerging markets like India.
Macroeconomic Sentiment – A stable Rupee improves confidence, while sharp depreciation raises concerns about inflation, current account deficit, and fiscal health.
Sector-Wise Impact of Rupee-Dollar Exchange Rate
1. Information Technology (IT) Sector
Indian IT companies like TCS, Infosys, Wipro, and HCL earn the majority of their revenue in Dollars by exporting software services to the US and Europe.
A weak Rupee is positive for IT stocks since they earn more Rupees for the same Dollar revenue.
Example: If Infosys earns $1 billion, at ₹80/USD revenue = ₹80,000 crore. If Rupee falls to ₹85/USD, revenue = ₹85,000 crore (without increasing actual Dollar earnings).
Impact: Rupee depreciation → IT stocks rally. Rupee appreciation → IT stocks face margin pressure.
2. Pharmaceutical Sector
Similar to IT, Pharma companies like Sun Pharma, Dr. Reddy’s, and Cipla export a large share of medicines to the US.
A weak Rupee boosts export revenues, but import costs (like Active Pharmaceutical Ingredients from China) may rise.
Impact: Net positive for export-oriented pharma firms, but mixed for those heavily dependent on imports.
3. Oil & Gas Sector
India imports over 80% of its crude oil needs, priced in Dollars.
A weak Rupee makes oil imports costlier, increasing input costs for companies like IOC, BPCL, HPCL.
This also impacts sectors like aviation, paints, fertilizers, and chemicals, which rely on crude derivatives.
Impact: Rupee depreciation hurts oil & gas and related sectors.
4. Aviation Industry
Airlines like IndiGo, SpiceJet, and Air India earn revenue in Rupees but pay for aircraft leases, maintenance, and fuel in Dollars.
A weak Rupee increases costs significantly, leading to lower margins.
Impact: Rupee depreciation is negative for aviation stocks.
5. Banking & Financial Services
Banks with significant foreign borrowings may face higher repayment costs when the Rupee falls.
However, if they hold Dollar assets, they benefit.
Investor sentiment in the financial sector often mirrors overall macroeconomic stability tied to currency movements.
6. Import-Oriented Companies
Sectors like electronics, automobiles, FMCG (raw materials), and chemicals rely on imports.
A weaker Rupee raises raw material costs, compressing margins unless passed on to consumers.
7. Export-Oriented Manufacturing
Sectors like textiles, gems & jewelry, and leather benefit from a weaker Rupee as global buyers pay in Dollars.
However, if raw materials are imported, the benefits get diluted.
Impact on Foreign Investors
Foreign Institutional Investors (FIIs) are among the biggest drivers of the Indian stock market.
Stable Rupee: Encourages FIIs to invest since currency risk is lower.
Weakening Rupee: Even if stock returns are strong, FIIs may lose money when converting Rupees back to Dollars.
Example: If Nifty rises 10% but the Rupee falls 8% against the Dollar, FIIs net only ~2% returns.
Sudden depreciation often triggers FII outflows, leading to stock market corrections.
Thus, exchange rate stability is as important as stock fundamentals in attracting foreign capital.
Macroeconomic Effects on Stock Market
Inflation: A weak Rupee increases import costs (oil, electronics, machinery), leading to inflation. High inflation reduces corporate margins and consumer demand, pressuring stocks.
Current Account Deficit (CAD): Higher import bills widen CAD, weakening investor confidence.
Government Fiscal Position: Subsidy burdens (fertilizers, fuel) rise with Dollar appreciation, impacting fiscal deficit and bond yields, indirectly affecting equities.
Monetary Policy: RBI may raise interest rates to defend the Rupee, impacting borrowing costs and stock valuations.
The Way Forward
India’s growing integration into the global economy ensures that the Rupee-Dollar dynamic will continue to influence stocks. Key trends to watch:
US Federal Reserve policies – Dollar movements globally.
Energy Transition – Reducing oil imports will lower currency vulnerability.
Boosting Exports – Government initiatives like PLI schemes strengthen export-led sectors.
RBI Interventions – Maintaining stability via forex reserves.
Conclusion
The Rupee-Dollar exchange rate is more than just a number—it’s a reflection of India’s economic health, trade balance, and global investor confidence. Its impact on the stock market is far-reaching:
Exporters like IT and Pharma gain from Rupee weakness.
Import-heavy sectors like oil, aviation, and FMCG suffer.
Investors—both domestic and foreign—adjust portfolios based on currency trends.
Macroeconomic stability is closely linked to exchange rate dynamics.
For stock market participants, understanding this relationship provides an edge in making informed investment decisions. In the long run, India’s structural reforms, increasing exports, and growing financial depth may reduce vulnerability to Rupee-Dollar volatility. Until then, every swing in the currency will continue to ripple across Dalal Street.