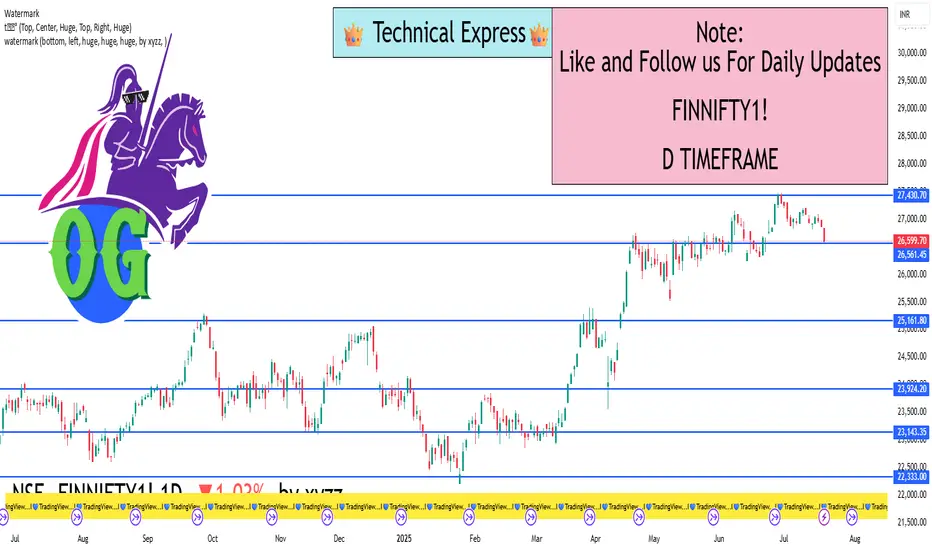
FinNifty – 1 Day Timeframe✅ Closing Summary:
Closing Price: ₹26,556.15
Change: −₹253.30 (−0.94%)
Opening Price: ₹26,809.45
Intraday High: ₹26,785.35
Intraday Low: ₹26,513.80
The FinNifty index saw a sharp drop today, primarily driven by weakness in key financial stocks and negative investor sentiment.
🔍 Key Reasons for the Decline:
Banking Sector Weakness:
One of the biggest drags was a major bank (e.g., Axis Bank) that reported weaker-than-expected quarterly earnings.
This led to panic selling in other banking and financial institutions as well.
Foreign Institutional Investors (FII) Selling:
Significant outflows from FIIs contributed to the negative sentiment.
Investors remained cautious ahead of upcoming major earnings reports and global cues.
Global Market Pressure:
Concerns about U.S. interest rate policies, inflation data, and global recessionary fears kept the broader financial market under pressure.
Psychological Level Break:
The index broke key psychological support around ₹26,600, triggering technical selling and increased volatility.
📈 Technical Outlook (Short-Term):
Support Zone: ₹26,500 to ₹26,400
This area provided some buying interest during the day, but a break below could open doors to ₹26,200 or lower.
Resistance Zone: ₹26,750 to ₹26,900
This region needs to be reclaimed for any positive momentum to sustain.
Momentum Indicators:
RSI (Relative Strength Index): Trending downward, approaching oversold conditions (~38–42).
MACD (Moving Average Convergence Divergence): Showing bearish crossover, confirming short-term weakness.
Volume: Above average during the sell-off, suggesting institutional participation in the decline.
📆 Recent Trend Performance:
1-Day Return: −0.94%
1-Week Return: −0.65%
1-Month Return: +1.35%
6-Month Return: +18.6%
1-Year Return: +13.4%
Despite the daily fall, the medium-to-long-term trend remains bullish, supported by overall strong fundamentals and earnings growth expectations.
🧠 What Traders & Investors Should Know:
Short-Term Traders: Should be cautious. Look for a bounce near the support zone for short-covering opportunities or fresh entries with tight stop-losses.
Swing Traders: May wait for confirmation of support holding at ₹26,500 before considering long trades.
Long-Term Investors: The decline could be seen as a healthy correction in an otherwise strong uptrend. Ideal for staggered buying in quality financial stocks.
💬 Conclusion:
FinNifty is currently experiencing short-term pressure due to earnings misses, global uncertainty, and FII outflows. However, its long-term chart remains constructive. Today’s 1-day candle represents a bearish move, but unless ₹26,400 breaks decisively, a recovery is possible in the coming sessions—especially if upcoming results from top banks like HDFC and ICICI meet or exceed expectations
Tatsteelanalysis
TATASTEEL for 45% (approx..) Potential GainTata steel is showing retest breakout... according to some theories RETEST STOCKS ARE THE BEST STOCKS...
All data is available in public domain..
CMP : 160
TG : 215
SL : 142
Stock's selection based on 5 Point Analysis:
1: Idea : Retest Breakout.
2: Support : Volume, Delivery & VWAP.
3: Technical : 9/21/55/200-EMA, RS>0, MACD, RSI & Super trend up.
4: Fundamental : PE, PAT, Industry & peer PE and sector performance.
5: Timing : Entry Timing on day chart.
Disclaimer : It is my personal view as a trader and for educational purpose only. Equity market involves risk .
Please consult your financial adviser before taking any decision.
Disclosure : going to Hold

Tata Steel Good BuyHello fellow traders,
Tata Steel recently experienced a breakout from its established trend line a few weeks ago. Currently, it appears to be retracing towards the ascending trendline from above. This retracement could present an attractive buying opportunity for investors.
Additionally, on the price chart, Tata Steel has formed a symmetrical pattern. This pattern is characterized by a series of lower highs and higher lows, creating a converging shape. In the context of this symmetrical pattern, it's reasonable to anticipate that after breaking out of this formation, Tata Steel's stock price may potentially ascend by around 63 points.
To explain further, a symmetrical pattern suggests a period of indecision in the market, where buyers and sellers are in equilibrium, resulting in a converging price structure. The breakout from this pattern often leads to a significant price movement, which, in this case, is expected to be an upward move of approximately 63 points. This could provide a trading or investment opportunity for those looking to capitalize on the stock's potential upward momentum. NSE:TATASTEEL NSE:NIFTY
Safe trader can wait for 115 level to buy

Tata Steel : Time for accumulationTata Steel nearing its 2020 Base which is a confluence of (22/03/2021 B/O level) and (19/01/2018 Swing Top)
750-786 good level if we get.

Tata Steel - A bearish setup (Sell on Rise)Tata Steel
1. Trading below 100EMA
2. HNS Broken
3. Closed below 1,231 (last credible support)
4. Trading within Pitchford and may extend move towards lower 1st Deviation
5. Has potential to move towards 200EMA and ABCD Tgt confluence at around 1,125 and beyond

TATA STEEL SHOWING A BREAK OUT SIGN!Tata steel stock price has fallen in recent times. However, the price is showing bullish signs now. The volumes are increasing and the price is nearing a breakout. The overall metal index showed a bullish sign.
The XABCD bat pattern sets a supply zone/ PRZ which has to be taken out to make a new all-time high.
Start booking the profits from the supply zone and trail until the all-time high is broken. The short-covering moves can take the price to the ultimate target set by the XABCD bearish crab pattern.
The breakout, stop-loss, and target levels are mentioned on the chart.
Happy trading :)
This is just for educational purposes.


TATASTEEL ANALYSIScurrent patterns:
1.trading in parallel channel
2.closely following trendline support
3.mid of parallel channel will act as resistance and the trendline support confirms that if the whole channel is broken downside.
4.if it breaks upper channel then we can see testing of resistance of 350-360.
CLOSELY OBSERVE THE PATTERNS WE WILL SURELY GET GOOD MOVES AS MULTIPLE PATTERNS ARE CONFIRMING THE CASES IN CASE OF UPSIDE OR DOWNSIDE.
