TCS with a target of 3700 TCS is now near to support level and 1 hour trend line where it can jump up from support level 3550 to 3700 to fill the gap area of 21st feb's low and 22nd feb's high.
CMP : 3563
buy : 3550
target : 3700
SL: 3520
TCS


sell call on tcshead and sholder breakout with channel breakout
current price 3605 rs.
1st target 3200 rs.
2nd target 3000 rs.
stop loss 3710 rs.

TCS - breakout resistance ?hi guys ,
as per chart we see tcs will be consolidate and ready for break its 4000 level resistance , and target gives 4500 or 4600 .
within 2 week it will happend if there is good global market .
buy - 3600
target - 4500
sl- 3300

TCS under symmetrical triangleCHART -> TCS DAILY SETUP
Keep an eye on TCS as it is trading under a symmetrical triangle in daily timeframe, with upper trendline as resistance and lower trendline as support.
Disclaimer: This is for educational purpose only. This is not any recommendations. I am not SEBI registered. Please consult your financial advisor before taking any action.

WHERE IS NIFTY IT HEADED ?Nifty It has been showing no particular direction for the past week, sometimes on a solid green day it manages to fall and sometimes seeing Nasdaq it seems to gain some points but what is the real direction of this sector?
I have taken the top 5 Nifty I.T stocks that have the most weightage in this sector and have analysed them.
Below are all the top 5 constituents of cnxit.
1. INFY
2. TCS
3. HCLTECH
4. WIPRO
5. TECHM
INFY
I can spot LH LL formation in this and seems like it has had it's pullback and will continue to correct itself.
TCS
TCS has been following this support trendline for sometime and it can be taken into account that after double top tcs went for a pullback and again a low can be made near 3550 levels.
HCLTECH
HCLTECH is facing resistance from 1200 levels which is psychologically and technically a strong resistance level and now it seems like it's due a correction.
WIPRO
Took a bounce from the demand zone but is still below the 200 ma and flip level.
TECHM
Techm looks like that it is sitting on a crucial level and the next few candles can give us a sense of direction.
Please LIKE, COMMENT and SHARE to motivate and support me. I'll keep on posting new ideas on Indices & Stocks. Be sure to follow so that you don't miss any good trades that might have been rewarding.
Any comments and critiques will be appreciated even if it's of opposite view as a trader can also be right so many times.
These are just my views and I am not a SEBI registered analyst so consult your advisor before taking any trades.

TCS Fut - LongData Shows that TCS takes support from 50 EMA and bounces back and give a minimum return of 3-3.5%.


TCS Rockets In Preparation For Liftoff To 4000+TCS is forming an ending diagonal in sub-wave 5 of wave((5)).
Price is about to complete the last move of the ending diagonal.
It has created sub-waves 'i' and 'ii' of wave 5.
The trader can initiate a long position for wave 'iii' after the breakout of wave 'i'.
Rule of invalidation : wave 'ii' can never overlap the starting point of wave 'i'. The best way to reduce risk is through t railing stops.
Acceleration of wave (5) can give the move up to 4080 .

TCS Pre-emptive Cup and Handle Target 4600• Historically, 7 out of 10 years TCS has closed positively in the months April to Aug, Avg Monthly returns in these months are >3%
• Highest gains in term of % (~24% in April’18 | ~12% in May’17 | ~14% June’14 | ~20% Jul’13 | ~20% Aug’21) has also come in the same time frame
• Recent announcement of buy back at 4500/shares can support the momentum
• Currently the stock is in formation of Cup and Handle patter on weekly chart, which expected to complete the pattern by March’22, after consolidation of ~7 months
• Upward momentum is expected to pick up post Q4FY21 and stock is expected to rally till 4600+ levels in Q1FY22 to Q2FY22
One can pre-empt the handle formation of the pattern and enter in to long trade at CMP or on dips till 3625, for the target of 4600+ in next six months.
If stock closes below 3600 on weekly basis, the view will get negated.
*************
Disclaimer :
-Please conduct your thorough research/analysis before doing the trade
-Idea shared is only for educational purpose
-Please trade on your own risk
************

TCSThis is how tcs can react tomorrow, it's on its important zone if it breakes then we can expect a good move towards all time high, but we should wait and should see whether it consolidates at this level or what.

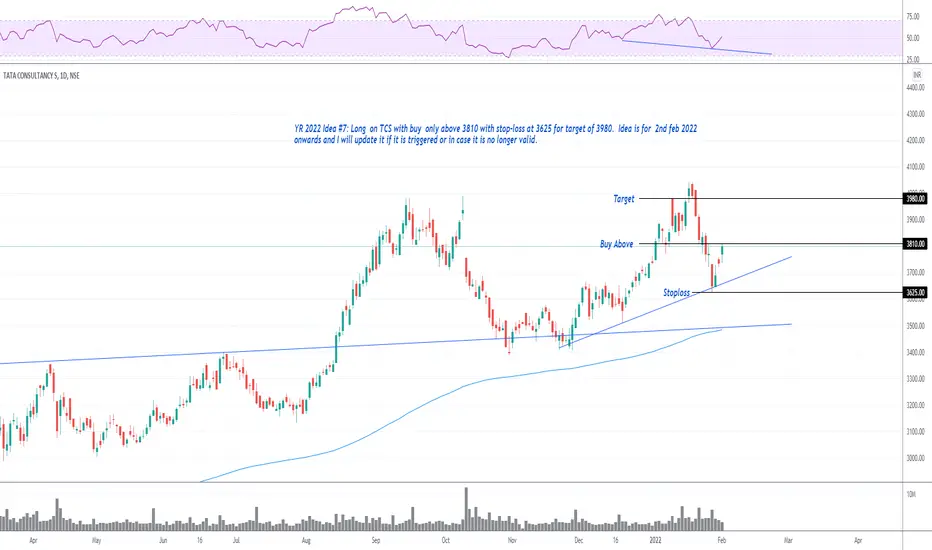
YR 2022 Idea #7: Long on TCS This is a public swing trade idea and is only for Learning and observational purpose. Please understand your risk and take full responsibility of your actions. We would comment on any further updates on our entry, targets and stop-loss on this idea, so make sure to follow if you want to get further updates. Our objective to help anyone who wants to learn technical analysis using charts. You can post your queries in comment section here and we will try to answer asap.
TCS GOING TO HIT AGAIN 4000 SOONOn the daily chart, the Share holds a major support level at 3750 with good volumes. If he holds it and momentum continues as per the chart then it going to test again at 4000 levels in the near future. Also, Rounding Curve is showing if he breaks level 3930 and holds it.
Short term target is 4000 from the current level
Long term target is 4200 in 6 months

TCS IS NOW THE BEST FOR LONG1. Rsi is taking support on 40 levels
2. Price is also getting support on the levels
3. Can give fortune

#BANKNIFTY BY @ayushsaini0123#We will make only profit.
#I will Tell you full trade in my last Video.
# I Don't Have Any Information to tell you to buy PE Above 37700.
#If you need any help comment or message me.

#Traders Please Watch #Banknifty #Week#We will make only profit.
#I will Tell you Lowest Point.
#If you need any help comment or message me.

Short on IT stocks All the explanation has been explained in the charts above.
Your insights are welcome

Soon Nifty IT Bounce Back...As you can see in above chart Nifty IT have Support...So, Soon it can Bounce Back with Large Cap & Mid Cap IT Stocks...

NIFTY IT PRICE ACTION ANALYSISNIFTY IT index is currently at a potential reversal point suggested by the XABCD bullish crab pattern and low RSI value on the daily timeframe.
The bounce may be up to 0.382-0.618 fib zone extension of CD.
This doesn't mean IT would reverse its trend from here. Before the budget, it might test important resistance 36750. This might be just a correction for the falling impulse.
So, beware and wait for confirmation before investing.

TCS: Range bound movement till Mar 2022 ?TCS
The stock looks likely to be range bound
Broader range 3400-4000
Plan your trade accordingly...!!!
Take care & safe trading...!!!
Disclaimer
- The view expressed here is my personal view
- Past performance is not a guarantee for future predictions
- Use this for educational purpose
- Any decision you take, you need to take responsibility for the same
- It's your hard earned money. Treat it wisely
- Trade / Invest keeping in mind your trading style, goals and objectives, time horizon & risk tolerance
- if trading in F&O, understand that F&O trading involves risk
- Do take proper risk management measures
- Do your own analysis and consult your financial adviser if need be

TCS INTRADAY TRADEAs we can see BULLISH DIVERGENCE in TCS we can ho long after breaking 50ema and will go short only if it breaks yesterday's low. Targets are mentioned in the chart itself.

NIFTY50 Future Intraday support and resistances 24/01/2022NIFTY50 may open gap up because of good Q3 results of ICICIBANK, if nifty sustains at the upper levels we can see levels of 17800/17950 in NIFTY Future.
If on the lower hand levels of 17500 breaks in Nifty Future we can see levels of 17450/17320 in Nifty Future

TCS LongI hope you can now see how TCS represents an excellent low risk profit entry setup allowing you to trade in the market. Take positions so that the risk/reward is in your favor.
Knowing why, where & when a strong reversal signal is being generated will be the only way to capitalize on your technical analysis .
Disclaimer: It should not be assumed that the methods, techniques, or indicators presented in these chart will be profitable or that they will not result in losses. There is no assurance that the strategies and methods presented will be successful for you. Past results are not necessarily indicative of future results. You should not trade with money that you cannot afford to lose. Examples presented in these charts are for educational purposes only and it should not be assumed that these are indicative of ordinary trades. These setups are not solicitations of any order to buy or sell. The publisher assume no responsibility for your trading results. There is a high degree of risk in trading.
