#BANKNIFTY FOR 3 DAYS...💲👑#We will make only profit.
#If you know deep than check my last video.
#Today 50-50% chance for gap up or gap down opening.
#Market will be sidewise on 17 jan.
#If you need any help comment or message me.
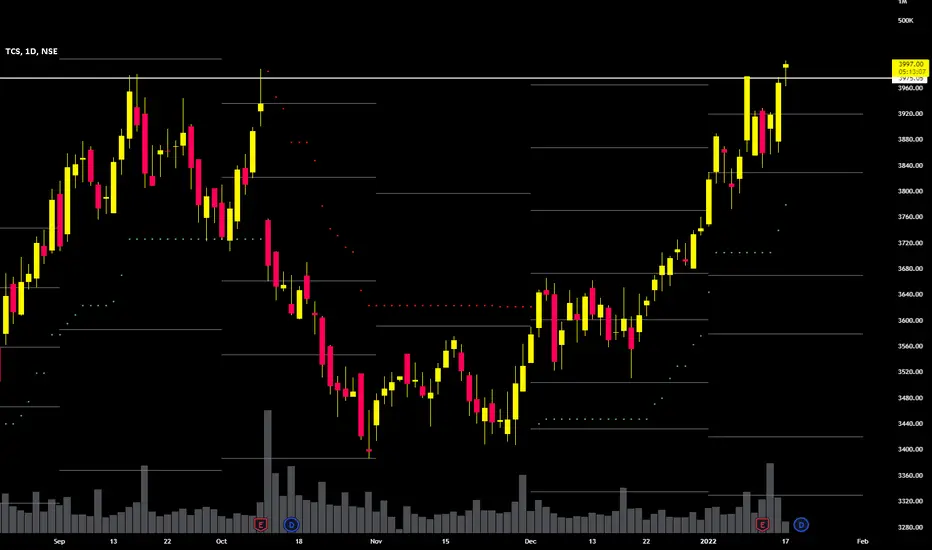
TCS

#BANKNIFTY FOR 3 DAYS...💲👑#we will make only profit.
#Today 50-50% chance for gap up or gap down opening.
#Market will be sidewise on 17 jan.
#If you need any help comment or message me.


TCS looks Bullish as it gave breakout of all time highIt not just gave breakout but also sustaining over it which is a bullish sign.
TCS share price was Rs 3,985.00 as on 17 Jan, 2022, 10:07 AM IST. TCS share price was up by 0.42% based on previous share price of Rs. 3897.9. In last 1 Month, TCS share price moved up by 11.01%.
Top 4 Peers for TCS are Infosys Ltd., HCL Technologies Ltd., Wipro Ltd. and Tech Mahindra Ltd.
Key Metrics for TCS are:
PE Ratio of TCS is 39.10
Earning per share of TCS is 98.89
Price/Sales ratio of TCS is 7.16
Price to Book ratio of TCS is 16.85
TCSGo long above 3990 DCB
Rounding bottom pattern of 550 points forming
Can draw targets according to that
Support 3770-3800

TCS - Trading at Previous high, potential targetPrice trading near the previous high, as discussed CNXIT is about to break the previous high these IT stocks should be the potential targets for the traders.
One can wait for the breakout from the previous high or get it on when there is a retest of the breakout level !!!


TCS BULLISH BREAKOUT - positional TCS after recent correction again heading to bullish after breakout seen in daily chart. bullish confirmation candle seen clearly on chart .
As Prime bet from IT Sector TCS can outperform even in falling market .
BUY TCS @3640
TARGET 3850-3900 (1 month )
Stop Loss 3450
This analysis purely base on technical indicators please make own study and take final call.
Wish u Happy Trading !!

TCS Buy-back & how I got it rightTCS BUY BACK & HOW I GOT IT RIGHT
BACKGROUND
TCS declared its Q3 results last evening and it was expected to announce a share buy-back proposal. This news was available ahead of the results and therefore, I decided to work out what could be the likely buy-back price that it may offer.
Based on my observations, TCS has a tendency to cross the buy-back price and then retrace either below or around the buy-back price just when the buy-back approaches. The logic is that the scrip is unlikely to trade above the buy-back price and is more likely to fall for some time.
INTENT
I have holdings in the scrip so I was eager to test my logic of arriving at the likely buy-back price.
In the past. I have traded TCS pre and post-buy-back with the intention to make trading gains so I may enter a trade as & when I find a good risk-reward opportunity.
So my intent was to know the likely range that it may offer should I decide to buy TCS.
WORKING
In my view, a company that opts for buy-back of shares is either trying to compensate the shareholders from the available surplus or it may be willing to consolidate its own position as it expects improved performance in the coming periods. It could also be for both the reasons. In reality, I am not affected by their reason as long as the price offered is at a better premium than the ruling price. This will motivate me to stay put with my holdings and or induce me to initiate a new trade.
My work to arrive at the price was done a day ahead of the announcement and for those who may be quick to think that what is the point in writing the article post-facto, I have pasted a link to the video where I have stated the price range that may be used for arriving at the buy-back price.
On 11-1-21, TCS closed above 3900 so I kept 3900 as the base and did the following:
Case 1
The offer price could be at a premium of 10% to the ruling price.
So, 3900*1.10 = 4290 so I rounded-off to 4300.
Case 2
The offer price could be at a premium of 15% to the ruling price.
So, 3900*1.15 = 4485 so I rounded-off to 4500.
The reason for 10% is that it is a good enough incentive to the shareholders to tender the shares and is more than the returns that a debt instrument would give.
The reason for 15% is that the company may want to top up the premium with a hidden component of dividend which is otherwise taxable.
My conclusion was that TCS may offer the buy-back within this range with 4500 being the cap as I felt anything more would mean that the company may be doing social service than rewarding its shareholders.
My reading was that the shares would in any case not cross 4000 immediately as TCS has the tendency to go sideways to negative post results and as the time elapses from the result release, it goes down if the sentiment is not positive.
CONCLUSION
Since I have some holdings in TCS, I am happy that a part of that would be tendered at the final price that the company may announce .
I now have a range of 600 points from 3900 to 4500 which is available for me to decide about trading the scrip subject to the right set-up and more importantly funds availability.
I am now encouraged to test the approach for such announcements that the other companies may make.
Here is the link to the video:
youtu.be
I would be happy to read your feedback.
Thank you,
Umesh
13-1-22
Not SEBI Regd.
Shared for the purposes of Educational & Informational purposes only.

Nifty ends above 18200, Bank Nifty held back by HDFC BankNIFTY 50 EOD ANALYSIS 12-1-22
In this post, I talk about the analysis for the day and the trading range for tomorrow. The video discusses with the help of the charts how the indices as well as leading stocks performed during the day and their likely play tomorrow.
O 18170.40
H 18227.95
L 18128.80
C 18212.35
EOD +156.60 points / +0.87%
SGX Nifty 12-1-22 @ 1915h = +77
FII DII = +330 Crores
CHART BASED CONCLUSIONS using 5 Minutes Chart
Nifty opened with a 100+ point gap up and wobbled a bit but then made steady progress throughout the day with some choppiness.
The leading scrips of Nifty as well as Bank Nifty,were quite volatile which made it hard for the indices to move up consistently.
Nifty managed to close above 18200 with a slight drop in the India Vix.
The indices have made higher highs and higher lows.
NIFTY WEIGHT LIFTERS & DRAGGERS
Top 5 Lifters contributed = 109
Top 5 Draggers contributed = 34
Net = +75
BANK NIFTY WEIGHT LIFTERS & DRAGGERS
Top 3 Lifters contributed = 289
Top 3 Draggers contributed = 94
Net = +189
POSITIVES
Reliance, ICICI Bank, Infosys, and Kotak Bank helped the indices rally.
Reliance closed above 2500.
NEGATIVES
Underperformance by HDFC Bank and TCS.
HDFC was unable to sustain above 2750 and went sideways.
FIIs are back in sell mode with 1,002 Crores.
TRADING RANGE FOR 13 JAN 22
Nifty support = 17800-17900
Nifty resistance = 18250-300-400
Bank Nifty Support = 37200-500
Bank Nifty resistance = 38800-900-39000-39200
INSIGHTS / OBSERVATIONS
Nifty OHLC was above 18100 - in fact, above 18100. The last time it happened was on 15-11-21, so it took almost 2 months for the Index to circle back. Any move upwards from here would mean resumption of the uptrend which was given up from 16-11-21.
And Bank Nifty made another day in a row above 38000 as far its OHLC levels are concerned. Today’s low was 38600+ so it is a very good sign.
However, when looking at a granular level, Bank Nifty could manage to close 8 points above the opening price level. Bank Nifty moved in a narrow range drifting on the downside. HDFC Bank held it back forcibly as it came down 1%+ from the day high.
TCS was very nervous ahead of its results so its reaction to the results is going to be quite interesting in the opening hour. I think after a long time 3 IT companies from Nifty 50 would see the market reaction on the same day following the release of its quarterly results. So Nifty may go all over and the moves could be wild and volatile.
What do you feel about this?
Here is the link to the video:
youtu.be
Thank you, and Happy Money Making!
Umesh
12-1-22
Not SEBI registered
The post is for educational & informational purposes only.
---

My thoughts on TCS Buy Back priceIn this vide I talk about what is the price at which I would like to offer shares to TCS under the proposed buy back offer which is to be discussed in tomorrow's board meeting.
Please let me know your view.
Thank you,
Umesh

TCS CUP & Handle Inverted H&S Forming in Long Term PerspectiveTCS CUP & Handle Inverted H&S Forming in Long Term Perspective
IF TCS Breakout this Cup & Handle Next it will from the inverted Head & Shoulder it Will reach 4500 as Target

Nifty batting 18003, Bank Nifty 38347. Will this rally sustain?NIFTY 50 EOD ANALYSIS 10-1-22
In this post, I talk about the analysis for the day and the trading range for tomorrow. The video discusses with the help of the charts how the indices as well as leading stocks performed during the day and their likely play tomorrow.
O 17913.30
H 18017.45
L 17879.15
C 18003.30
EOD +190.60 points / +1.07%
SGX Nifty 10-1-22 @ 1905h = -42
FII DII = Not yet available
CHART BASED CONCLUSIONS using 5 Minutes Chart
Nifty opened with a gap-up of 100 points and after the initial hesitation and break of the opening low, it resumed its journey on the way up.
It then faced resistance around 17960-70 and then made another attempt to cross the level and failed and fell back to 17900 zone and then just before noon, it made a steady yet choppy ride up the ladder.
Nifty closed above 18000 and has now broken the great resistance at 18000.
The indices have made higher highs and higher lows.
NIFTY WEIGHT LIFTERS & DRAGGERS
Top 5 Lifters contributed = 103
Top 5 Draggers contributed = 17
Net = +86
BANK NIFTY WEIGHT LIFTERS & DRAGGERS
Top 3 Lifters contributed = 437
Top 3 Draggers contributed = 01
Net = +436
POSITIVES
Nifty closed above 18000 and Bank Nifty well above 38200.
Infosys regained its positivity and led from the front.
It is also good to see HDFC managing to stay well above 2600 and helping Nifty gain steadily.
ICICI Bank, SBIN, and Kotak Bank lifted Bank Nifty yet again.
NEGATIVES
TCS fell 100 points from its opening high.
India Vix has not yet cooled down despite the indices going up so strongly.
Reliance barely managed to stay positive and this could prove to be a worrisome scrip.
TRADING RANGE FOR 10 JAN 22
Nifty support = 17600-700
Nifty resistance = Every 50 points
Bank Nifty Support = 36800-37000
Bank Nifty resistance = 38500-38700-39000
INSIGHTS / OBSERVATIONS
The underlying tone of the indices was very strong as Nifty low was 60+ points above the close of 7-1. Likewise, Bank Nifty low was almost 200 points above the close of 7-1-. These two levels would now act as important supports and the gap between the two would attract the indices as and when there is some sort of profit booking or compliance with the global cues.
On the back of a buy-back offer, TCS made an opening high of 3979 and then lost 100 points and ended the day at 3879. So the euphoria was over and those who had the news already banked gains and brought down the scrip to level.
It is a bit surprising that the indices have ignored the negative sentiment in FTSE and closed on a very strong note. To some extent, this is worrisome as well. If and when they correct, that is likely to be sharp and quick.
Even the domestic cues on the Covid front are not encouraging and India Vix has also not cooled down, yet even sensitive scrips like IRCTC, IndiGo, and Inox Leisure have performed well. This in a way is a good sign as long as it indicates the ability of these companies to weather the adverse impacts.
What do you feel about this?
Here is the link to the video:
youtu.be
Thank you, and Happy Money Making!
Umesh
10-1-22
Not SEBI registered
The post is for educational & informational purposes only.
---

TCS LongShall be adding position on TCS once LL LH structure gets broken due to:
1. Near CIP zone.
2. Channel support area.
3. RSI divergence
Please trade according to your knowledge. I am not a SEBI register expert. This is just for educational purposes

TCS on dip, opportunity for investorsTcs is currently on strong support levels,
It is an opportunity for all investors who are waiting for investment in tcs,
3460 is strongest support on the chart and rounding bottom is also formed.

#TCS Potential breakout towards Weekly channel top#TCS Potential breakout towards channel top
This IT sector stock has been moving in a weekly trendline channel and had done an wedge pattern breakout back in august
Post which it had a pullback to channel bottom and now it seems to be heading back to channel to again by way of potential
Breakout from a previous resistance zone.Positional entry above a confirmation candle above the resistance 3990 levels
Could give good swing trading opportunities atlas till channel top .The FIB extension indicate possible targets upto 4350 if
Breakout sustains. The stop loss should alert candle of breakout above resistance low.

TCS HEAD & ShoulderNSE:TCS TCS is forming H&H pattern. It is good to trade it. Volume is also buyer baised we can trade it after breaking of neckline or sell below piviot point if unable to break. consider nifty also while trading

TCS - Buy a Good Stock on Bad Day / Slowly build positionsBuy a Good Stock on a Bad Day. / Slowly add at every support level and build positions. (20%+20%+30%+30%)
Scrip: TCS
Enter: This is an investment idea for medium term to long term horizon. Slowly build positions in the support zones over a period.
Support & Entry levels for building positions - 3720,3400, 3150, 2880 (in case market sell-offs happen)
The stock is a market leader, segment leader and Fundamentally very strong company. A TATA group enterprise.
Please note: I am not a SEBI registered Investment Advisor. Please invest and trade based on your knowledge and risk profile.

#BANKNIFTY BY @ayushsaini123#we make only profit.
# wait 30 min to enter.
#down open than wait for 2nd candle if its go down than set stop loss on 2nd candle high and buy put
#If you need any help comment or message me.

#BANKNIFTY FOR 3 DAYS...💲👑#we make only profit.
#I publish this chart also check my next post.
#If you need any help comment or message me.

Bank Nifty roars, so does India Vix. What Next?NIFTY 50 EOD ANALYSIS 5-1-22
In this post, I talk about the analysis for the day and the trading range for tomorrow. The video discusses with the help of the charts how the indices as well as leading stocks performed during the day and their likely play tomorrow.
O 17820.10
H 17944.70
L 17748.85
C 17925.25
EOD +120.00 points / +0.67%
SGX Nifty 5-1-22 @ 1830h = -8
FII DII = Not yet available
CHART BASED CONCLUSIONS using 5 Minutes Chart
Nifty opened flat and then there was a mini sell-off as it tried to trade above the previous close. However, it found support around 17750 and then moved up a 100+ points and found resistance around 17850 and was back to 17800.
It then never looked back and made a steady climb to hit the day high and close just below the level and above 17900.
Both the indices have made higher highs and higher lows which is a good sign.
NIFTY WEIGHT LIFTERS & DRAGGERS
Top 5 Lifters contributed = 99
Top 5 Draggers contributed = 45
Net = +54
BANK NIFTY WEIGHT LIFTERS & DRAGGERS
Top 3 Lifters contributed = 606
Top 3 Draggers contributed = 00
Net = +606
POSITIVES
Bank Nifty has closed comfortably above 37000.
Nifty ended the day despite pressure from IT leaders and HDFC, above 17900.
Bullishness in Banking & Finance scrips was strong.
FIIs have bought in excess of 1,200 Crores.
NEGATIVES
IT leaders dragged Nifty - Infosys in particular which was a negative yesterday as well.
Spike in India Vix as it closed above 17.
TRADING RANGE FOR 05 JAN 22
Nifty support = 17400-500
Nifty resistance = 17950-18000-18100
Bank Nifty Support = 36000-200
Bank Nifty resistance = 37800-38000-200
INSIGHTS / OBSERVATIONS
The most surprising fact of the day was that India Vix has roared along with Bank Nifty. It is an uncommon occurrence and is signaling that there is panic setting in at higher levels. Could this be on account of the rising Covid related uncertainties?
Nifty underperformed Bank Nifty on account of Infosys, TCS, and HDFC. The good thing is that the higher low of Nifty is now 150+ points above. This indicates the underlying bullishness at lower levels.
Bank Nifty made a bounce of 1100 points from the day low which is good and that is the reason why it was able to outperform Nifty today. The top 3 leaders contributed 600+ of these indicating that the index wide bullishness was good.
Of the top 5 draggers of Nifty, the first 4 are from the IT pack. And all the top 5 lifters of Nifty are from Banking & Finance. So it was Banking & Finance Vs IT.
What do you feel about this?
Here is the link to the video:
youtu.be
Thank you, and Happy Money Making!
Umesh
5-1-22
NOTE --
This write-up is not a prediction mechanism for the movement of Indices in the Indian markets as the markets are unpredictable in nature. I may refer to many data points in the article but I do not base my view on any of these standalone. In fact, I prefer to react to the price moves than predict the price moves. I also do not review Open Interest. Whatever data points I am using, are all stated in the article. The article title, as well as its contents, can at best be stated as --- This Is How I Read Nifty. I hope I have been able to set the expectations right.
---

Why are trade exits more important than the ExtriesIn this video, I explain how myself and KR exited partially in Infosys as well as TCS earlier this week.
I hope this video helps.
Best wishes,
Umesh
5-1-22
