TCS

BREAKOUT IN TCS Formed a kind of rising wedge pattern and we can see a very bullish breakout.
Wait of it to retest 3440 and may be 3400 level , then we can see a very good up move.
PLease do your analysis and if you have any idea please tell me in the comments

TCS: Fresh breakoutTCS has given a fresh breakout. Wait for confirmation and one can try to go long with proper Risk Reward.

TCS - High Probablity trade - Upto 20% UpsideSelf Explanatory Chart. This is a volatility contraction pattern.
Can expect a minimum of 20 % upside for such heavy-weight stock in Nifty.


TCS - Bullish breakout from channel pattern🔴DISCLAIMER
***** It's just for an educational purpose and so you must also follow your own technical analysis before taking up the trade ******
Aggressive traders enter at the breakout and conservative traders may give entry after retracement (Retracement is optional, we cannot expect every stock to take a retest after the breakout, it may also continue to have its bullish pressure after the breakout)
After reaching our targets, trail your stop loss to get maximum profit from the stock in a single trade
Comments

Nifty Soars to 16529 - yet another ATH Close!NIFTY 50 EOD ANALYSIS -13-08-21
IN SUMMARY
O / H / L / C
16385.7 / 16543.6 / 16376.3 / 16529.1

TCS WEDGE BREAKOUTRecent breakout shows rising wedge break in the chart. can go long for the given targets. good stock to hold for long term as well.
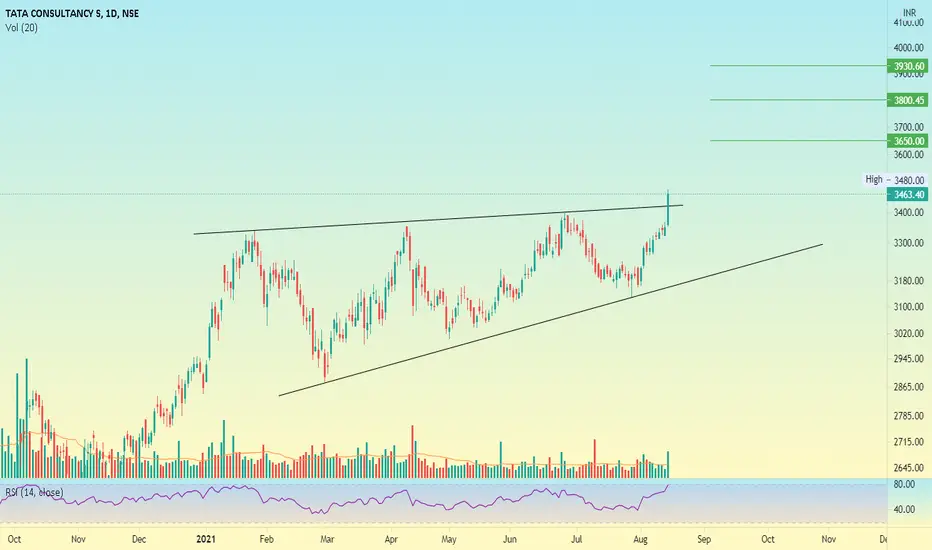
tcs chart analysistcs chart analysis for intraday and swing trading. tcs breaks trend line with volume.


TCS giving a breakout TCS giving a breakout from rising triangle pattern, wait for confirmation and take entry (This is only for educational purpose #dyor #nfa)

TCS - Retest on charts, maybe !While Friday was really amazing, Nifty IT seems to touch it Max Limit trend line resistance. May be its imaginary and may be Nifty IT makes a new high and a new resistance but seems movement will come in other sectors after Nifty IT gets rejected at the red line.
Please see my Nifty IT analysis which I just posted on trading view - apparently, I cannot post link here (SAD)
So TCS made a fantastic move and what a classic chart pattern BO. It’s just when things are so obvious that too a weekend to give everyone time to think, smart money will do something smart.
One reason to go bullish is further lockdowns across the globe and focus back to IT and WFM but all that is factored in.
If the BO sustains, we are looking at quick 4000 + targets. I am not too convinced. I will focus on other sectors, Banks nahi chale hain bahut time se, may be banks ... who knows!
*I am a newbie trader, this is for pure educational purpose analysis, please trade your hard-earned money on a registered stock market opinion :)


TCS: Breakout of a Rising Wedge FormationTCS gave a fresh breakout of a Rising Wedge Formation in the daily chart with the spike in volume.

TCS breakout - Stage 2 Advance TCS confirmed breakout on weekly closing basis.
- Breakout after good consolidation zone.
- Stock in Stage 2 continuation uptrend.
- Giving a good opportunity to add.
Only for educational purpose. Not a recommendation.

TCS Swing trade - Learn to capture such moves This is simply an educational video, starting from the basis of entry till the exit point of one really good setup based only on price action and price reading


TCS for a swingTCS has given a breakout of a good trendline with a strong move and volume. It can give a good target as IT sector is also looking good.
COMMENT down your views.

TCS Huge BreakoutTCS beautifully closing above TL breakout. Trading at ATH.. Looks good for swing entry now.

TCS (Swing)TCS broke a good pattern with great volume , can find a good entry here for a positional trade, ENTRY 3460, STOP LOSS 3297, TARGET 3700

TCS has broken it's life time high. Congratulations!NSE:TCS has broken it's life time high today with good volumes. Great thing for the investors who have TCS on lower levels.

TCS DAILY FRAME BREAKOUTTCS has given a nice breakout with a huge candle and is going to ride around 10% from now so the breakout is very good and target would be achieved in around 2 months.

TCS TCS has moved in a range from past some days. If it breaks the chanell with good volume we can see a good up move.
