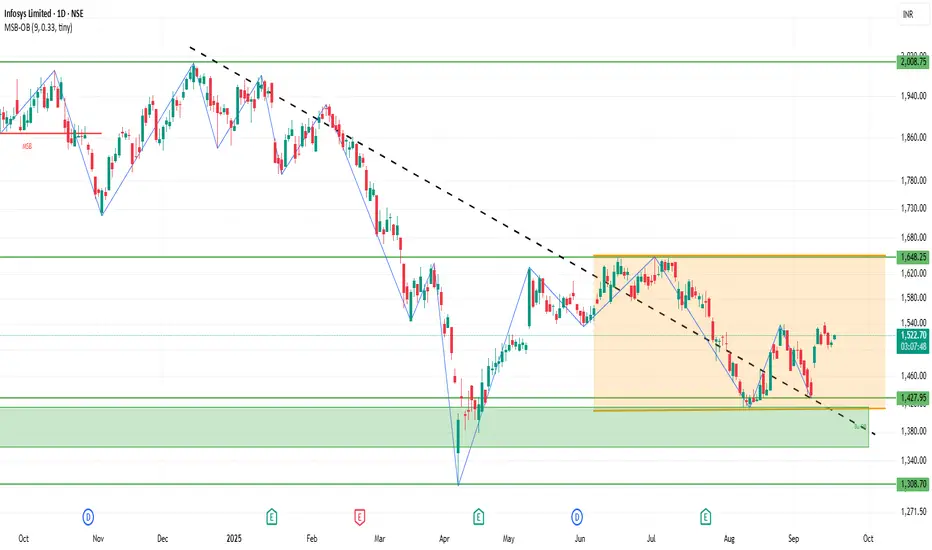
INFY 1D Time frameCurrent Stock Price
Current Price: ₹1,525.60
Day’s Range: ₹1,521.10 – ₹1,542.90
52-Week Range: ₹1,307.00 – ₹2,006.45
Market Cap: ₹6.33 lakh crore
P/E Ratio (TTM): 23.0
EPS (TTM): ₹65.63
Dividend Yield: 2.82%
Book Value: ₹230.65
📈 Trend & Outlook
Short-Term Trend: Bullish; the stock is trading near its 52-week high, indicating strong investor confidence.
Resistance Levels: ₹1,542.90 (day’s high), ₹2,006.45 (52-week high).
Support Levels: ₹1,521.10 (day’s low), ₹1,500.00 (psychological support).
Investor Sentiment: Positive, with strong institutional interest and favorable analyst outlooks.
🧭 Analyst Insights
Valuation: The stock is trading at a P/E ratio of 23.0, which is below the sector average of 28.56, suggesting potential value.
Growth Prospects: The company’s strong earnings growth and robust capital position support its premium valuation.
TCS
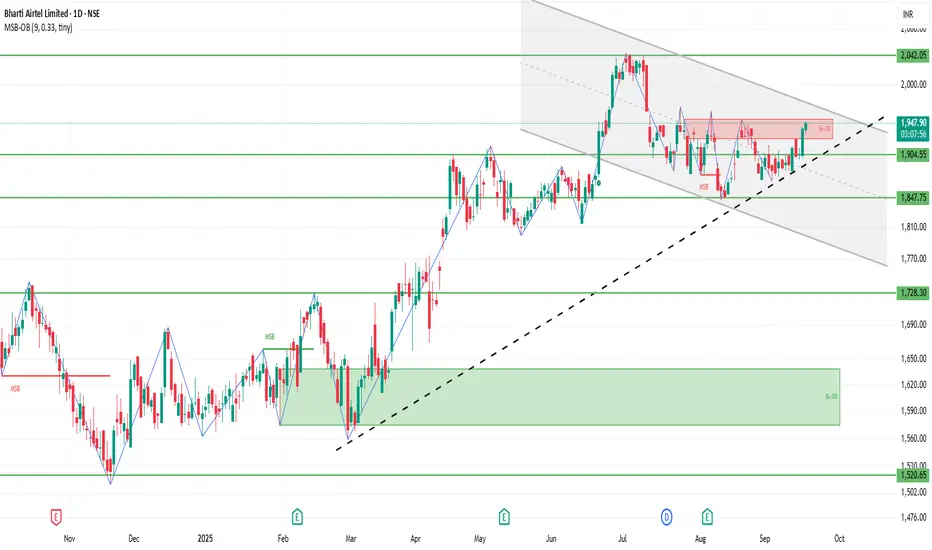
BHARTIARTL 1D Time frameCurrent Stock Price
Current Price: ₹1,944.50
Day’s Range: ₹1,933.25 – ₹1,944.85
52-Week Range: ₹1,510.80 – ₹2,045.80
Market Cap: ₹11.63 lakh crore
P/E Ratio (TTM): 31.89
EPS (TTM): ₹60.94
Dividend Yield: 0.82%
Book Value: ₹150.17
📈 Trend & Outlook
Short-Term Trend: Bullish; the stock is trading near its 52-week high, indicating strong investor confidence.
Resistance Levels: ₹1,944.85 (day’s high), ₹2,045.80 (52-week high).
Support Levels: ₹1,933.25 (day’s low), ₹1,910.00 (psychological support).
Investor Sentiment: Positive, with strong institutional interest and favorable analyst outlooks.
🧭 Analyst Insights
Valuation: The stock
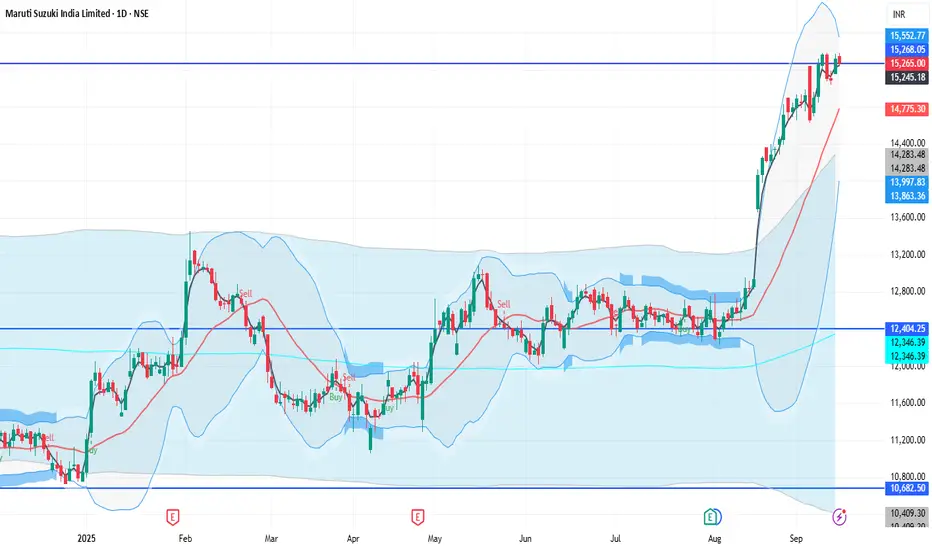
MARUTI 1D Time frame📊 Price Levels
Current Price: Around ₹15,265
Day’s High: ~₹15,378
Day’s Low: ~₹15,249
52-Week High: ~₹15,384
52-Week Low: ~₹10,725
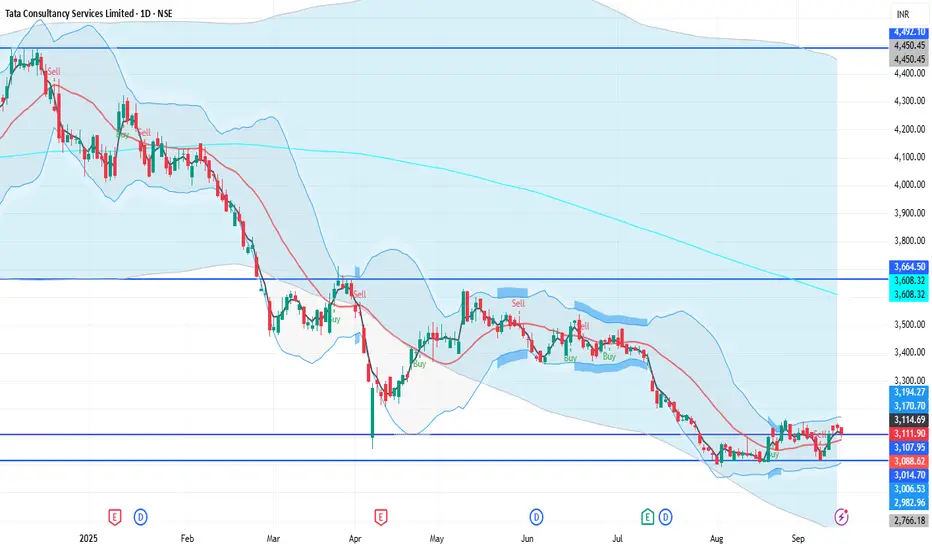
TCS 1D Time framePrice Action
Current Price: ₹3,111.60
Previous Close: ₹3,124.20
Day’s Range: ₹3,096 – ₹3,134
52-Week Range: ₹2,991.60 – ₹4,546.05
🔹 Support & Resistance
Support 1: ₹3,096
Support 2: ₹3,050 – ₹3,060
Resistance 1: ₹3,134
Resistance 2: ₹3,150 – ₹3,160
LT 1D Time frameCurrent Price
₹3,600.70
🔹 Market Snapshot
Day’s Range: ₹3,575.50 – ₹3,607.00
Previous Close: ₹3,579.80
52-Week Range: ₹2,965.30 – ₹3,963.50
Market Cap: ₹4.95 lakh crore
P/E Ratio (TTM): 31.91
P/B Ratio: 5.68
Dividend Yield: 0.94%
EPS (TTM): ₹112.82
Book Value per Share: ₹634.43

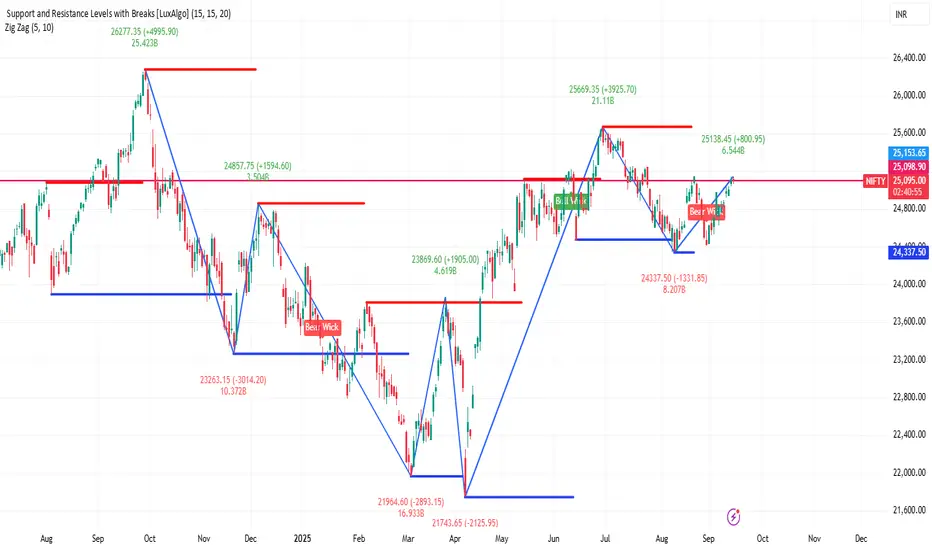
NIFTY 1D Time frameCurrent Price: ~25,085
Day’s Low: 24,900
Day’s High: 25,138
🔹 Support & Resistance (based on today’s range)
Support 1 (S1): 24,950 – 24,925
Support 2 (S2): 24,900 – 24,875
Resistance 1 (R1): 25,120 – 25,138
Resistance 2 (R2): 25,150 – 25,180
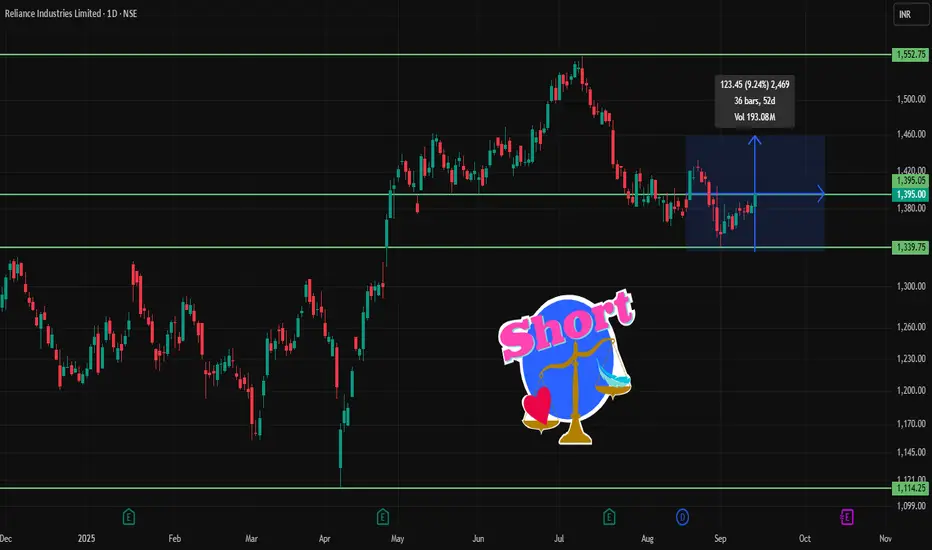
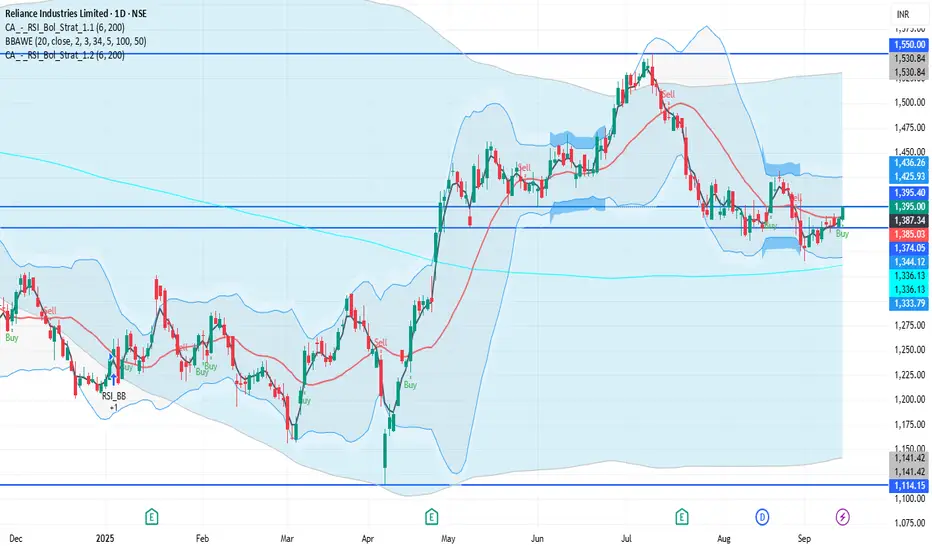
RELIANCE 1D Time frameCurrent Price & Trend
Trading around ₹1,395
Price is below many of its short- to medium-term moving averages (50-day, 100-day), suggesting resistance in that zone.
Indicators & Momentum
Relative Strength Index (RSI) is in mid-range → neither overbought nor oversold, leaning neutral.
MACD is weak to mildly bearish in daily view.
Volume has shown mixed behaviour; resistance zones are not being convincingly broken.
Trend strength indicators show some weakening or caution among buyers.
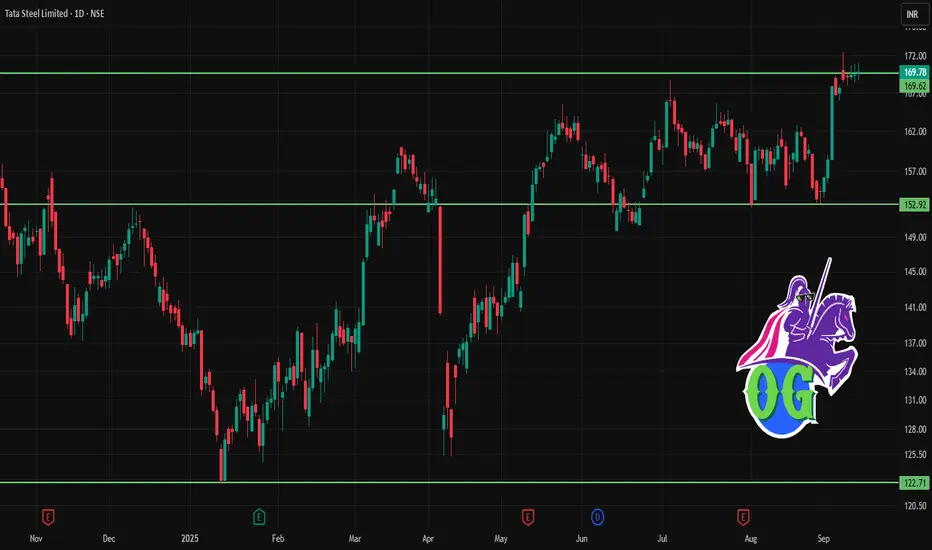
TATASTEEL 1D Time frameCurrent Price & Trend
Current Level: ₹169
Trend: Neutral to slightly bullish → stock is consolidating near support.
Momentum: Price is holding above strong support, but resistance is close.
RSI: Around 55 → neutral, leaning positive.
MACD: Flat to mildly bullish.
Moving Averages: Price is hovering around 20-day average; still above 50-day average → medium-term strength intact.
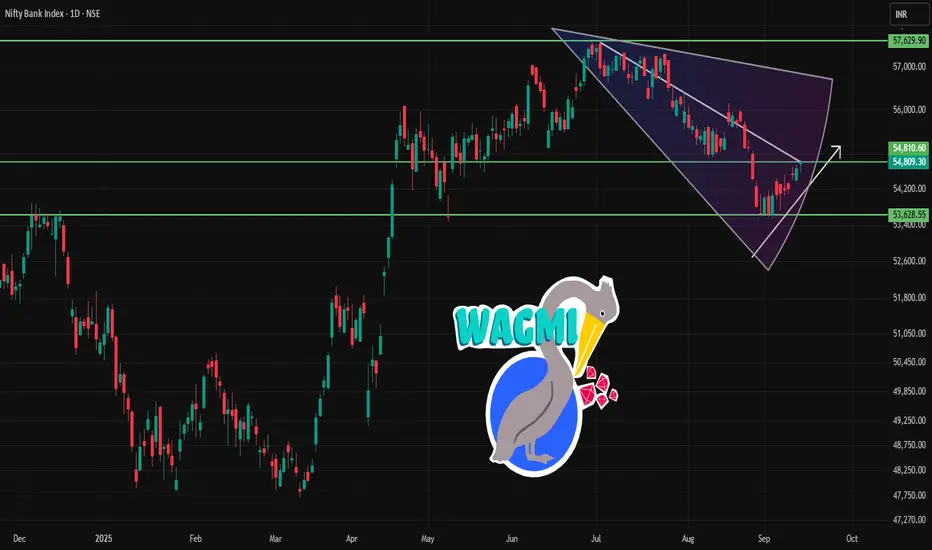
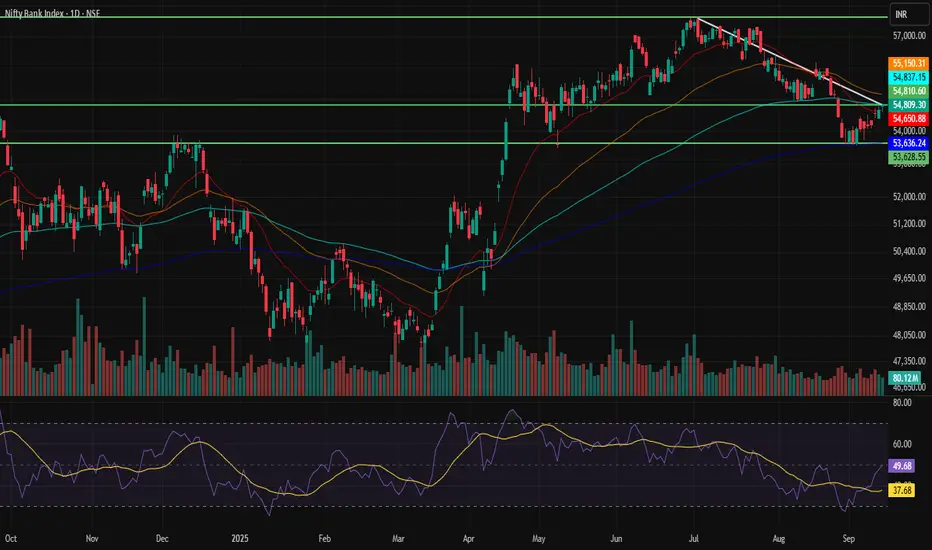
BANKNIFTY 1D Time frameCurrent Price & Trend
Current Level: 54,809
Trend: Neutral to mildly bullish
Range Context: Close to resistance zone, so movement here is crucial
Bullish Case
If Bank Nifty closes above 55,000–55,200, it can rally toward 55,500–55,700.
Sustained buying could push further toward 57,000 in coming sessions.
RELIANCE 1D Time frameCurrent Price & Trend
Price: ₹1,395.00
Trend: Neutral to mildly bullish; trading approximately 10.1% below its 52-week high of ₹1,551.00, achieved on July 9, 2025.
Momentum: Indicators suggest a neutral to slightly bullish outlook.
Bullish Scenario
Breakout Above ₹1,396: A sustained move above ₹1,396 could target ₹1,400 – ₹1,420 in the short term.
KOTAKBANK 1D Time frameCurrent Price & Trend
Price: ₹1,972.30
Trend: Neutral; trading approximately 14.3% below its 52-week high of ₹2,301.90, reached on April 22, 2025.
Momentum: Indicators suggest a neutral to slightly bearish outlook.
Bullish Scenario
Breakout Above ₹1,990: A sustained move above ₹1,990 could target ₹2,000 – ₹2,020 in the short term.

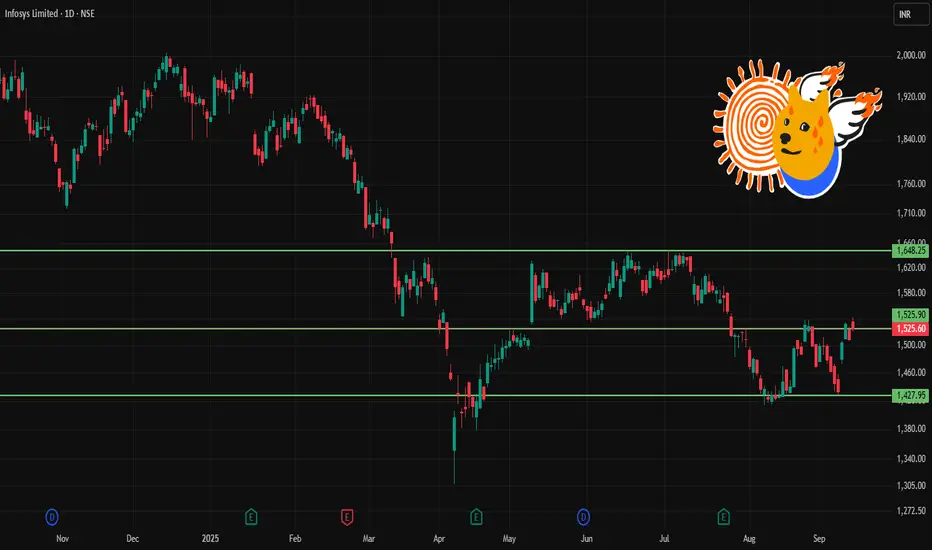
INFY 1D Time frame📉 Current Market Snapshot
Current Price: ₹1,525.60
Previous Close: ₹1,509.70
Day's Range: ₹1,521.10 – ₹1,542.90
52-Week High: ₹2,006.45
52-Week Low: ₹1,307.00
Market Cap: ₹6,33,794 crore
P/E Ratio: 23.0
Dividend Yield: 2.82%
ROE: 28.72%
Debt-to-Equity Ratio: 0.09
Beta: 1.11
EPS (TTM): ₹65.63
Face Value: ₹5.00
VWAP: ₹1,529.86
Volume: 12,856,963 shares
ATR (14): ₹5.72
MFI: 71.75
BANKNIFTY 1D Time frame🔢 Current Level
Trading near ₹54,809
🔑 Key Resistance & Support Levels
Resistance Zones:
~ ₹55,000 – ₹55,200 (immediate resistance)
~ ₹55,500 – ₹55,700 (stronger resistance above)
Support Zones:
~ ₹54,500 – ₹54,600 (first support)
~ ₹54,200 – ₹54,300 (secondary support)
~ ₹53,800 – ₹54,000 (deeper support if selling extends)
📉 Outlook
Bullish Scenario: A close above ₹55,000 may trigger momentum toward ₹55,500+.
Bearish Scenario: A slip below ₹54,500 could drag price toward ₹54,200 or even ₹53,800.
Neutral / Range: Between ₹54,500 – ₹55,200, sideways movement likely until a breakout.
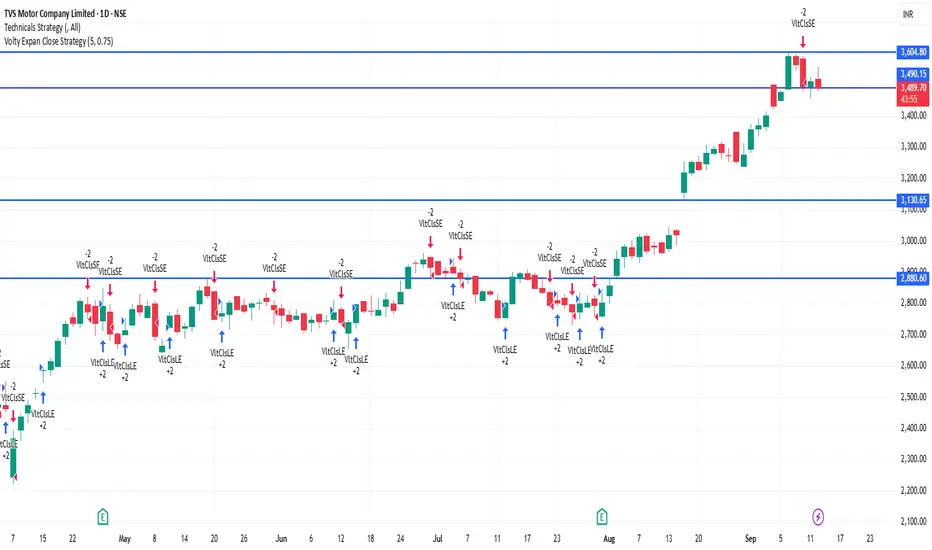
TVSMOTOR 1D Time frame🔢 Current Level
Trading around ₹3,490 – ₹3,526
🔑 Key Resistance & Support Levels
Resistance Zones:
₹3,550 – ₹3,556 (near-term resistance; breakout above this may lead to further upside)
₹3,600 (psychological resistance)
₹3,650 (stronger resistance above)
Support Zones:
₹3,510 – ₹3,520 (immediate support; failure to hold above this may lead to a decline)
₹3,480 – ₹3,490 (short-term support; a break below this could indicate weakness)
₹3,400 – ₹3,450 (deeper support zone if price dips further)
📉 Outlook
Bullish Scenario: If TVS Motor holds above ₹3,520, upward momentum may continue. Break above ₹3,556 can open the way toward ₹3,600+.
Bearish Scenario: If it falls below ₹3,480, risk increases toward ₹3,400 – ₹3,450.
Neutral / Range: Between ₹3,520 – ₹3,556, TVS Motor may consolidate before a directional move.
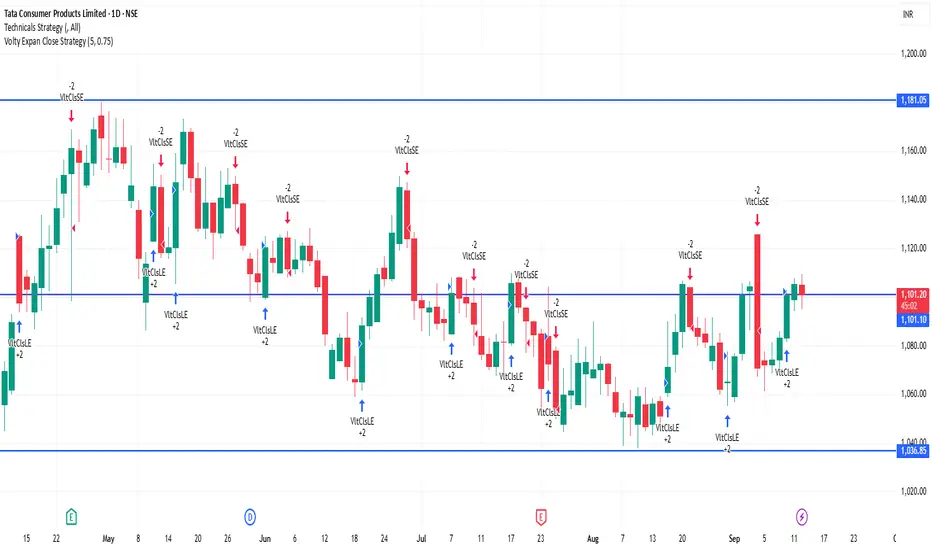
TATACONSUM 1D Time frame🔢 Current Level
Trading around ₹1,101.30
🔑 Key Resistance & Support Levels
Resistance Zones:
₹1,110 – ₹1,115 (recent highs; breakout above this may lead to further upside)
₹1,120 (psychological resistance)
₹1,130 – ₹1,140 (stronger resistance above)
Support Zones:
₹1,095 – ₹1,100 (immediate support; failure to hold above this may lead to a decline)
₹1,085 – ₹1,090 (short-term support; a break below this could indicate weakness)
₹1,070 – ₹1,080 (deeper support zone if price dips further)
📉 Outlook
Bullish Scenario: If Tata Consumer holds above ₹1,100, upward momentum may continue. Break above ₹1,115 can open the way toward ₹1,120+.
Bearish Scenario: If it falls below ₹1,085, risk increases toward ₹1,070 – ₹1,080.
Neutral / Range: Between ₹1,100 – ₹1,115, Tata Consumer may consolidate before a directional move.
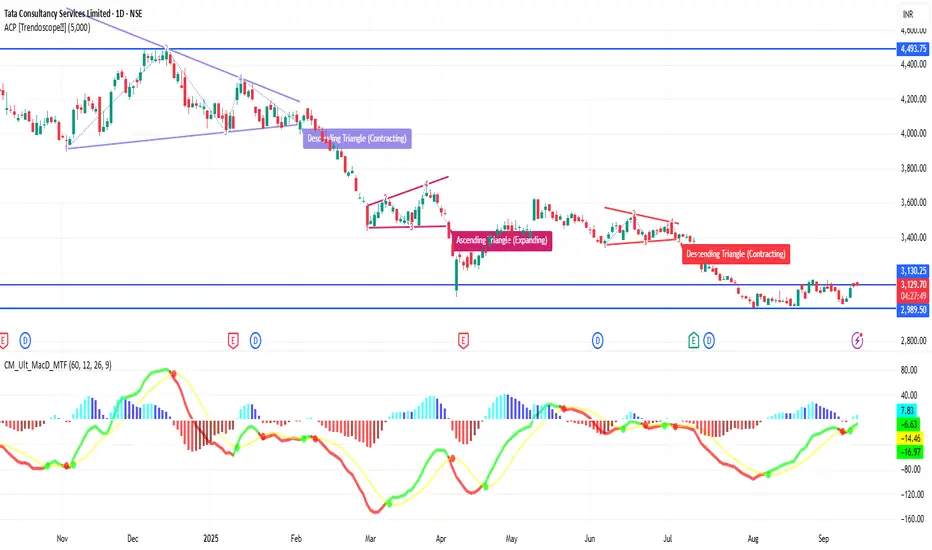
TCS 1D Time frame🔢 Current Level
Trading around ₹3,125 – ₹3,135
🔑 Key Resistance & Support Levels
Resistance Zones:
₹3,138 – ₹3,153 (near-term resistance; breakout above this may lead to further upside)
₹3,167 (stronger resistance above)
Support Zones:
₹3,095 – ₹3,110 (immediate support)
₹3,080 (stronger support if price dips further)
₹3,050 – ₹3,060 (deeper support zone)
📉 Outlook
Bullish Scenario: If TCS holds above ₹3,110, upward momentum may continue. Break above ₹3,153 can open the way toward ₹3,167+.
Bearish Scenario: If it falls below ₹3,080, risk increases toward ₹3,050.
Neutral / Range: Between ₹3,110 – ₹3,153, TCS may consolidate before a directional move.
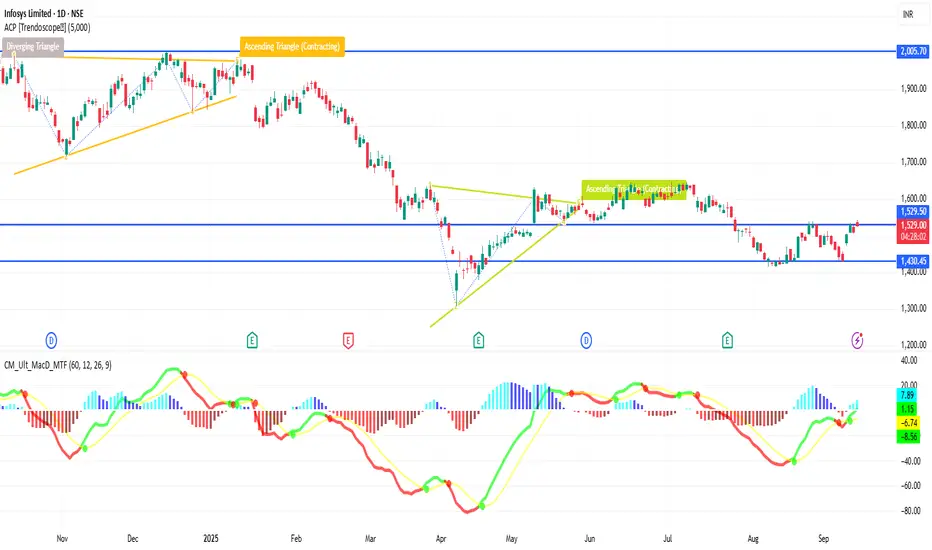
INFY 1D Time frame🔢 Current Level
INFY is trading around ₹1,510 – ₹1,529
🔑 Key Resistance & Support Levels
Resistance Zones:
₹1,518 – ₹1,520 (near-term resistance; breakout above this may lead to further upside)
₹1,530 (stronger resistance above)
Support Zones:
₹1,484 – ₹1,485 (immediate support)
₹1,481 (stronger support if price dips further)
₹1,470 – ₹1,472 (deeper support zone)
📉 Outlook
Bullish Scenario: If INFY holds above ₹1,485, upward momentum may continue.
Breakout Scenario: A move above ₹1,520 can open the way toward ₹1,530+.
Bearish Scenario: If it falls below ₹1,481, risk increases toward ₹1,470 – ₹1,472.
BANKNIFTY 1D Time frame📊 Current Snapshot
Current level: around 54,680 - 54,690
Today’s range: approx. 54,580 – 54,850
🔑 Key Daily Levels
Resistance Zones
54,960 (near-term resistance)
55,172 (major resistance; breakout above this could extend rally)
55,000 (psychological resistance)
Support Zones
54,462 (immediate support)
54,400 – 54,500 (important support band)
54,107 (deeper support if selling pressure continues)
📉 Outlook
Bullish Case: If Bank Nifty sustains above 54,960 – 55,172, it can move higher towards 55,300 – 55,500.
Bearish Case: If it breaks below 54,400, the index may slip toward 54,100 or even lower.
Neutral / Range: Between 54,400 – 54,960, sideways movement is likely until a breakout occurs.

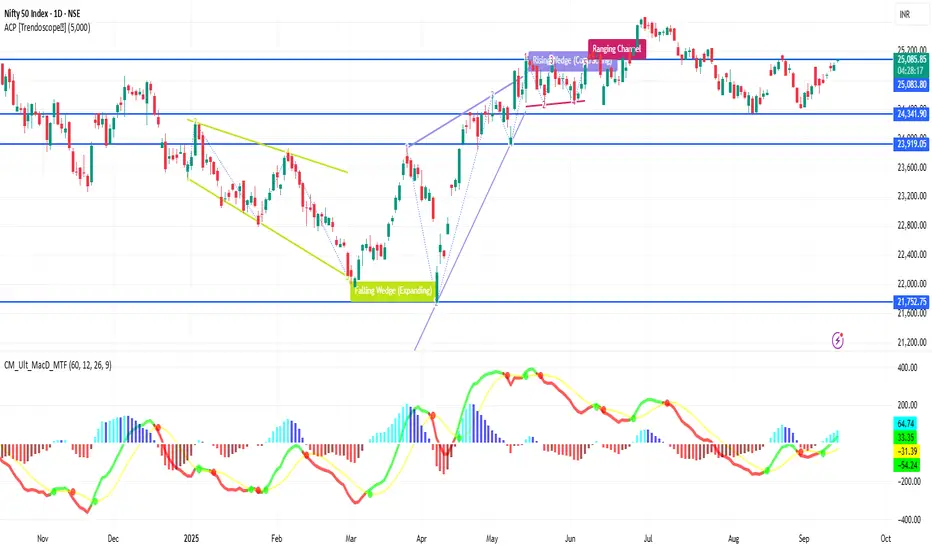
NIFTY 1D Time frame📊 Current Data
Current trading level: around 25,076 – 25,091
Today’s range: approx. 25,038 – 25,095
52-week range: 21,743 – 26,277
🔑 Key Daily Levels
Resistance Zones
25,090 (near-term resistance just above current trading)
25,153 (recent swing high, major resistance level)
Support Zones
24,994 – 24,950 (immediate support range)
24,800 (strong support zone; crucial for trend continuation)
📉 Trend View
Bullish Case: If NIFTY sustains above 25,090 and breaks 25,153, it could push higher towards 25,200+.
Bearish Case: If it fails to hold 24,950–24,994 and slips below 24,800, downside momentum could strengthen.
Neutral Zone: Between 25,000 – 25,050, NIFTY may consolidate before deciding direction.
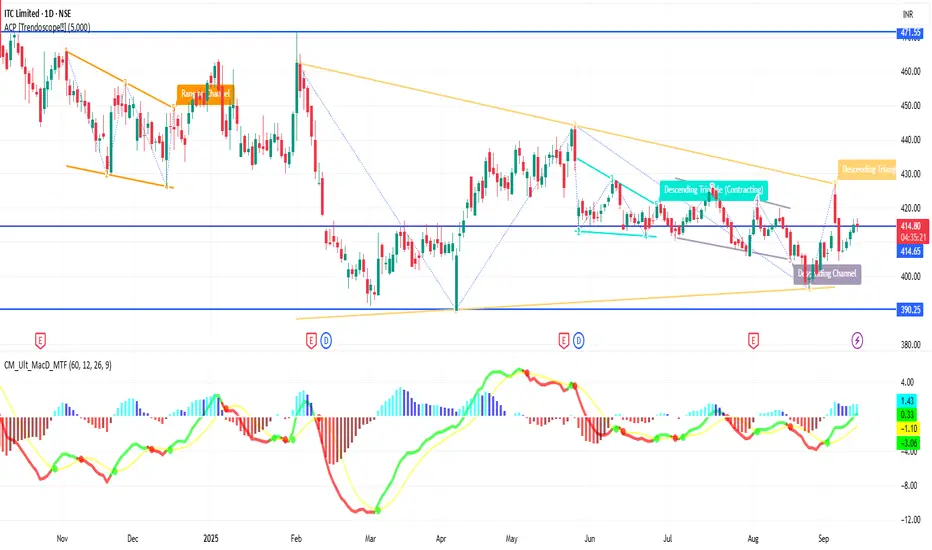
ITC 1D Time frame🔢 Current Level
Trading around ₹414 – ₹432
🔑 Key Resistance & Support Levels
Resistance Zones:
₹435 – ₹438 (near-term resistance; breakout above this may lead to further upside)
₹442 (stronger resistance above)
Support Zones:
₹425 – ₹428 (immediate support)
₹420 (stronger support if price dips further)
₹415 – ₹417 (deeper support zone)
📉 Outlook
Bullish Scenario: If ITC holds above ₹428, upward momentum may continue. Break above ₹438 can open the way toward ₹442+.
Bearish Scenario: If it falls below ₹420, risk increases toward ₹415 – ₹417.
Neutral / Range: Between ₹428 – ₹438, ITC may consolidate before a directional move.
F&O Watchlist – Stocks with Action👋 Hello Traders!
Welcome to the Daily Options Trade Setup & Watchlist – 12th Sept 2025 🚀
The market is showing strong activity today with fresh long build-ups, surging volumes, and supportive OI data across key F&O names. Volatility remains balanced, creating opportunities for traders to ride the momentum while keeping risks in check.
This watchlist highlights stocks where data and trend are aligning, giving us a clearer picture of market sentiment and possible trading setups.
Let’s explore today’s opportunities 👇
ADANIENT | 11th Sept 2025
Overall Bias: Bullish
Spot Price: ₹2,446.50
Trend: Uptrend
Volatility: Moderate (IV ~24–25%)
Ideal Strategy Mix: Directional Bullish + OTM Convexity + Hedge via PE
________________________________________
✅ Bullish Trade (Naked options as per trend)
ADANIENT 2450 CE LTP @ ₹34.45
Why:
Long Build-up at 2450 CE → OI ↑ 173% with Price ↑ 118% (strong confirmation).
Volume surge 986% → heavy participation.
Delta 0.46 → balance of ITM probability & convexity.
Rising IV (5.9%) → supports premium expansion.
________________________________________
⚠️ Contrarian Trade (Naked options against trend)
ADANIENT 2300 PE LTP @ ₹21.50
Why:
Acts as a downside hedge in case of reversal.
IV 28.7% with IV ↑ 26.8% → room for premium spike.
Delta -0.33 → controlled risk hedge.
Suitable for protection if momentum stalls.
________________________________________
🎯 Strategy Trade (As per trend + OI data)
Bull Call Spread → 2450 CE LTP @ ₹34.45 & 2550 CE LTP @ ₹10.75
Why:
• Aligns with strong bullish OI build-up (2400–2600 CE cluster).
• Captures upside momentum with defined risk.
• Excellent R:R (1:3+) → low cost, high potential reward.
• Short CE hedge (2550) cuts theta decay and risk.
________________________________________
________________________________________
ADANIPORTS | 11th Sept 2025
Overall Bias: Bullish
Spot Price: ~₹1,438 (near 1440 zone)
Trend: Uptrend
Volatility: Moderate (IV ~23–26%)
Ideal Strategy Mix: Directional Bullish + OTM Convexity + Hedge via PE
________________________________________
✅ Bullish Trade (Naked options as per trend)
ADANIPORTS 1440 CE LTP @ ₹13.90
Why:
Long Build-up at 1440 CE → OI ↑ 100.6% with Price ↑ 50.3% (classic long-side confirmation).
Volume surge 524.5% → strong participation.
Delta 0.39 → sweet spot between ITM probability & convexity.
IV rising 20.7% → supportive of premium expansion.
________________________________________
⚠️ Contrarian Trade (Naked options against trend)
ADANIPORTS 1400 CE LTP @ ₹27.90 (used here as hedge/play on exhaustion)
Why:
Higher ITM CE with Delta 0.51 → limited convexity, may underperform if momentum slows.
OI ↑ only 12.3% → weaker build-up compared to mid-OTM strikes.
IV 23.0% (low side) → less premium expansion potential.
Can act as a contrarian hedge if market consolidates below 1440.
________________________________________
🎯 Strategy Trade (As per trend + OI data)
Bull Call Spread → ADANIPORTS 1440 CE LTP @ ₹13.90 & 1500 CE LTP @ ₹4.95
Why:
• Strong long build-ups across 1420–1460 strikes → confirms directional bias.
• Captures upside momentum with defined risk using OTM convexity (1500 CE).
• Excellent R:R (≈ 1:2+) → low debit, higher potential payoff.
• Short OTM CE (1500) reduces theta decay and caps risk.
________________________________________
________________________________________
AUROPHARMA | 11th Sept 2025
Overall Bias: Bullish
Spot Price: ~₹1,118 (near 1120 zone)
Trend: Uptrend
Volatility: Rich (IV ~30–32%)
Ideal Strategy Mix: Bullish Directional + Debit Spreads (IV hedging) + Convexity via OTM Calls
________________________________________
✅ Bullish Trade (Naked options as per trend)
AUROPHARMA 1140 CE LTP @ ₹18.95
Why:
Long Build-up → Price ↑ 351% with OI ↑ 280% (strong long confirmation).
Volume surge 1792% → very active participation.
Delta 0.40 → sweet convexity with good ITM odds.
IV rising 6.2% → supports premium expansion.
________________________________________
⚠️ Contrarian Trade (Naked options against trend)
AUROPHARMA 1060 CE LTP @ ₹64.25 (deep ITM hedge / slowdown risk)
Why:
Short covering at 1060 CE (OI ↓ 15.8%) → weaker continuation if fresh longs don’t add.
Higher ITM delta (0.74) → less convexity, less reward-to-risk.
IV rich (31.6%) → premiums already expensive.
Could underperform if price momentum cools off near resistance zones.
________________________________________
🎯 Strategy Trade (As per trend + OI data)
Bull Call Spread → AUROPHARMA 1120 CE LTP @ ₹26.65 & 1160 CE LTP @ ₹13.10
Why:
• Strong long build-ups between 1120–1160 strike cluster confirm bullish continuation.
• Captures upside momentum with limited debit exposure.
• IV ~30+ → spreads preferred over naked calls (reduces risk of IV crush).
• Good convexity → balance of ITM probability and upside leverage.
________________________________________
________________________________________
HAL | 11th Sept 2025
Overall Bias: Bullish
Spot Price: ~₹4,650 (near 4600–4700 zone)
Trend: Uptrend
Volatility: Moderate (IV ~25–28%)
Ideal Strategy Mix: Directional Bullish + OTM Convexity + Debit Spreads for IV balance
________________________________________
✅ Bullish Trade (Naked options as per trend)
HAL 4800 CE LTP @ ₹36.10
Why:
Long Build-up → Price ↑ 16.8% with OI ↑ 7% (fresh long confirmation).
Volume surge 72.5% → active participation.
Delta 0.34 → balance of convexity & ITM probability.
IV 25.7% → stable with upside potential.
________________________________________
⚠️ Contrarian Trade (Naked options against trend)
HAL 4500 CE LTP @ ₹158.55 (short covering driven, contrarian hedge)
Why:
Short covering at 4500 CE → OI ↓ 13.7% while Price ↑ 12.8%.
Delta 0.61 → deeper ITM, lower convexity.
Volume dropped 56% → thinner liquidity, size should be reduced.
Better suited as hedge / risk balancer in case momentum stalls.
________________________________________
🎯 Strategy Trade (As per trend + OI data)
Bull Call Spread → HAL 4800 CE LTP @ ₹36.10 & 4900 CE LTP @ ₹21.00
Why:
• OI build-up across 4700–4900 CE cluster confirms bullish continuation.
• Debit spread reduces IV risk (IV ~25–27%) and limits loss.
• Defined-risk setup with convexity at 4900 CE.
• Cleaner R:R profile compared to naked long calls.
________________________________________
________________________________________
TCS | 11th Sept 2025
Overall Bias: Bullish
Spot Price: ~₹3,135 (near 3140 zone)
Trend: Uptrend
Volatility: Moderate (IV ~17–19%)
Ideal Strategy Mix: Directional Bullish + OTM Convexity + Debit Spread to balance low IV
________________________________________
✅ Bullish Trade (Naked options as per trend)
TCS 3200 CE LTP @ ₹25.05
Why:
Long Build-up → Price ↑ 9.2% with OI ↑ 7.9% (long confirmation).
IV 17.9% → moderate, stable for option buying.
Delta 0.36 → sweet spot of convexity & ITM odds.
Fits directional bullish bias near resistance breakouts.
________________________________________
⚠️ Contrarian Trade (Naked options against trend)
TCS 3100 CE LTP @ ₹67.85 (short covering driven, weaker momentum trade)
Why:
Short covering at 3100 CE → OI ↓ 4% while Price ↑ 6.1%.
Volume dropped 72.5% → thin liquidity, size down.
IV 17.2% easing -5.3% → weaker premium expansion.
Higher ITM delta (0.59) → less convexity, limited upside gearing.
________________________________________
🎯 Strategy Trade (As per trend + OI data)
Bull Call Spread → TCS 3200 CE LTP @ ₹25.05 & 3300 CE LTP @ ₹8.25
Why:
• Strong long build-ups in 3140–3200 CE cluster confirm bullish continuation.
• Low IV environment (17–19%) → debit spreads attractive.
• Defined-risk setup with convexity via OTM CE (3300).
• Good balance of premium outlay vs reward with capped downside.
________________________________________
________________________________________
📘 My Trading Setup Rules
Avoid Gap Plays → Check pre-open price action to avoid trades influenced by gap-ups/gap-downs.
Breakout Entry Only → Enter trades only if price breaks previous day’s High (for bullish trades) or Low (for bearish trades).
Watch Volume for Confirmation → Monitor volume closely. No volume = No trade.
Enter on Strong Candle + Volume → Execute the trade only if a strong candle appears with increasing volume in the direction of the trade.
Defined Risk:Reward Only → Take trades only if R:R is favorable (ideally ≥ 1:2).
Premium Disclaimer → Option premiums shown are based on EOD prices — real-time premiums may vary during execution.
Time Frame Preference → Trade with your preferred time frame — this strategy works across intraday or positional setups.
⚠️ Disclaimer – Please Read Carefully
The information shared here is meant purely for learning and awareness. It is not a buy or sell recommendation and should not be taken as investment advice. I am not a SEBI-registered investment advisor, and all views expressed are based on personal study, chart patterns, and publicly available market data.
Trading — whether in stocks or options — carries risk. Markets can move unexpectedly, and losses can sometimes exceed the money you have invested. Past performance or past setups do not guarantee future results.
If you are a beginner, treat this as a guide to understand how the market works — practice on paper trades before risking real money. If you are experienced, always assess your own risk, position sizing, and strategy suitability before entering trades.
Consult a SEBI-registered financial advisor before making any real trading decision. By engaging with this content, you acknowledge full responsibility for your trades and investments.
💬 Found this useful?
🔼 Give this post a Boost to help more traders discover clean, structured learning.
✍️ Drop your thoughts, questions, or setups in the comments — let’s grow together!
🔁 Share with fellow traders and beginners to spread awareness.
👉 “If you liked this breakdown, follow for more clean, structured setups with discipline at the core.”
🚀 Stay Calm. Stay Clean. Trade With Patience.
Trade Smart | Learn Zones | Be Self-Reliant 📊
HDFCBANK 1D Time frame📍 Current Price Action
Current Price: ~₹968
Day Range: ₹960 – ₹975
Trend: Neutral to mildly bullish
⚙ Technical Indicators
RSI (14): ~53 → neutral momentum
MACD: Slightly positive → mild upside bias
ADX (14): ~32 → moderate trend strength
MFI (Money Flow Index): Mid-range → balanced buying/selling pressure
📊 Moving Averages
Short-term (5, 10, 20-day): Price trading above → bullish signals
Medium to Long-term (100, 200-day): Mixed to weak → acting as resistance
📉 Support & Resistance
Immediate Support: ₹960 – ₹965
Next Support Zone: ₹940 – ₹950
Immediate Resistance: ₹970 – ₹975
Next Resistance: ₹985 – ₹990
🧠 Summary
HDFC Bank is in a neutral to mildly bullish zone on the daily chart. Price is holding above short-term averages, but longer-term averages are acting as resistance. If the stock sustains above ₹975, it may move toward ₹985–₹990. Failure to hold ₹960 could drag it toward ₹940–₹950.

INFY 1D Time frame📍 Current Price Action
Current Price: ~₹1,509
Day Change: about –1.5%
Daily Range: ₹1,500 – ₹1,515
⚙ Technical Indicators
RSI (14): ~57–60 → neutral to mildly bullish momentum
MACD: Positive → signals upward bias
Stochastic Oscillator: Near oversold zone → indicates possible bounce
ADX (14): ~26 → moderate trend strength
Money Flow Index (MFI): Mid-range → no extreme buying/selling pressure
📊 Moving Averages
Short-term (5, 10-day): Price trading slightly below → short-term weakness
Medium to Long-term (50, 100, 200-day): Price still above → long-term structure supportive
📉 Support & Resistance
Immediate Support: ~₹1,500
Next Support: ~₹1,480 – ₹1,470
Immediate Resistance: ~₹1,512 – ₹1,515
Breakout Target (if above resistance): ~₹1,530 – ₹1,540
🧠 Summary
INFY is neutral to mildly bullish on the daily chart. Support at ₹1,500 is crucial — holding above it keeps momentum intact. If the stock breaks above ₹1,515, it can push toward ₹1,530–1,540. On the downside, breaking below ₹1,500 may invite weakness toward ₹1,480–1,470.
