TCS will take support at the GAP. That could be a good level to go long. Watch for levels of 2600.
TCS formed a good runaway gap. With very good volumes.
The same gap was also tested twice and successfully rebounded.
Buy at 2605 after test happens.
I am starting a new telegram channel. To join my telegram channel, leave a comment with "interested." NSE:TCS
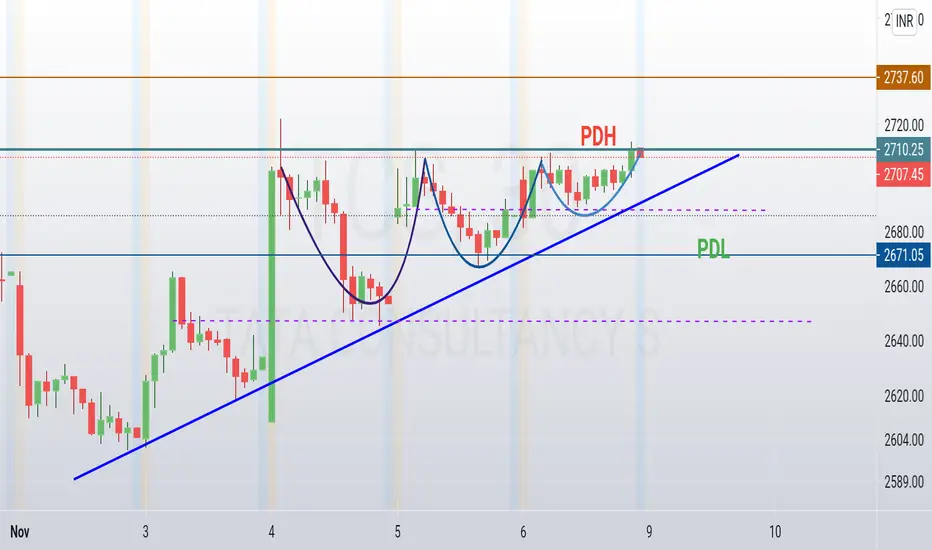
TCS

TCS TRIANGLE BREAKOUTNSE:TCS
OVERALL OUTLOOK ON LONG TERM CHART IS BULLISH
ON 30 MIN CHART,PRICE FORMED A TRIANGLE PATTERN ON THE BACK OF LOW VOLUME
IF PRICE BREAKS TRIANGLE TOP WITH HIGH VOLUME ,PRICE MIGHT REACH NEXT RESISTANCE 2886

TCS - CHANNEL BREAKOUT - BULLISHNSE:TCS
ON DAILY CHART HIGHER HIGH FORMATION IS CLEARLY VISIBLE & ALSO VOLUME IS ON HIGHER SIDE WHEN PRICE IS MOVING UP
SUPPLY CAME IN ON 8TH OCTOBER WITH EXTREMELY HIGH VOLUME FOLLOWED BY SErIES OF WIDE RANGE BEARISH CANDLE.BUT VOLUME IS RELATIVELY LOW SUGGESTING IT MIGHT BE A RETRACEMENT
ON 15 MIN CHART,LOWER LOW STRUCTURE WHICH FORMED OVERS PAST TWO WKS HAS BEEN BROKEN AND STARTING TO FORM HIGHER HIGH STRUCTURE BUT WE NEED VOLUME CONFIRMATION.
ALSO FORMED A CHANNEL AND PRICE IS CURRENTLY TRADING NEAR CHANNEL TOP WHICH ACTS AS RESISTANCE
IF PRICE BREAKS ABOVE CHANNEL TOP (RESISTANCE) WITH VOLUME EXPANSION,PRICE MIGHT MOVE TO NEXT RESISTANCE ZONE (2955-2980),WHERE PRICE MIGHT TEST THAT RESISTANCE LEVEL

TCS buy opportunity TCS has shown a strong support at 2600 and is going in a strong uptrend with a sideways support. Buy for a target of 2830

TCSIm not an expert im just sharing my views on TCS for tomorrow
Im not responsible for any profit or loss this is not a recommendation

TCS - Bullish Hammer post pullbackNote: This is for educational purpose only.
21 EMA has acted as a dynamic support in the past. There seems to be a pullback to 21 EMA and formation of hammer. Moreover, there is increase in volume. RSI is at 58 which is nearing bullish zone.


asian paint booked 1 % traget ANALYSES BASED ON
1. PRICE ACTION AND ONLY PRICE ACTION
.
9940084570
IF YOU HAVE ANY QUERIES

#TCS below 2600 Seems more weakTcs holding below 2600 might push towards 2545.
Upside holding above 2635 might push towards 2668/ 2708/ 2750
Regards


TCS - GAP FILLINGTCS coming back to fill the long created gap.
Sell below : 2600
Target : 2555
Note:
Avoid the stock if a big gap up or gap down is seen
Enter after the breakout happens and not before it
Do not chase the market, i.e., do not get involved in late entries
Only enter with strict stop-loss and target
This is not a recommendation and is for educational purposes only.
always follow risk-reward and quantity management for the 100% of the times
The above mentioned idea may not work, so beware of the risk you are taking
Follow me to Learn and Earn with me.
Happy Trading!!


HINDUNILVR KEY LEVEL SUPPORT AND RESISTANCE INTRADAY 03/11/2020HINDUSTAN UNILEVER KEY LEVELS SUPPORT AND RESISTANCE FOR INTRADAY 03/11/2020
TRADE WITH STRICT STOP-LOSS AND FOLLOW RISK MANAGEMENT

RELIANCE KEY LEVELS SUPPORT AND RESISTANCE 03/11/2020 INTRADAYRELIANCE KEY LEVELS SUPPORT AND RESISTANCE FOR INTRADAY 03/11/2020
TRADE WITH STRICT STOP-LOSS AND FOLLOW RISK MANAGEMENT

NIFTY KEY LEVELS SUPPORT AND RESISTANCE INTRADAY 03/11/2020 STOCK KEY LEVELS SUPPORT AND RESISTANCE FOR INTRADAY 03/11/2020
TRADE WITH STRICT STOPLOSS AND FOLLOW RISK MANAGEMENT

BANKNIFTY KEY LEVELS SUPPORT AND RESISTANCE 03/11/2020 INTRADAYSTOCK KEY LEVELS SUPPORT AND RESISTANCE FOR INTRADAY 03/11/2020
TRADE WITH STRICT STOPLOSS AND FOLLOW RISK MANAGEMENT

TCS Symmetrical Triangle FormationIt has formed a great symmetrical triangle and on a verge to give a breakout. Rising ADX shows for a upcoming movement. Might go bullish or bearish.

NIFTY KEY LEVELS SUPPORT AND RESISTANCE INTRADAY 02/11/2020 NIFTY50 KEY LEVELS SUPPORT AND RESISTANCE FOR INTRADAY 02/11/2020
TRADE WITH STRICT STOPLOSS AND FOLLOW RISK MANAGEMENT


