"XAU/USD Price Action Analysis: Targeting $3,063 or Reversal to Alright! Let's break down the chart analysis. 📊
🔹 Chart Overview:
Pair: XAU/USD (Gold vs. US Dollar)
Timeframe: 1-hour (H1)
Price Level: Current price at $3,030.44
Target Point: $3,063.97
🔥 Key Observations:
Supply and Demand Zones:
The highlighted blue zones suggest resistance (supply) where price was rejected twice (blue arrows).
The larger gray zones below indicate potential demand/support.
Double Top Formation:
The double blue arrows point to a possible double-top pattern, hinting at a bearish reversal. However, the price hasn't strongly broken below the neckline yet.
Scenario Analysis:
Bullish Scenario: If the price holds the current demand zone and breaks above the immediate resistance, we could see a rally towards the target of $3,063.97. 💹🚀
Bearish Scenario: If it fails to hold the support zone, it may drop to the lower demand area around $3,000. 🔻
📉 Conclusion:
Entry Idea: Long above the supply zone break with a target of $3,063.97.
Stop Loss: Below the current demand zone at around $3,020.
Risk Management: Watch for strong price action before entering.
Techincalanalysis

Technical Analysis Advanced candlesticks These advanced candlesticks are associated with strong price moves, and often gaps, which cause sharp shifts in direction. Traders can participate by noticing these patterns and acting quickly to get in as the price moves in the new direction. Candlestick patterns do not have price targets, which means traders shouldn't get greedy.

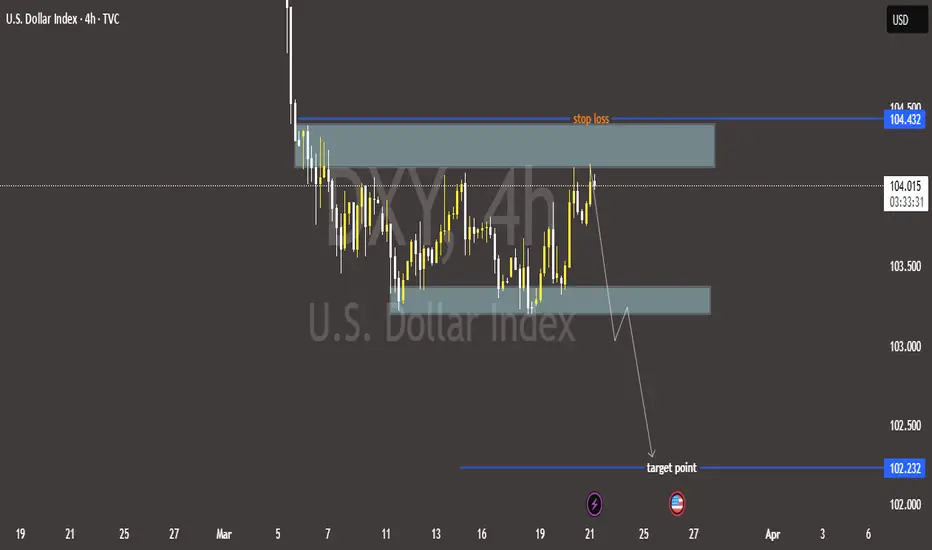
U.S. Dollar Index (DXY) – Bearish Outlook with Key Levels📉 Bearish Bias on U.S. Dollar Index (DXY) – 4H Chart
🔹 Resistance Zone & Stop Loss 🚫
📍 Resistance: 104.200 - 104.432
🛑 Stop Loss: 104.432 (Above resistance zone)
🔸 Support Zone 🛠️
📍 Intermediate Support: 103.300 (Possible bounce)
🔻 Target Point 🎯
📍 Target Price: 102.232 (Expected downside)
📊 Price Action Outlook:
✅ Bearish Scenario:
Price rejected from resistance 🔽
Lower highs forming ⚡
Breakdown expected toward 102.232 🎯
❌ Invalidation:
If price breaks above 104.432, bearish setup fails 🚫
🔥 Conclusion:
⬇️ Sell Bias below 104.200 targeting 102.232
❌ Cut losses if price closes above 104.432
XAU/USD Bullish Breakout Setup – Gold Price Analysis🔍 Key Observations:
🟢 Support Zone:
H1 Support Area 📉: $3,036.67 - $3,044
Price is currently testing this zone (🔵).
🔴 Resistance Level:
$3,053.45 (🛑 Immediate Barrier)
📈 Trade Setup:
✅ Potential Buy Entry near support (🟢)
🎯 Target Zone: $3,080 - $3,090 (📍🚀)
❌ Stop-loss: Below $3,036.67 (⚠️🔴)
📊 Price Action:
If support holds 🟩, price could move UP (⬆️) toward the target 🎯
If it breaks down ⬇️, price may fall further (⚠️📉).
📌 Conclusion:
Bullish 📈 if the price respects support (🟢)
Bearish 📉 if it breaks below stop-loss (⚠️).
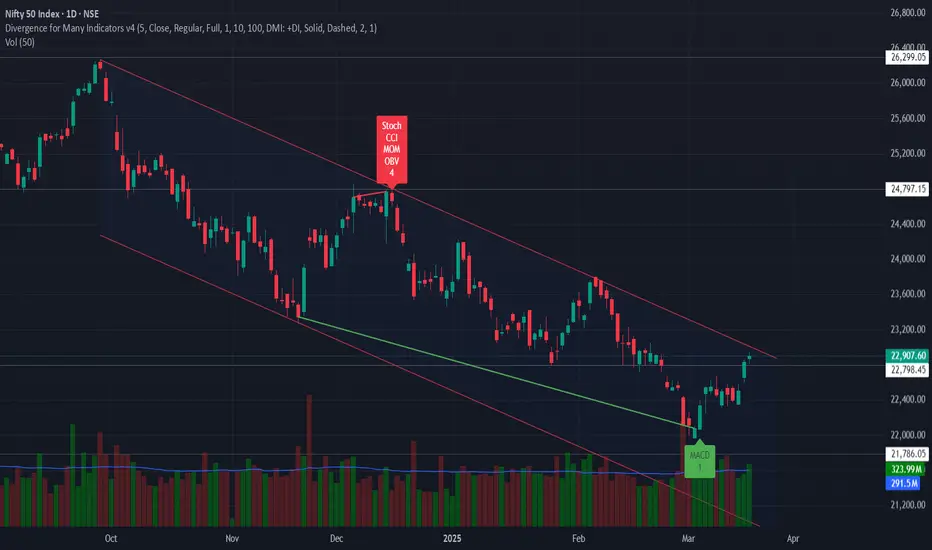
Nifty is set to resume its uptrendAfter correcting for more than 5 months and taking support at crucial level of 21800 which was pre election low, Nifty 50 is looking strong and set to resume new leg of uptrend. Nifty 50 is ready to cross falling channel at strong volume and macd crossing macd signal line.
stoploss - 21800
Target - 26300
Hang Seng Index (HSI) 's Price Action vis-à-vis Major PivotsHSI seems to have broken out of last year's high (Oct 2024) and Jan 2023 high, and retested it too.
The index is about 67% from Jan 2024 low.
The next major pivot is Feb 2021 High, after that Oct 2007 High and then Jan 2018 High (all are marked on chart).
The price seems to be gaining momentum and moving parabolically, as marked on chart.
It seems price will move higher over months, of course there would be retracements.
As always it won't be as predictable as I have hypothesized above.
Nevertheless at this juncture price action is positive and depending upon price action further into the months the hypothesis will succeed or fail.
Trade Safe

DXY (U.S. Dollar Index) Bearish Trade Setup – Potential DowntrenThis chart is a technical analysis of the U.S. Dollar Index (DXY) on a 1-hour timeframe. Here's a breakdown of the analysis:
🔹 Chart Overview:
DXY Price: 103.773
Trend: The price has been in an uptrend, but there's a potential for reversal.
Entry Point: 103.816
Stop Loss: 104.096 (Marked in red)
Take Profit (TP) Levels:
TP1: 103.608
TP2: 103.400
Next Target: 103.133
🔹 Analysis:
Trendline Break: The price had been following an ascending trendline, which appears to be broken. This suggests a potential downtrend continuation.
Bearish Setup: The trade setup suggests a short (sell) position.
Risk-Reward Ratio:
The stop loss (104.096) is placed above the recent resistance.
The take profit levels are set at key support zones.
Market Sentiment: If the price stays below 103.816, it may continue dropping toward TP1, TP2, and the Next Target.
🔹 Conclusion:
Bearish Bias 📉: The market could see further downside if the price stays below the entry point.
Trade Idea: Short below 103.816, with a stop at 104.096, and targets at 103.608, 103.400, and 103.133.

technical analysis class 1| Technical Analysis – Class 1**
### **Introduction to Technical Analysis**
Technical analysis is a method of evaluating financial markets by analyzing price movements, chart patterns, and indicators. Unlike fundamental analysis, which focuses on company financials, technical analysis is based purely on market data.
### **Core Principles of Technical Analysis**
1. **Price Discounts Everything** – Market prices reflect all available information, including fundamentals, news, and investor sentiment.
2. **Price Moves in Trends** – Trends can be classified as uptrend, downtrend, or sideways. Identifying trends helps traders make better decisions.
3. **History Repeats Itself** – Market patterns tend to repeat due to human psychology and behavioral tendencies.
### **Key Components of Technical Analysis**
1. **Price Charts** – The foundation of technical analysis, charts visualize price movements. Common types include:
- **Line Chart** – Simplest form, showing closing prices.
- **Bar Chart** – Displays open, high, low, and close (OHLC).
- **Candlestick Chart** – Most popular, showing price action in a more visual manner.
2. **Support & Resistance Levels** –
- **Support:** A price level where buying interest is strong enough to prevent further decline.
- **Resistance:** A price level where selling pressure prevents further rise.
3. **Trend Analysis** –
- **Uptrend:** Higher highs and higher lows.
- **Downtrend:** Lower highs and lower lows.
- **Sideways Trend:** Price moves within a range.
4. **Volume Analysis** – Confirms price trends. Increasing volume in an uptrend suggests strong momentum, while declining volume may indicate weakness.
### **Conclusion**
Technical analysis provides traders with tools to analyze price trends and make informed decisions. Mastering support, resistance, trend identification, and volume analysis is key to successful trading.
Would you like a more detailed breakdown or any specific topics in Class 2? 🚀📈

GOLD WEEKLY OUTLOOK – AWAITING CPI & PPI IMPACT! GOLD WEEKLY OUTLOOK – CPI & PPI TO DRIVE THE NEXT MOVE!
🔥 GOLD REMAINS IN A RANGE – BREAKOUT OR CORRECTION AHEAD? 🔥
📌 Market Overview
Gold continues to trade sideways within a wide range, despite last week’s disappointing Nonfarm Payrolls (NFP) report for the U.S. economy. Even though the jobs data was weak, gold failed to break a new high, indicating that investors may have anticipated the report. Key market focus is now shifting towards Trump’s trade policies & inflation rather than employment data alone.
👉 After the news release, gold reacted briefly but lacked strong bullish momentum, continuing to trade around $2,910 before closing the week at this level.
📉 TECHNICAL ANALYSIS – KEY PRICE LEVELS
🔹 Resistance Levels to Watch:
$2,929: Immediate resistance; breaking this level could confirm bullish momentum.
$2,943 - $2,954: Major resistance; a breakout here could push gold towards $2,970+.
🔻 Support Levels to Watch:
$2,884: Closest support; breaking this could open the door for further downside.
$2,872 - $2,859: Strong support zone where buyers may step in.
$2,840: A critical level, especially if the upcoming CPI & PPI reports strengthen the USD.
📊 KEY EVENTS IMPACTING GOLD THIS WEEK
📅 CPI & PPI – The Major Catalysts Ahead
💡 Expectations:
If CPI and PPI come in higher than expected ➜ USD strengthens, and gold may correct lower.
If CPI and PPI are weaker ➜ USD weakens, and gold could break resistance to continue its uptrend.
⚠️ Key Technical Clues to Watch:
Gold needs to break out of the $2,926 - $2,896 range to confirm a trend direction.
Resistance at $2,926 - $2,928 is still holding, which doesn’t favor BUY setups yet.
If gold drops below $2,896 - $2,884, the likelihood of a deeper correction increases.
🎯 TRADING PLAN
🔵 BUY ZONE: $2,874 - $2,872
📍 SL: $2,868
🎯 TP: $2,878 - $2,882 - $2,886 - $2,890 - $2,900
🔴 SELL ZONE: $2,944 - $2,946
📍 SL: $2,950
🎯 TP: $2,940 - $2,935 - $2,930 - $2,926 - $2,922
⚡ CONCLUSION
📌 Wait for price reaction at key levels before making trading decisions.
📌 Focus on the $2,926 - $2,896 range to determine the main trend.
📌 Strictly follow TP/SL to protect your account and maximize profit!
💬 What’s your take? Will gold break higher or correct deeper? Drop your thoughts below! 🚀🔥

MACD trading with histogram# **MACD Trading with Histogram**
The **MACD Histogram** helps traders visualize **momentum strength and trend shifts** by measuring the gap between the MACD Line and Signal Line.
## **1️⃣ Understanding the Histogram**
✅ **Positive Histogram:** Bars above zero → **Bullish momentum** (MACD above Signal Line).
✅ **Negative Histogram:** Bars below zero → **Bearish momentum** (MACD below Signal Line).
✅ **Expanding Bars:** Strengthening trend.
✅ **Shrinking Bars:** Weakening trend → **Possible reversal**.
## **2️⃣ Trading Strategies**
✅ **Histogram Crossover:**
🔹 **Bullish:** Histogram moves from negative to positive → Buy.
🔹 **Bearish:** Histogram moves from positive to negative → Sell.
✅ **Histogram Divergence:**
🔹 **Bullish Divergence:** Price makes lower lows, histogram forms higher lows → **Uptrend reversal**.
🔹 **Bearish Divergence:** Price makes higher highs, histogram forms lower highs → **Downtrend reversal**.
### **Conclusion**
Using the **MACD Histogram** with **trendlines and support-resistance levels** improves trade accuracy and **helps identify momentum shifts early**. 🚀

database trading part 2#Database Trading
Database trading enhances decision-making by using **historical data, AI models, and statistical patterns** for trade execution.
## **1️⃣ Advanced Data Utilization**
✅ **Backtesting Strategies:** Evaluates trade performance on past data.
✅ **AI & Machine Learning:** Predicts market movements using data-driven models.
✅ **Pattern Recognition:** Identifies high-probability trade setups.
## **2️⃣ Optimizing Trade Execution**
✅ **Real-Time Data Processing:** Helps in **scalping, swing, and intraday trading**.
✅ **Automated Strategies:** Reduces emotional bias and improves consistency.
✅ **Risk Management:** Data-driven stop-loss & take-profit levels for better control.
### **Conclusion**
Database trading enhances accuracy by using **quantitative models and real-time data**, making it a powerful tool for modern traders. 🚀

Advanced Option Trading With Professionals The 3 5 7 rule is a risk management strategy in trading that emphasizes limiting risk on each individual trade to 3% of the trading capital, keeping overall exposure to 5% across all trades, and ensuring that winning trades yield at least 7% more profit than losing trades.
Why do 90% option traders lose money?
This is because option traders often find themselves directionless, making it difficult to predict market movements accurately. The complex nature of options, combined with the high volatility, leads to significant losses for most traders. It's time to stop option trading.

Bajaj Finance Ltd (BAJFINANCE) Stock AnalysisGlobalTradeHub | Bajaj Finance Ltd (BAJFINANCE) Stock Analysis
Fundamental Analysis:
Bajaj Finance, a leading NBFC, benefits from strong loan growth, digital transformation, and a diversified portfolio across consumer and SME lending. Consistent profitability and low NPAs make it a strong player. Risks include rising interest rates and economic slowdowns affecting credit demand.
Technical Analysis:
The stock is facing resistance near ₹7,250. A breakout could push it toward ₹7,500. Strong support is at ₹6,900, and a breakdown may lead to ₹6,600. RSI around 62 suggests bullish momentum but nearing overbought territory.
Key Levels:
- Resistance: ₹7,250 / ₹7,500
- Support: ₹6,900 / ₹6,600
Conclusion:
Bajaj Finance remains fundamentally strong. A breakout above ₹7,250 could trigger further upside, while dips to support zones offer buying opportunities. 💰📈

HCL Technologies Ltd. (HCL Tech) Stock AnalysisGlobalTradeHub | HCL Technologies Ltd (HCLTECH) Stock Analysis
Fundamental Analysis:
HCL Technologies, a leading IT services firm, benefits from strong digital transformation demand, cloud services growth, and a solid order pipeline. Consistent revenue growth and high margins support stability. Key risks include global economic slowdowns and currency fluctuations.
Technical Analysis:
The stock is near resistance at ₹1,700. A breakout could push it toward ₹1,800. Strong support lies at ₹1,600, with further downside risk if breached. RSI around 60 indicates bullish momentum but not overbought yet.
Key Levels:
- Resistance: ₹1,700 / ₹1,800
- Support: ₹1,600 / ₹1,500
Conclusion:
HCL Tech remains a strong IT player with growth potential. A breakout above ₹1,700 could drive further upside, while support levels offer buying opportunities. 💻📈

overview of financial markets# **Overview of Financial Markets**
Financial markets are platforms where buyers and sellers trade assets like **stocks, bonds, currencies, and commodities**. They facilitate **capital flow, investment, and economic growth**.
## **1️⃣ Types of Financial Markets**
✅ **Stock Market:** Companies issue shares; investors trade equity (e.g., NSE, BSE).
✅ **Bond Market:** Governments & corporations issue debt securities for fundraising.
✅ **Forex Market:** Global exchange of currencies; highly liquid.
✅ **Commodities Market:** Trading in gold, oil, and agricultural products.
✅ **Derivatives Market:** Futures & options contracts based on underlying assets.
## **2️⃣ Importance of Financial Markets**
✅ **Capital Allocation:** Connects investors with businesses needing funds.
✅ **Liquidity:** Ensures assets can be bought or sold easily.
✅ **Price Discovery:** Determines fair asset values through supply & demand.
### **Conclusion**
Financial markets are the backbone of the economy, offering **investment opportunities, risk management, and capital formation**. 🚀

MACD trading # **MACD Trading Strategy**
MACD (**Moving Average Convergence Divergence**) is a powerful momentum indicator used to identify **trend strength, reversals, and entry-exit points** in trading.
## **1️⃣ Key Components of MACD**
✅ **MACD Line:** Difference between the 12-day and 26-day EMA.
✅ **Signal Line:** 9-day EMA of the MACD line, used for trade signals.
✅ **Histogram:** Represents the gap between the MACD and Signal line.
## **2️⃣ MACD Trading Strategies**
✅ **MACD Crossover:**
🔹 **Bullish Signal:** MACD crosses above the Signal Line → Buy.
🔹 **Bearish Signal:** MACD crosses below the Signal Line → Sell.
✅ **MACD Divergence:**
🔹 **Bullish Divergence:** Price makes lower lows, but MACD forms higher lows → Reversal Up.
🔹 **Bearish Divergence:** Price makes higher highs, but MACD forms lower highs → Reversal Down.
✅ **MACD Histogram Analysis:**
🔹 Expanding bars indicate **strong momentum**, while shrinking bars signal **trend weakening**.
### **Conclusion**
MACD is a reliable tool for **trend confirmation and momentum analysis**. Combining it with **support-resistance and volume analysis** enhances trade accuracy. 🚀

APL Apollo Tubes Ltd Stock Analysis**GlobalTradeHub Stock Analysis**
**APL Apollo Tubes Ltd (APLApollo)**
**Fundamental**: A leading player in the Indian steel pipe industry, APL Apollo has consistent growth driven by infrastructure demand.
**Technical**: Bullish trend with moving averages supporting upside. RSI is neutral, indicating room for further growth.
**Support Levels**: ₹1,000, ₹950
**Resistance Levels**: ₹1,150, ₹1,200
Let me know if you'd like to analyze another stock!

Market Recovery Strategies Amidst Downturns# Market Recovery Strategies Amidst Downturns
Market downturns create uncertainty, but strategic planning helps traders navigate volatility and recover losses effectively.
## 1️⃣ Identifying Market Bottoms
✅ Technical Signs: RSI below 30 (oversold), MACD bullish divergence, and volume spikes signal reversals.
✅ Fundamental Triggers: Earnings growth, government policies, and institutional buying indicate recovery.
## 2️⃣ Key Recovery Strategies
✅ Sector Rotation: Shift focus to recovering or defensive sectors (tech, banking, FMCG).
✅ Portfolio Rebalancing: Move capital to strong stocks and blue chips.
✅ Dollar-Cost Averaging: Invest gradually to reduce volatility risk.
✅ Derivative Hedging: Use Put Options & Covered Calls for risk protection.
✅ Market Sentiment Tracking: Watch Put-Call Ratio (PCR) & VIX for trend signals.
# 3️⃣ Trading Psychology for Recovery
✅ Avoid Panic Selling: Assess market recovery potential before exiting.
✅ Stick to a Strategy: Maintain risk management and long-term goals.
✅ Learn & Adapt: Every downturn is an opportunity to refine trading skills.
Conclusion: Market downturns are temporary—using smart strategies, risk control, and disciplined trading ensures long-term success! 🚀📈

MACD divergence tradingMACD divergence trading helps identify trend reversals using Bullish and Bearish divergences. Bullish divergence occurs when the price makes lower lows, but MACD makes higher lows, signaling a potential uptrend. Bearish divergence happens when the price makes higher highs, but MACD makes lower highs, indicating weakness. Combining MACD divergence with support-resistance and volume analysis increases trade accuracy.

Option TradingOption trading involves buying and selling options contracts that give the right (but not the obligation) to buy or sell an asset at a set price before expiry. There are two types: Call options (bullish) and Put options (bearish). Traders use options for hedging, speculation, and leveraging positions. Strategies like straddles, strangles, and spreads** help manage risk and maximize profits.

Zensar Technologies Ltd. (ZENSARTECH) Stock Analysis### **Zensar Technologies Ltd. (ZENSARTECH) Stock Analysis**
---
#### **Fundamental Analysis:**
- **Company Overview:**
Zensar Technologies Ltd. is a global IT services and consulting company headquartered in India. It provides a range of technology solutions such as digital transformation, cloud computing, enterprise solutions, AI, data analytics, and IT infrastructure management. Zensar serves a diverse set of industries, including retail, manufacturing, financial services, and healthcare, with a focus on delivering innovative solutions to help businesses optimize their operations and customer experiences.
- **Revenue & Profit Growth:**
- **Revenue Trends:** Zensar has been seeing a steady increase in revenue, driven by its focus on digital and cloud transformation services. However, it has faced some challenges in maintaining consistent growth in certain traditional IT services. The company’s revenue growth in the most recent quarters has been strong, particularly in its key markets in North America.
- **Profitability:** Zensar's profitability has improved due to a focus on high-margin services such as cloud, AI, and automation. The company’s operating margins have also seen improvement as it drives cost efficiencies and shifts toward higher-value services.
- **Valuation (as of Feb 2025):**
- **P/E Ratio:** 17.2 (which is fairly priced considering its growth potential in digital services, compared to industry peers)
- **Price-to-Book Ratio:** 2.4 (indicating a reasonable valuation relative to the company's book value, with room for potential upside)
- **Dividend Yield:** 0.8% (Zensar offers a modest dividend, reflecting its reinvestment strategy aimed at expansion and growth)
- **Key Ratios:**
- **Return on Equity (ROE):** 14.6% (a good level, indicating efficient use of equity capital)
- **Return on Assets (ROA):** 6.5% (reflecting decent asset management but room for improvement)
- **Debt-to-Equity Ratio:** 0.1 (low debt levels suggest minimal financial risk and a conservative approach to leveraging)
- **Outlook:**
Zensar Technologies is well-positioned in the growing digital and cloud services market, benefiting from the continued demand for digital transformation across industries. The company’s focus on AI, automation, and cloud solutions aligns well with market trends, making it a promising player for long-term growth. However, its performance will depend on execution in expanding its global footprint, managing competition from larger players, and navigating macroeconomic challenges.
---
#### **Technical Analysis:**
- **Current Price:** ₹380 (as of February 2025)
- **Chart Overview:**
Zensar’s stock has had a volatile ride in the last year, showing a mix of periods of strong growth followed by consolidations. The stock is now in a consolidation phase, with key technical indicators pointing to a potential breakout or a pullback, depending on the broader market movements and news related to its business performance.
- **Support and Resistance Levels:**
- **Immediate Support:** ₹370 (a recent low where the stock has consistently found buying interest)
- **Next Major Support:** ₹340 (a critical support level where the stock could stabilize in case of a broader market correction)
- **Immediate Resistance:** ₹400 (the recent high, which could act as a resistance point in the short term)
- **Next Major Resistance:** ₹420 (the next psychological resistance level, if the stock sees sustained upside)
- **Moving Averages:**
- **50-Day Moving Average (50-DMA):** ₹375 (suggesting that the stock is currently trading slightly above its short-term average, indicating a neutral to slightly bullish trend)
- **200-Day Moving Average (200-DMA):** ₹350 (a solid support level, showing the stock has a positive long-term trend)
- **Relative Strength Index (RSI):**
- RSI stands at 55, which is neutral, indicating that the stock is neither overbought nor oversold. This suggests there could be potential for either a break higher or a short-term correction depending on broader market movements.
- **MACD:**
- The MACD is showing a slight bullish crossover, suggesting that the stock could see some upward momentum. However, the momentum is not strong enough to indicate a significant rally, so investors should watch for a breakout above ₹400 for further confirmation.
---
#### **Key Metrics:**
- **Market Capitalization:** ₹15,000 crore (approx.)
- **52-Week High:** ₹415
- **52-Week Low:** ₹330
---
#### **Risk Considerations:**
- **Competition:** Zensar operates in a highly competitive IT services market, where it faces competition from larger, more established players such as Tata Consultancy Services (TCS), Infosys, and Wipro. Intense competition could put pressure on margins and pricing.
- **Execution Risks:** As Zensar focuses more on high-growth areas like cloud computing and AI, it faces the challenge of executing these strategies effectively and keeping pace with technological advancements.
- **Geopolitical Risks:** Zensar derives a significant portion of its revenue from international markets, particularly North America. Any changes in trade policies, regulations, or economic conditions in these markets could impact the company's performance.
- **Currency Risks:** Zensar, like most Indian IT companies, is exposed to currency fluctuations, particularly the INR/USD exchange rate. A significant depreciation of the rupee could negatively affect margins, especially if the company faces revenue volatility from international clients.
---
### **Conclusion:**
Zensar Technologies Ltd. is a promising player in the IT services sector, with a strong focus on digital transformation, cloud computing, and AI. The company’s steady revenue growth, improving profitability, and low debt levels are attractive for long-term investors. Technically, the stock is in a consolidation phase, with immediate support at ₹370 and resistance around ₹400. A breakout above ₹400 could signal further upside potential, but investors should be cautious of broader market fluctuations.
Zensar's growth trajectory in digital services and automation makes it an attractive option for those seeking exposure to the IT sector. However, the company needs to continue executing its strategy and managing competition from larger players. The relatively low dividend yield and modest growth in profitability might be a consideration for income-focused investors.
---
**Disclaimer:** This analysis is based on publicly available information, and I am not a SEBI-registered advisor. Please conduct your own research and consult a certified financial advisor before making any investment decisions. This is for informational purposes only and should not be considered as financial advice.

Mahindra & Mahindra Ltd. (M&M) Stock Analysis### **Mahindra & Mahindra Ltd. (M&M) Stock Analysis**
---
#### **Fundamental Analysis:**
- **Company Overview:**
Mahindra & Mahindra Ltd. (M&M) is one of India's largest and most diversified conglomerates, with a strong presence in various industries including automotive, agriculture, aerospace, construction, energy, and finance. M&M is particularly well-known for its leadership in the Indian automotive market, especially in the segments of SUVs, tractors, and electric vehicles. The company’s focus is on innovation, sustainability, and providing solutions for rural and urban India.
- **Revenue & Profit Growth:**
- **Revenue Trends:** M&M has experienced steady revenue growth in recent years, driven by strong sales in its automotive and agricultural segments. The company's robust growth in its tractor and SUV divisions has helped offset slower growth in other sectors.
- **Profitability:** The company has been improving its profitability, with significant growth in operating profit margins due to operational efficiencies and strong demand for its vehicles, especially in rural India. The company has managed to report consistent growth in net profits, aided by its cost control measures and diversified revenue streams.
- **Valuation (as of Feb 2025):**
- **P/E Ratio:** 18.6 (this is relatively attractive for a company with a diversified business model and a leadership position in several key sectors)
- **Price-to-Book Ratio:** 2.2 (reflects a fair valuation based on the company's tangible assets, and market leadership in key segments)
- **Dividend Yield:** 1.5% (M&M has a stable dividend payout policy, though the dividend yield is on the lower side given its growth potential)
- **Key Ratios:**
- **Return on Equity (ROE):** 15.3% (a good indication of efficient use of shareholder capital)
- **Return on Assets (ROA):** 7.4% (reflecting solid asset management)
- **Debt-to-Equity Ratio:** 0.4 (low leverage, indicating a conservative approach to debt, which reduces financial risk)
- **Outlook:**
M&M is positioned well in the automotive sector with its strong portfolio in tractors, SUVs, and electric vehicles. The growing demand for EVs, especially in India, gives M&M a distinct advantage with its focus on sustainable mobility. The company is also expanding into new international markets. The agriculture and financial services sectors also offer significant growth potential. The company's diversified revenue base mitigates risks in any one sector, making it relatively stable.
---
#### **Technical Analysis:**
- **Current Price:** ₹1,500 (as of February 2025)
- **Chart Overview:**
M&M's stock has shown consistent growth over the last year, supported by strong fundamentals and increasing demand for its SUV and tractor models. The stock has seen a recent pullback, but the overall trend remains positive, as the company has been a leader in the SUV and tractor segments.
- **Support and Resistance Levels:**
- **Immediate Support:** ₹1,470 (a critical support level where the stock has bounced in recent times)
- **Next Major Support:** ₹1,400 (providing a strong cushion in case of a broader market correction)
- **Immediate Resistance:** ₹1,530 (recent highs, which could act as a barrier to further gains)
- **Next Major Resistance:** ₹1,600 (a psychological level, and also the previous all-time high)
- **Moving Averages:**
- **50-Day Moving Average (50-DMA):** ₹1,480 (indicating a neutral short-term trend)
- **200-Day Moving Average (200-DMA):** ₹1,400 (providing strong support, which aligns with the broader uptrend)
- **Relative Strength Index (RSI):**
- RSI is currently at 58, which indicates that the stock is neither overbought nor oversold, suggesting that there is still room for potential upside or further consolidation.
- **MACD:**
- The MACD is showing a bullish crossover, suggesting that positive momentum could continue. However, any significant rise in the stock could lead to an overbought condition, so it is important to watch for a potential correction.
---
#### **Key Metrics:**
- **Market Capitalization:** ₹2.2 trillion (approx.)
- **52-Week High:** ₹1,620
- **52-Week Low:** ₹1,100
---
#### **Risk Considerations:**
- **Commodity Price Fluctuations:** M&M is exposed to fluctuations in the prices of raw materials such as steel and aluminum, which are crucial for automotive manufacturing. A rise in these costs could impact profit margins.
- **Regulatory Risks:** Changes in government policies related to electric vehicles, agriculture, or taxes could impact M&M’s business. The shift towards EVs also comes with regulatory challenges, especially related to battery technology and charging infrastructure.
- **Competition:** The automotive sector is highly competitive, with both domestic and international players vying for market share. M&M faces significant competition in both the SUV and EV segments, and any aggressive moves by competitors could impact market share and profitability.
- **Geopolitical Risks:** M&M operates in various international markets, including the US, Europe, and several African countries. Geopolitical tensions, trade barriers, or economic slowdowns in these regions could negatively impact business performance.
---
### **Conclusion:**
Mahindra & Mahindra Ltd. (M&M) is a strong and diversified player in the Indian and global markets, with solid growth potential in both its automotive and agricultural divisions. The company's leadership in the tractor and SUV segments, combined with a strong focus on electric vehicles, positions it well for future growth. The stock has performed well, and its fundamental metrics are solid, with a low debt-to-equity ratio and strong profitability.
Technically, M&M is trading near key support levels around ₹1,470, with resistance around ₹1,530. A breakout above ₹1,530 could signal further upside potential. The stock has been consolidating in the short term, and while the RSI is not yet in overbought territory, investors should be mindful of potential risks, including commodity price fluctuations, regulatory changes, and competition in the automotive sector.
For long-term investors, M&M presents a solid opportunity, especially as the demand for electric vehicles and rural-focused solutions like tractors continue to grow. However, short-term volatility due to broader market movements and commodity price risks should be considered.
---
**Disclaimer:** This analysis is based on publicly available information, and I am not a SEBI-registered advisor. Please conduct your own research and consult a certified financial advisor before making any investment decisions. This is for informational purposes only and should not be considered as financial advice.

HCL Technologies Ltd. (HCL Tech) Stock Analysis### **HCL Technologies Ltd. (HCL Tech) Stock Analysis**
---
#### **Fundamental Analysis:**
- **Company Overview:**
HCL Technologies Ltd. is one of India's leading global IT services companies, offering a wide range of IT solutions and services, including software development, digital transformation, cloud computing, cybersecurity, IT infrastructure management, and enterprise solutions. The company serves various industries, including finance, healthcare, retail, and manufacturing, with a significant global presence, especially in North America and Europe.
- **Revenue & Profit Growth:**
- **Revenue Trends:** HCL Tech has shown strong and consistent growth in revenue, driven by robust demand for IT services and digital transformation solutions. For FY2025, HCL Tech reported a 12% year-on-year revenue growth, reflecting continued strong demand for cloud and digital services.
- **Profitability:** The company enjoys a high-margin business model, driven by its focus on premium IT services and digital transformation. HCL Tech has delivered strong profitability, with EBITDA margins in the 20-22% range. The company's net profit has grown steadily, benefiting from its diversified client base and strategic investments in next-generation technologies.
- **Valuation (as of Feb 2025):**
- **P/E Ratio:** 23.8 (in line with industry peers, reflecting steady growth expectations in the IT services sector)
- **Price-to-Book Ratio:** 5.0 (indicating strong investor confidence and premium valuation compared to book value)
- **Dividend Yield:** 2.3% (HCL Tech offers a good dividend yield, appealing to income investors)
- **Key Ratios:**
- **Return on Equity (ROE):** 25.5% (indicating efficient use of equity capital)
- **Return on Assets (ROA):** 15.8% (demonstrates effective use of company assets)
- **Debt-to-Equity Ratio:** 0.1 (HCL Tech has a very low debt-to-equity ratio, signaling a healthy balance sheet and low financial risk)
- **Outlook:**
HCL Tech is well-positioned to capitalize on the growing global demand for digital services, cloud computing, cybersecurity, and automation. With increasing investments in AI and automation technologies, HCL Tech is likely to continue seeing strong growth in the coming years. The company's strong balance sheet and healthy cash flow provide it with the financial flexibility to invest in new technologies and expand its service offerings.
---
#### **Technical Analysis:**
- **Current Price:** ₹1,080 (as of February 2025)
- **Chart Overview:**
HCL Tech’s stock has been in an upward trend over the past year, with a few consolidations. The stock has shown resilience in market corrections and has consistently found support near ₹1,000, indicating strong investor interest. It is currently trading near its all-time highs, with a breakout potential if positive earnings or announcements are made.
- **Support and Resistance Levels:**
- **Immediate Support:** ₹1,000 (a key psychological level and support zone for the stock)
- **Next Major Support:** ₹950 (providing a solid cushion in case of a deeper correction)
- **Immediate Resistance:** ₹1,110 (recent high, a breakout above this could trigger more upside)
- **Next Major Resistance:** ₹1,150 (a significant resistance level in the stock’s uptrend)
- **Moving Averages:**
- **50-Day Moving Average (50-DMA):** ₹1,065 (indicating a neutral to slightly bullish trend in the short term)
- **200-Day Moving Average (200-DMA):** ₹960 (strong support level, indicating a positive long-term trend)
- **Relative Strength Index (RSI):**
- RSI is at 65, which is slightly approaching the overbought zone. A pullback or consolidation may occur if the RSI goes above 70, suggesting a temporary correction before resuming the uptrend.
- **MACD:**
- The MACD is showing a bullish crossover, supporting the ongoing positive momentum. However, investors should monitor for any divergence if the price starts rising too quickly relative to the MACD.
---
#### **Key Metrics:**
- **Market Capitalization:** ₹2.87 trillion (approx.)
- **52-Week High:** ₹1,125
- **52-Week Low:** ₹840
---
#### **Risk Considerations:**
- **Currency Risk:** As HCL Tech derives a significant portion of its revenue from international markets (especially the US), any fluctuations in the INR/USD exchange rate can affect profitability.
- **Competition:** The IT services industry is highly competitive, with players like TCS, Infosys, and Wipro also vying for market share. Intense competition could pressure margins and pricing.
- **Geopolitical and Regulatory Risks:** Being a global player, HCL Tech is exposed to geopolitical tensions, regulatory changes, and trade policies, particularly in key markets like the US and Europe.
- **Client Concentration:** Although HCL Tech has a diversified client base, it still relies on key clients for a significant portion of its revenue. A loss of a major client could impact future earnings.
---
### **Conclusion:**
HCL Technologies Ltd. is a strong performer in the IT services sector, with a robust growth trajectory driven by the increasing demand for digital services, cloud computing, and cybersecurity solutions. The company’s solid financials, low debt, and strong return ratios indicate that it is well-positioned for continued growth. Technically, the stock has been in an uptrend, with immediate support at ₹1,000 and resistance at ₹1,110. A breakout above ₹1,110 could signal further upside, while a pullback could occur if the stock approaches overbought levels.
HCL Tech is well-positioned for long-term growth, especially as the demand for digital transformation accelerates globally. However, investors should be aware of potential risks such as currency fluctuations, competition, and geopolitical tensions that could affect its performance.
---
**Disclaimer:** This analysis is based on publicly available information, and I am not a SEBI-registered advisor. Please conduct your own research and consult a certified financial advisor before making any investment decisions. This is for informational purposes only and should not be considered as financial advice.
