XAU/USD : Buy at OB 4,19x – 4,18x, Targets 4,24x → 4,26x 1. Market Structure (H1)
Gold is retracing back into bullish structure after breaking a series of bullish ChoCH and BoS, forming a new high around 4,24x. The current decline is only a technical pullback because:
• Price is returning to the Buy Order Block at 4,188 – 4,196.
• This zone aligns with trendline support and the demand base that fueled the previous impulse.
• The macro structure remains bullish as long as H1 does not close below 4,188.
→ This is a clear pullback–continuation setup: wait for price to retrace into discount, then target higher zones.
2. Key Levels
🔹 Demand Zone (Buy Zone): 4,188 – 4,196
• Bullish OB
• Trendline support
• Priority BUY area
🔹 Resistance 1: 4,217 – 4,218
• Multiple rejections
• Breakout → next bullish leg
🔹 Resistance 2: 4,238 – 4,239
• 0.5–0.618 Fibo confluence
• Possible mild sell reaction
🔹 Liquidity & Targets:
• 4,259 → Fibo 1.272
• 4,278 → Fibo 1.618 + resting liquidity
3. Trading Plan
🔸 Main Scenario – BUY at OB 4,19x – 4,18x
Conditions:
• Price taps 4,188 – 4,196
• Reversal signals: pin bar, engulfing, or bullish ChoCH
Targets:
TP1: 4,217
TP2: 4,238
TP3: 4,259
TP4: 4,278
Invalidation:
• H1 close below 4,185 → stay out.
🔸 Alternate Scenario – Price goes up without retesting OB
If price holds above 4,210 and breaks 4,217:
• Wait for retest of 4,217
• BUY continuation toward 4,238 → 4,259 → 4,278
Market Outlook
Gold is accumulating and building a base for a stronger breakout. The OB Buy zone 4,19x – 4,18x remains the highest-probability reversal area.
Techincalanalysis

XAU/USD: Buy at OB 4.18x–4.17x; Sell on reaction.✍️ Captain Vincent – SMC Flow Analysis
📊 Market Structure (H1)
Gold continues to accumulate within the range of 4,200–4,220 after failing to break the recent peak. The structure shows:
• Multiple ChoCH – BoS declines → selling pressure still leads in the short term.
• However, the OB Buy 4,184–4,170 zone remains a crucial structural bottom, where buyers react strongly once swept.
• Above, the market leaves a Liquidity Sell area at 4,261, a natural target if gold gathers enough liquidity below.
→ The current phase is liquidity gathering before making a big move.
💎 Key Levels – Price Zones to Watch
🔸 Resistance / Sell Zone
• 4,218 → intraday resistance, price reacts multiple times.
• 4,243–4,244 → confluence of sideways peak + old BoS.
• Liquidity Sell: 4,261 → extended target if price breaks strongly upwards.
🔸 Support / Buy Zone
• 4,200–4,201 → short-term price balance zone.
• OB Buy 4,184–4,170 → strong demand, where the previous trend initiated.
• If breaking 4,170 → price may sweep deeper but remains in the ideal discount zone for BUY hunting.
🎯 Trading Plan – Clear and Easy to Follow
1️⃣ Main Scenario – Prioritize BUY at OB 4,184–4,170
Expect the market to create a sweep below 4,200, touching OB Buy to gather liquidity before bouncing up.
BUY Conditions:
• Price touches 4,184–4,170
• Reversal signals appear on M15–H1: pin bar, engulfing, rising ChoCH
• Decline slows down or buying force becomes clear
Targets:
• TP1: 4,190
• TP2: 4,200
• TP3: 4,215
• TP4 extended: 4,261 (Liquidity Sell)
Invalidation: H1 closes below 4,165 → stay out and reassess the structure.
2️⃣ Secondary Scenario – Short SELL when price retests 4.24x
If the price does not drop immediately but pulls up:
SELL Conditions:
• Retest 4,243–4,244
• Strong reaction appears: rejection wick, declining ChoCH
• Must not close H1 above 4,250
Targets:
• TP1: 4,235
• TP2: 4,225
• TP3: OB Buy 4,184–4,170
Invalidation: H1 closes above 4,250 → stop SELL, shift bias to observe breakout.
3️⃣ Extended Scenario – Sweep peak 4,261
Only activate when:
• Price bounces strongly from OB Buy
• Clear breakout of 4,243 zone
• Structure forms HL → HH
At that point, gold will tend to run straight up to sweep liquidity at 4,261 before the market chooses a new direction.
⚠️ Risk Management Notes
• Do not BUY when price is still within the resistance zone 4,218–4,243.
• SELL is only a short-term strategy, do not go against the major trend if a breakout occurs.
• OB Buy 4,184–4,170 is the zone with the highest probability of triggering an upward wave.

XAUUSD – Brian | After the rate cutXAUUSD – Brian | After the rate cut, Volume Profile still favours further downside
1. Market snapshot
After the rate cut, gold saw a bounce but failed to sustain the upside and is still hovering below last week’s highs.
In the Asian session, price only ticked up slightly before being sold off again – a sign that buying pressure is not particularly strong at these levels.
Risk-on sentiment has returned and the USD is seeing a modest recovery, which is weighing on XAU/USD.
That said, expectations for the Fed to maintain a dovish tone could still cap USD strength in the medium term.
Overall, in the short term Brian still leans towards a downside move, preferring to sell into liquidity above rather than chase buys.
2. Volume Profile view – Key levels to watch
On the H1 chart, Volume Profile highlights three main areas:
VAL – Buy scalping zone: around 4,207
→ Current lower value area, where a short technical bounce may appear.
Liquidity / Sell zone: around 4,222
→ Liquidity pocket above, lining up with VAH and a volume cluster – an attractive area to look for sells if price is pushed back up for a retest.
Deeper buy zone: around 4,166
→ Broader demand area below; if price flushes lower after sweeping liquidity, this is where dip-buying interest may show up.
3. Trade scenarios (for reference)
Scenario 1 – Sell at the 4,222 liquidity zone (primary idea)
Idea: Wait for price to retrace into the 4,222 liquidity zone and then look for rejection signals on H1/M15.
Sell zone: 4,220–4,223
Suggested SL: Above 4,230
Targets:
TP1: 4,207 (VAL)
TP2: 4,190–4,185
TP3: 4,170–4,166 (deeper buy zone)
This setup follows the current bearish bias, using the logic of “sell the rally into high-volume + liquidity zones”.
Scenario 2 – Light buys at VAL 4,207 & buy zone 4,166
Scalp buy at VAL:
Entry zone: 4,204–4,207
Target: bounce back towards 4,217–4,220 and then exit, not a long hold.
Buy at the deeper 4,166 zone (cleaner level):
Entry zone: 4,164–4,168
SL: Below 4,158
TP: 4,190 → 4,210 if a clear bullish candle reaction forms and the Fed does not turn overly hawkish.
Both buy scenarios are purely short-term corrective plays, so position size should be kept modest as the main bias remains to the downside.
Be patient and only start thinking about sells once price tags the 4,222 area – avoid forcing entries when price is stuck in the middle of the range.
In summary: Selling around 4,222 is the primary plan, while buys at 4,207 and 4,166 are secondary strategies that only come into play if there is a clear reaction from Volume Profile and price action.

XAUUSD – Brian | Volume Profile before FedXAUUSD – Brian | Volume Profile before Fed: watch for a rebound to sell down
Market snapshot
Ahead of the Fed's interest rate announcement, gold is moving sideways within a fairly wide range, not yet choosing a clear direction.
In the H1 timeframe, the price fluctuates around the value area, making it very suitable for short-term trading according to the Volume Profile instead of trying to predict the meeting outcome.
Volume Profile – Key price areas
Nearest VAL: around 4.197 – the bottom of the current value area, where there was previous buying support.
Above, the FVG area + VAH/POC cluster is around 4.210 – this is an "air pocket" area where selling pressure can easily appear when the price fills the liquidity gap.
Below, the target for a downward wave if the Fed is not too dovish is around 4.13x (area 4.130–4.135) – coinciding with the old buy zone on the chart.
Trading scenario according to Volume Profile
Watch for a light Buy reaction at VAL 4.197
If the price slides to 4.197 and a nice rejection candle appears on H1/M15, a short scalp buy can be considered:
Idea: capture the rebound from VAL back to the middle/top of the value area, do not hold the position long.
Sell when the price fills FVG around 4.210 (priority scenario)
After the rebound from VAL, the FVG area 4.210 will be where Brian prioritizes watching for a Sell:
Reference sell entry: around 4.208–4.212
TP1: 4.185–4.180
TP2: 4.165–4.160
TP3: area 4.13x (4.130–4.135) if a strong sell-off occurs after the Fed
SL should be placed neatly above the FVG/VAH area (e.g., 4.218–4.220), avoid setting it too far.
Fed context – Why trade cautiously?
The focus this week is the FOMC meeting:
The market is waiting to see if Chairman Powell can create enough consensus to continue cutting interest rates with very few members opposing, similar to the previous 25 bps cut.
If the Fed maintains a dovish tone → USD weakens, yields cool down, gold is likely to bounce back after the sweep.
If Powell signals a "hawkish rate cut" (concern about inflation, cut less – talk tough) → yields rise, gold may complete a deep decline to the 4.13x area before stabilizing again.

PARAGMILKStock is sustaining the upside move, staying above 9ema.
Now a breakout from here may give a good upside move. Overall setup is bullish, but always use the SL even when doing paper trading.
Keep it in your watchlist.
✅ If you like my analysis, please follow me here as a token of appreciation :)
in.tradingview.com/u/SatpalS/
📌 For learning and educational purposes only, not a recommendation. Please consult your financial advisor before investing.

XAUUSD – Brian | H1 Volume ProfileXAUUSD – Brian | H1 Volume Profile: risk of deep decline as market awaits PCE data
Market snapshot
On H1, gold is declining in a rather "clean" structure, continuously creating lower highs and lower lows.
The 4.175 area is currently the nearest support – if breached, the decline could extend another 50–60 points to lower areas.
Price remains below 4.250 USD, as the market awaits PCE data (Fed's preferred inflation measure) to find a clearer direction.
Technical map – Volume Profile & price areas
Important areas today: 4.210 – 4.200 – 4.175 – 4.164 – 4.133
4.210–4.200: upper area, coinciding with the nearest POC/VAH cluster – selling pressure likely when price retraces here.
4.175: short-term support + area with sell-side liquidity; if this area is lost, price could be pulled to a deeper demand cluster.
4.164–4.133: potential Buy zone in a deep decline scenario – Volume Profile shows significant buying occurred around this area previously.
In short: on H1, the trend is down, prioritize selling according to volume; consider buying only when price falls to a lower discount area.
Trading scenario reference
(Not personalized advice – adjust volume & SL according to your account)
Scenario 1 – Sell following the downtrend structure (priority)
Sell area: 4.210–4.200 (POC/VAH + technical retracement area)
Idea: Wait for price to retrace to this area, observe H1/M15 for rejection candles (long upper tail, pin bar, engulfing…) before activating a Sell order.
Suggested take profit areas: TP1: 4.175
TP2: 4.164
TP3: 4.133 (in case of a strong 50–60 point decline)
Scenario 2 – Buy at deep discount area
Buy area: 4.164–4.133
Idea: Only consider buying when price has "dumped" deeply enough into the buy zone, with clear reversal candles on H1.
At that point, this is a technical retracement play, not trying to catch the bottom of a major trend.
Suggested take profit areas:
TP1: return to 4.175
TP2: 4.200
Macroeconomic context – Why is gold still hesitant?
Gold recorded a slight increase on Friday, but remains within the narrow trading range of the week.
Expectations of a dovish Fed continue to pressure the USD, generally supporting gold in the medium term.
However, buyers are waiting for US PCE data before taking larger positions:
If PCE cools significantly → reinforces the story of an early Fed rate cut → gold could easily rebound.
If PCE remains stubborn → market fears a "hawkish rate cut" scenario from the Fed → yields may rise, adding selling pressure on gold.
Risk management
For the Sell scenario, avoid chasing price in the middle of the area – prioritize waiting for a retracement to POC/VAH before entering, with a tight SL above the 4.210–4.215 area.
If participating in the Buy play at 4.164–4.133, consider splitting TP and moving SL to breakeven as soon as TP1 is reached to avoid constant chart monitoring.

XAU/USD hits OB Sell zone; watch for trend confirmation.◆ Market Context
The market is in a phase of forming lower highs after a strong drop from the 4,248 area. The most recent volatility shows the price creating a bearish CHoCH, then confirming a Break of Structure (BOS) — indicating a shift from equilibrium to a bearish bias.
Each recent rally has stopped below previous highs, proving that selling pressure continues to dominate.
◆ SMC & Price Action
• After BOS, the market often returns to test the Order Block (OB) area before continuing the main trend.
• On the chart, the OB Sell is located at 4,215 – 4,217, which is the point of the last push candle before the strong drop.
• This area also coincides with the short-term resistance zone and previous price behavior shows multiple reactions from sellers.
If the price approaches the OB Sell without forming a reversal structure, the likelihood of continuing to decline is high.
Liquidity above:
• 4,230
• 4,241
• 4,248
→ These are areas that may be swept before the price reverses.
◆ Main Trading Scenario
➤ Sell Scenario (priority)
• Waiting zone: 4,215 – 4,217 (OB Sell)
• Condition: appearance of price rejection, reversal pattern, or clear rejection candle
• Targets:
▪ 4,188
▪ 4,172
▪ 4,165 – 4,164 (deep support & bottom liquidity)
• Stop loss: above 4,230
→ This is the most suitable scenario with the current structure.
➤ Extended Scenario (liquidity sweep before decline)
If the price surpasses OB Sell and heads towards liquidity 4,230 – 4,241 – 4,248:
• Observe signs of weakening
• Wait for a reversal pattern
• Look for SELL entry points in the above areas with targets similar to the main scenario
This is common behavior when the market wants to gather liquidity before pushing the trend.
➤ Buy Scenario (opposite – only execute with strong confirmation)
Buy is only suitable when:
• Price breaks the nearest bearish structure
• Closes above 4,230 and holds
• Re-test of the 4,215 – 4,217 area fails
In that case, the buy target will aim for 4,241 and 4,248.
However, this is not yet activated.
◆ Summary
• The short-term trend still leans towards bearish after BOS.
• The 4,215 – 4,217 area is crucial for observing price reactions.
• Selling remains a reasonable strategy until the market breaks 4,230 with a clear signal.
• Downside targets are at 4,172 → 4,165.

XAU/USD H1 Plan: SELL at OB, BUY at Liquidity1. Market Structure (H1)
Gold is in a corrective phase after breaking the previous upward structure. From the nearest peak, the price continuously creates downward BoS waves, confirming that selling pressure is in control in the short term.
Currently, the price is moving within a descending channel and retesting the trendline multiple times but has not been able to breakout. This supports the scenario of the price continuing to complete a deeper decline to gather liquidity before forming a major recovery wave.
2. Important technical zones on the chart
🔹 OB – Sell Zone: 4,190 – 4,197
Confluence of Fibonacci 0.5 – 0.618 of the most recent decline.
This is the H1 supply zone where the price previously broke the downward structure → prioritize observing SELL when the price retraces.
🔹 Liquidity Buy Zone: 4,154 – 4,163
Liquidity cluster located just below the nearest bottom.
This is the area where the market is likely to create a liquidity sweep before reversing upwards.
🔹 Deep Liquidity Zone: 4,115 – 4,12x
Deep liquidity zone, confirmed by multiple old bottoms formed since the beginning of the month.
If the price is pushed down here, this will be a very strong BUY zone for the next major recovery wave.
3. Trading scenarios according to structure – clear & easy to follow
🔸 Scenario 1 – SELL from OB 4,19x (main scenario)
Activation conditions:
Price retraces to OB Sell zone 4,19x
Appearance of reversal signals M15–H1: strong rejection candles, ChoCH down, engulfing
Targets:
TP1: 4,163 (Liquidity)
TP2: 4,154
TP3 extended: 4,12x – 4,115
Note: This OB zone is a beautiful confluence – if the price reacts strongly, there is a high chance the market will complete the decline according to the model.
🔸 Scenario 2 – BUY according to Liquidity Sweep (priority after SELL)
After completing the decline to liquidity zones:
BUY Zone 1: 4,154 – 4,163
Wait for bottom sweep & ChoCH up → BUY according to recovery wave
BUY Zone 2: 4,115 – 4,12x (strongest Buy)
If the price breaks through the Liquidity zone 4,15x
This is the zone where the largest buying force may appear → expect to create a new H1 bottom
Targets for both BUY zones:
TP1: 4,195 (OB Sell retest)
TP2: 4,210
TP3 extended: 4,23x – 4,24x
Further: 4,25x – 4,27x (Fibo 1.272 – 1.618)
4. Important notes & risk management
Do not BUY when the price is standing in the descending channel – wait for sweep & confirmation.
SELL is only valid when the price hits exactly OB 4,19x, avoid FOMO selling in the middle of the zone.
BUY is invalid if H1 breaks deeply below 4,110.
Strong upward scenario only activates when H1 closes above 4,200.

XAU/USD: Gold Rejected at 4,228, Risks Drop to 4,172Gold is struggling in its recovery efforts as prices continue to react negatively at the resistance zone of 4,228. Although the USD shows slight signs of weakening, the overall market sentiment remains cautious as investors await inflation data and new signals from the Fed next week.
In this context, the short-term structure indicates that gold is leaning towards a corrective downtrend – aligning with the sell strategy on the rebound.
📊 MMF Technical Outlook (M30)
🔸 1. Rising Wedge Pattern Has Broken Down
Gold has just broken the “rising wedge” pattern – a clear signal of weakening momentum. The current rebound is merely a retest of the broken structure zone, easily forming a lower high → continued decline.
🔸 2. Important Supply Zone
4,226 – 4,229 → Supply Zone + the starting point of the previous strong decline
If the price touches this zone with weak signals, sellers are likely to regain dominance.
🔸 3. Liquidity Zone – Price Attraction Target
4,172 – 4,173 → Liquidity zone + strong demand + wedge bottom
This is the zone where the market is likely to pull the price during the session.
🎯 MMF Trading Plan – Priority to SELL
▶️ Main Scenario – SELL on the rebound
If the price rebounds to the supply zone:
🔹 SELL zone: 4,226 – 4,229
🔹 SL: above 4,235
🔹 TP1: 4,190
🔹 TP2: 4,172 (main target)
Reason: Price retests the broken resistance + downward momentum remains strong → attractive R:R entry.
▶️ Alternative Scenario – Price drops directly
If the price does not rebound sufficiently to 4,228:
🔹 Wait for a small retest around 4,205 – 4,208 → SELL
🔹 Target remains 4,172
🧭 MMF Daily Bias
Preferred trend: Bearish as long as the price is below 4,228
Strategy: Sell on the rebound – target 4,172
Invalidation: M30 candle closes above 4,235
Note: Volatility may increase near important US news.

XAU/USD: Pullback to OB & Fibo, then upward trend!1. Market Cont1. Market Context
In the M30 timeframe, the price is in a correction phase after forming a strong bottom area around 4,192–4,195. From there, the market has generated a series of positive signals: the price line gradually moves higher, with consecutive CHoCH appearances, indicating weakening selling pressure and a shift in cash flow towards accumulation.
The resistance area of 4,230–4,240 remains a significant barrier. If it is broken with a clear closing candle, the upward structure will be confirmed, and the price may expand to higher areas.
2. Key Price Areas (SMC Mapping)
Upper Resistance
4,230–4,240: strong reaction area, acting as the first barrier.
4,255–4,256: the next expansion area when the upward trend is confirmed.
4,289–4,290: the final target in the expansion structure of the upward wave.
Support Area – Buying Point
4,200–4,216: OB combined with Fibo area, where the price may adjust to regenerate liquidity before rising.
4,192–4,195: strong low area, where the market has reacted strongly before.
3. Fibo & Price Action
In the current upward move, the price has approached the 0.786 Fibo and encountered resistance at 4,230–4,240. A correction to the 0.382–0.5 area (corresponding to OB 4,200–4,216) would be reasonable before the market continues to retest higher areas.
Notable price action signals:
The consecutive appearance of bullish CHoCH indicates that buying pressure is in control.
The 4,192 low is still protected and acts as an important low of the recovery phase.
If the price retests the OB cleanly, this is a good trigger point for a new upward move.
4. Trading Plan
Preferred Scenario: Buy according to structure
Buy Waiting Area: 4,200–4,216 (OB + Fibo)
Stop Loss: below 4,192
Targets:
4,230–4,240
4,255
4,289–4,290
Confirmation Conditions
The price needs to clearly break the resistance area of 4,230–4,240 to trigger upward momentum.
The retest of the OB must occur with reduced liquidity and a confirming candle pattern.
5. Summary
The market structure shows a short-term upward trend is forming. The price is likely to adjust to the 4,200–4,216 area before continuing upwards to 4,240 and further to 4,255–4,290.
The appropriate strategy is to wait to buy in the OB & Fibo area under the condition of clear confirmation signals.

XAU/USD: Gold Consolidates, Awaiting Pullback for Breakout📊 Market Structure (H1)
Gold is moving within a converging triangle pattern – with the bottom being pushed higher by buying pressure, while the top is continuously blocked by the H1 descending trendline.
After the previous strong decline, the market has consecutively created bullish ChoCH , indicating that capital flow is starting to return, but the pivotal supply remains at the OB Bearish 4.23x area – where the price is currently stuck.
Currently, the price is testing the upper edge of the triangle + supply area, which is primarily used for distribution and liquidity sweep. → Not an optimal area for FOMO BUY.
💎 Key Levels – Important Areas
• OB Bearish – 4.23x: confluence with descending trendline → high probability area for strong reaction or Liquidity Sweep.
• FVG – 4.21x: H1 price gap, the market tends to return to fill before continuing.
• OB Bullish – Buy Zone – 4.201: H1 demand + lower edge of current range → priority area to observe BUY according to trend.
• Liquidity Buy – 4.170: lower liquidity area → price may sweep deep before bouncing strongly if the medium-term uptrend remains effective.
• Upper Target – 4.25x: expanded target if gold successfully breaks the converging triangle.
🎯 Trading Plan – Trading Scenarios
1️⃣ Priority Scenario: Pullback to OB Bullish
If the OB Bearish 4.23x area reacts (wick rejection, reversal pattern, weakening momentum), expect the price to retreat to:
→ FVG 4.21x
→ OB Bullish 4.201
At the 4.20x area, if a bullish ChoCH / engulfing / strong pin bar appears, this will be a reasonable BUY area according to the trend.
Suggested TP:
• TP1: FVG 4.21x
• TP2: Retest OB Bearish 4.23x
• TP3 expanded: 4.25x area if price breaks the triangle
Invalidation: H1 closes below 4.195 → stay out and wait for reaction at Liquidity 4.170.
2️⃣ Alternative Scenario: Deep Sweep to Liquidity Buy
If OB Bullish 4.20x does not hold and the price breaks down strongly, do not catch the falling knife.
→ Wait for gold to reach Liquidity Buy 4.170
→ Observe reaction: long wick, selling pressure depletes, new HL formation…
Only BUY again when the signal is clear.
If the 4.170 area is broken strongly by an H1 candle → temporary uptrend structure loses effectiveness, reduce volume or stay out until the market stabilizes.
⚠️ Risk Management
This is a trading plan based on an idea – not an immediate entry signal.
Do not BUY directly at the 4.23x resistance area.
Be patient for a pullback to the discount area (4.20x – 4.17x) and always set clear risk.
“Liquidity tells the truth — structure confirms the path.” ⚜️
⏰ Timeframe: H1
✍️ Analysis by: Captain Vincent

Price hits FVG: Get ready for Market Maker's next move!In the current market context, the price structure is clearly showing the regulation of Smart Money as it continuously creates new liquidity zones, breaks structures, and leaves important footprints like OB – FVG – BOS. Below is a trading plan built based on the observed price zones on the chart:
🟥 1. Market Context – Role of OB Sell
Price has reacted strongly at the Order Block Sell in the 4,237 – 4,256 zone.
This is where a strong push down occurred (accompanied by a structure break – BOS), confirming this as an active supply zone.
➡️ This will be the key level to monitor all pullbacks in the coming time.
🟩 2. Current Market Structure – Market Structure
After the OB Sell is activated, the market creates a bearish BOS.
Price is moving down to approach the Liquidity Buy below in the 4,154 – 4,161 zone.
On the way, price leaves a Fair Value Gap (FVG) – a zone that can be used as a retracement point to continue selling.
➡️ Overall bias: Bearish intraday – favor sell on pullback.
🟨 3. Main Trading Plan – SELL SETUP
🎯 Area of Interest
FVG: 4,197 – 4,214
This is the ideal price zone for price to return to balance before continuing the downtrend.
📌 Entry SELL:
Preferred scenario: Price retraces to fill FVG → reacts → creates a small bearish structure (BOS M1–M5) → Sell.
🎯 Targets:
TP1: 4,170 — intermediate support zone
TP2: Liquidity Buy: 4,154 – 4,161
TP3 (extended): 4,144 if liquidity below continues to be swept
🛑 Stop Loss:
Above the FVG peak or above the nearest OB zone: 4,214 – 4,227
➡️ High probability when price fails to break 4,214–4,227 and continues to create lower highs.
🟦 4. Secondary Scenario – SHORT-TERM BUY (Countertrend)
Only activated when price hits Liquidity Buy and a clear reversal signal appears:
📌 Entry BUY:
After sweeping liquidity in the 4,154–4,161 zone
Wait for bullish BOS confirmation on a lower timeframe
🎯 Targets:
4,184
4,197
4,214 (maximum – hit FVG and exit)
➡️ This is just a retracement trade, not trend-following, so risk management is crucial.
⭐ 5. Summary View
The market is moving in line with Smart Money behavior:
Sweep liquidity above (Sell-side Liquidity) → Create OB → Push price down
Leave FVG → Attract price back → Continue distribution
Main goal: Sweep Liquidity below
👉 The main trend remains SELL until the Liquidity Buy below is hit and a strong reversal structure is created.

XAUUSD –| watch reaction at POC – VAL – VAH according to VolumeXAUUSD – Brian | watch reaction at POC – VAL – VAH according to Volume Profile
1. Market snapshot
Gold is entering a redistribution phase in the high price range, with fluctuations mainly revolving around large volume clusters on the Volume Profile. In this context, Brian's current priority scenario is to watch for a Sell when the price approaches the POC / VAL / VAH areas – where the market previously traded heavily.
2. Volume Profile – Notable price areas
POC – VAH area 4.217 is the price area where buyers/sellers previously "struggled" strongly, suitable for looking for sell signals if there is a rejection reaction.
VAL & the support area below around 4.134 is where short-term buying force may appear, suitable for a technical rebound buy scenario.
3. Trading plan (this week)
Scenario 1 – Sell according to Volume Profile (priority)
Sell: 4.217
SL: 4.125
TP: 4.200 – 4.182 – 4.150
Idea: wait for the price to rebound to the POC/VAH area around 4.217, observe the H1/M30 candle reaction. If a clear rejection signal appears (long upper tail, reversal candle...), the sell order can be activated according to the plan.
Scenario 2 – Short buy at VAL/support area
Buy: 4.134
SL: 4.125
TP: 4.155 – 4.180 – 4.200
Idea: if the price adjusts deeply near the VAL area and holds above 4.125, a technical rebound may occur. This is a short buy, not going too far against the trend, prioritizing partial profit-taking when the price returns to the upper POC area.
4. News to watch – Unemployment Claims
Today there are US Unemployment Claims figures, which are quite sensitive data for gold because:
The market will assess the strength/weakness of the US labor market.
Worse-than-expected figures → increase the likelihood of Fed easing → positive for gold.
Better-than-expected figures → support USD, may cause gold to face adjustment pressure.
Therefore, it is advisable to limit new orders close to the news release time, wait for the post-news candle to stabilize, and then reassess the structure.
5. Risk management (user-friendly for phone users)
Sell is the priority scenario but do not overlook SL 4.125, to avoid the case of a strong breakout above the current volume cluster.
With the Buy 4.134 scenario, it is advisable to split TP, move SL to breakeven when the price hits TP1 to reduce the pressure of having to "watch the chart" continuously on the phone.
If D1/H4 closes below the 4.125 area with large volume, Brian will consider it a signal to reduce short-term buying expectations and wait for a clearer new structure.

XAU/USD – Gold Accumulating Before Rising, Monitor BUY at📊 Market Structure
Gold is in an accumulation phase after a short-term drop creating ChoCH at lower price levels.
The current structure shows that the price has formed an Equal High (EqH) around 4,235 – a sign that the market may be holding liquidity above to support the next push.
The price returns to test the area 4,192 – 4,193 USD — this is the nearest support zone, and also the point where previous buying pressure created an upward BoS . If this area continues to hold, the short-term upward structure will be reactivated.
💎 Key Technical Zones
• Support Zone (Buy Zone): 4,192 – 4,193 USD
• Invalidation: below 4,170 USD
• Target 1: 4,237 USD
• Target 2: 4,249 USD
• Target 3: 4,264 USD
• Target 4: 4,284 USD
• Liquidity Zone: 4,323 USD
🎯 Trading Plan – BUY Priority
1️⃣ BUY Setup – Retest Support 4,192
If the price retests the area 4,192 – 4,193 and a bullish candlestick signal appears (rejection / engulfing):
• Entry: 4,192 – 4,193
• SL: 4,170
• TP1: 4,237
• TP2: 4,249
• TP3: 4,264
• TP4: 4,284
• TP5: 4,323 (sweep liquidity EqH)
→ This is a setup in line with the short-term trend, as liquidity above the EqH peak remains and is likely to be swept.
2️⃣ SELL Scalp – For Intraday Traders Only
If the price retests higher resistance zones and reacts with a strong decline:
• Waiting SELL Zone:
– 4,249
– 4,264
– 4,284
• Short TP: back to 4,225 – 4,216
→ This setup only trades against the trend when clear rejection is observed.
🧠 Vincent’s View
The current trend still supports the continuation of the upward expansion.
The 4,192 USD area is crucial: holding this area → prioritize BUY; losing this area → the market will need to sweep deeper before rising again.
⚡ “Follow the liquidity — the market always returns to collect what it left behind.”
⏰ Timeframe: 1H
📅 Update: 03/12/2025
✍️ Analysis by: Captain Vincent

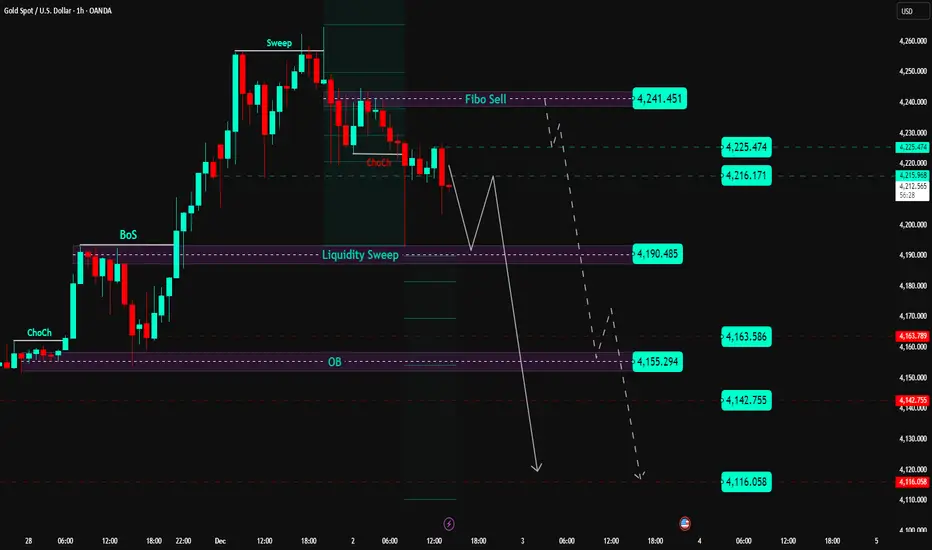
XAU/USD: Peak Sweep Done, Price Distributing in Premium📊 Market Structure
• After a strong bullish leg, Gold formed a clear Liquidity Sweep at the highs around 4,261 USD (Fibo Sell) , taking out all liquidity above that zone.
• From that high, price gradually weakened and printed a bearish ChoCH (loss of buying pressure; short-term structure no longer clean).
• Price is currently trading inside the premium zone between 4,190 – 4,241:
– 4,241 = Fibo Sell / liquidity extreme .
– 4,225 – 4,216 = lower premium zone , likely to react before retesting the highs.
– 4,190 = Liquidity Sweep + short-term support : only if price breaks below and retests from underneath will this zone flip into resistance for SELL continuation.
⇒ Current picture: short-term bearish bias , but sells should come from the premium zones (4,216–4,241) or only after a confirmed break of 4,190 — avoid chasing mid-range.
💎 Key Technical Zones
• Fibo Sell Zone: around 4,241.451 → optimal extreme for hunting SELL setups.
• Reaction Levels:
– 4,225.474
– 4,216.171
• Liquidity Sweep Support: 4,190.485 → main short-term support.
• Support / TP Zones:
– 4,163.586
– 4,155.294 (old OB)
– 4,142.755
– 4,116.058 (deeper low – extended target)
🎯 Trading Plan – SELL Priority From Premium
1️⃣ Primary SELL – Fibo Sell 4,241 & Premium 4,225–4,232
Ideal scenario: price retraces into the upper premium zone and prints a clear rejection signal (pin bar / engulfing / rejection volume).
• Entry 1: 4,225 – 4,232 (first scale-in)
• Entry 2: 4,235 – 4,241 (add if price sweeps higher)
• Stop Loss: above 4,250
• TP1: 4,190
• TP2: 4,163
• TP3: 4,155
• TP4: 4,142
• TP5: 4,116
→ Classic “sell the premium” setup: wait for price to return to the swept highs — avoid FOMO in the middle.
2️⃣ SELL Continuation – After Breaking 4,190
Only valid if we get a clear H1 close below 4,190 , confirming the Liquidity Sweep zone has been violated and flipped into resistance.
• Condition: H1 close below 4,190 → wait for a retest of 4,190–4,195 from underneath
• Entry: 4,190 – 4,195
• SL: above 4,205
• TP1: 4,163
• TP2: 4,155
• TP3: 4,142
• TP4: 4,116
→ This setup is only for traders who prefer clean continuation after a confirmed break of support.
3️⃣ Countertrend BUY – Only From Deep Zones
• Aggressive: watch for reactions at 4,163 – 4,155 . If strong rejection appears, consider a technical BUY retracement toward 4,190 – 4,216 (scalp).
• Conservative: wait for a deep test of 4,116 (stronger demand zone) before searching for BUY setups.
→ This is strictly countertrend; only take it if strong confirmation appears. Otherwise, skip and focus on SELL opportunities in premium zones.
🧠 Vincent’s View
Gold is currently “hanging” within premium after a very clean top sweep.
The safest strategy is to let price return to 4,225–4,241 before selling, or wait for a confirmed break of 4,190 to play continuation. Avoid selling directly at 4,190 while it still acts as support.
“Sell the premium, respect the levels – liquidity never lies.” ⚜️
⏰ Timeframe: 1H
📅 Updated: 02/12/2025
✍️ Analysis by: Captain Vincent
Lets Create and Backtest a Simple Strategy from literally ZeroI make educational content videos for swing / positional trading .
In this video I will be using 3 months old chart along with one example of how to approach any trade or price action with literally zero lines and zones on screen .

XAUUSD Elliott H1:waiting for ABC correction in a strong uptrendXAUUSD – Elliott H1: waiting for ABC correction in a strong uptrend
Brian – Short sell correction, prioritize Buy according to the major trend
1. Market snapshot
On H1, gold has just broken the upward Dow structure and completed 5 small waves – a common signal before an ABC correction.
The larger trend is still a very strong uptrend: gold is on track for its best year since 1979, up more than 60% in 2025, with the YTD performance gap between XAU and BTC continuing to widen.
Therefore: selling is only a short-term strategy, while the priority position for next week remains to buy on deep corrections.
2. Technical structure – Elliott H1
H1: 5 upward waves have completed → the base scenario is for the price to create a wave A down – B retrace – C down before continuing the trend.
The price area above 4,227–4,238 is a zone with selling liquidity + retesting the structure after breaking the H1 peak.
The 4,183–4,173 area (Fibo 0.618 of the most recent increase) is the main demand zone, reasonable to watch for buying in line with the trend with a good R:R.
3. Trading plan for next week
Scenario 1 – Short sell ABC correction (counter-trend)
Idea: take advantage of the A/B correction wave after 5 upward waves on H1.
Sell watch area: 4,227–4,238
SL: 4,246
Reference targets:
TP1: area 4,200–4,195
TP2: towards the Fibo/Buy zone 4,183–4,173
Note: this is a counter-trend order, only suitable for accounts accepting intraday risk, volume should be smaller than buy orders.
Scenario 2 – Buy according to the major trend at Fibo 0.618 (priority)
Idea: wait for the ABC correction to complete, buy at the "discount" price area according to Elliott and Fibo.
Buy watch area: 4,183–4,173 (Fibo 0.618 + technical support area).
SL: 4,166
Target direction:
Initially: return to the 4,220–4,230 area
Extended: depending on developments, it may aim for new highs in the context of a record growth year.
4. Fundamental context – Why prioritize Buy on deep corrections?
Gold increased +6% in November, marking the 4th consecutive month of gains.
Previously it was +3.7% in October and +11.9% in September – a very rare series of increases, reinforcing the long-term bull market story.
When an asset has risen strongly but still maintains momentum for many consecutive months, ABC-type corrections on H1 are often just opportunities for new money to participate, rather than trend reversals.

XAU/USD: Buy Gold at 4,217 or FVG 4,182!📊 Market Structure
Gold continues to maintain a strong upward structure after creating a series of BoS continuously from the 4,156 USD region.
This morning's H1 breakout pushed the price above the short-term peak, confirming that the BUY side is in full control.
The price is currently returning to retest the Demand intraday 4,217 – 4,210 USD area — this is the first support area where buyers can continue to push the upward wave.
If the pullback is deeper, gold may reach the FVG 4,182 – 4,172 USD area, coinciding with fibo 0.5 – 0.618 → the most attractive discount area in this wave.
The main trend remains bullish as long as the price stays above:
• 4,217 – Demand 1
• 4,182 – FVG Discount
• 4,156 – Key Demand Zone
💎 Key Technical Zones
• Demand Zone 1: 4,217 – 4,210
• FVG Discount: 4,182 – 4,172
• Strong Demand (structure holding bottom): 4,156
• Target Zones:
– 4,285
– 4,309
– 4,321
– 4,342
– 4,369 (liquidity above peak)
🎯 Trading Plan – Prioritize BUY
1️⃣ BUY 1 – Retest Demand 4,217
When the price touches 4,217 – 4,210 with confirmation signals (long wick, H1 engulfing).
• Entry: 4,217 – 4,210
• SL: below 4,200
• TP1: 4,285
• TP2: 4,309
• TP3: 4,342
• TP4: 4,369
→ Quick setup – follow the momentum.
2️⃣ BUY 2 – Deep Pullback to FVG 4,182
In case the price shakes strongly before continuing to push the wave.
• Entry: 4,182 – 4,172
• SL: below 4,156
• TP: 4,217 → 4,285 → 4,342
→ This is the “best” price area to accumulate BUY in the session.
🧠 Vincent’s View
H1 shows a strong upward structure, clear momentum. The current adjustment is just a technical pullback before hitting the upper liquidity levels.
As long as gold stays above 4,182 – the trend remains bullish and the targets 4,285 – 4,342 are entirely feasible.
“Smart money buys the dip — not the hype.” ⚜️
⏰ Timeframe: 1H
📅 Updated: 01/12/2025
✍️ Analysis by: Captain Vincent

Vimta Labs Limited - Breakout Setup, Move is ON...#VIMTALABS trading above Resistance of 607
Next Resistance is at 1113
Support is at 498
Here are previous charts:
Chart is self explanatory. Levels of breakout, possible up-moves (where stock may find resistances) and support (close below which, setup will be invalidated) are clearly defined.
Disclaimer: This is for demonstration and educational purpose only. This is not buying or selling recommendations. I am not SEBI registered. Please consult your financial advisor before taking any trade.

XAUUSD – Ascending Channel in Play, Upside Target Towards 4,240
Brian – Focusing on buying the dip, watching for short setups near upper resistance
Market overview & structure
On the H4 chart, gold is moving neatly inside a well-defined ascending channel, with higher highs and higher lows. The current leg is pointing towards the 4,237–4,240 region, which aligns with:
The upper boundary of the channel.
A key resistance zone.
The 1.618 Fibonacci extension and resting liquidity above recent highs.
This keeps the broader bias bullish, but as price approaches 4,240, the probability of profit-taking and short-term selling pressure naturally increases.
Wave & technical context
The current move is an extension of the previous bullish structure after price broke out of the old bearish channel and started to consolidate in a new bullish one.
Liquidity levels around 4,193 and above suggest that the market has been building positions and has room to drive price into higher resistance.
The buy zone highlighted near the lower boundary of the channel, around 4,154–4,157, is where buyers are likely to step back in to defend the trend.
As long as price holds above 4,150–4,154, the scenario of a continuation towards 4,240 remains the higher-probability path.
Key zones & trading plan
Primary scenario – Buy with the trend inside the channel
Buy zone: 4,154–4,157 (channel support + marked buy zone).
Idea: Wait for a pullback towards the lower boundary of the channel, or a brief liquidity sweep into this zone, followed by a clear rejection candle on H1/H4 before entering long.
Targets:
Short-term: 4,190–4,200 (mid-channel / interim liquidity).
Extended: 4,237–4,240 (major resistance + 1.618 Fibonacci extension).
This is a trend-following “buy the dip” setup suitable for swing or short-term positional traders.
Secondary scenario – Short-term sell from 4,237–4,240
Sell zone: 4,237–4,240 – the confluence of strong resistance and the 1.618 Fibonacci extension.
Idea: If price tags this zone and shows clear rejection (long wicks, bearish reversal pattern on H1/M15), it may offer a counter-trend short back towards the mid-channel or 4,190–4,200 support.
This is a short-term, counter-trend idea, so:
Position size should be smaller than the main long setup.
Stop loss should be kept tight above 4,240 and not dragged wider out of emotion.
News & broader context
Liquidity conditions may thin out towards the end of the day due to the ongoing Thanksgiving holiday period in the US, which can lead to sudden spikes and stop hunts, especially around obvious liquidity pools.
On the political side, headlines such as Mr. Trump’s comments about “permanently suspending immigration from third-world countries” add to general policy uncertainty, but the impact on gold is mostly indirect through broader risk sentiment.
Another interesting point: silver has been rallying strongly, supported by solar-energy demand and supply concerns. It is acting like a “silent workhorse”, attracting fresh capital. This does not remove gold’s role, but shows that precious metals as a whole are gaining attention.
Strategy & risk management
For now, my focus remains on buying dips around 4,154–4,157 in line with the ascending channel, and only looking for short, tactical sell setups if price clearly rejects 4,237–4,240.
I prefer to avoid entering fresh trades when US liquidity is very thin or right into major holiday sessions, as spreads can widen and price action can become erratic.
Once price closes decisively below the buy zone and breaks the channel structure, this bullish plan loses validity, and it is better to step aside and reassess rather than forcing trades.
What do you think – does this channel still favour the bulls, or are you expecting a deeper correction from the 4,240 region? Feel free to share your view in the comments.

XAU/USD: Gold Stagnates, Poised for a Strong Surge📊 Market Structure
Gold is moving in a tight accumulation phase (compression) between two important zones:
• OB Support: 4,130 – 4,126
• Resistance – Small Supply: 4,148 – 4,166
The previous trend remains a strong uptrend (clear BoS sequence from 4,089), and currently, the price is retesting the newly formed peak-bottom structure.
The BUY side is still in control as long as the price stays above:
• 4,130 – Main OB Support
• 4,104 – Discount FVG
• 4,089 – Key Low Confirming Trend
If gold holds these zones, the next targets will be the upper liquidity levels:
• 4,166
• 4,181
• 4,207
• 4,243
💎 Key Technical Zones
• OB Support 1: 4,130 – 4,126
• FVG Zone: 4,104 – 4,089 (best discount)
• Deep Bearish OB: 4,060 – 4,045 (if price drops sharply)
• Upper Liquidity Targets: 4,166 → 4,181 → 4,207 → 4,243
🎯 Trading Plan (Priority BUY)
1️⃣ BUY 1 – Retest OB 4,130
When the price touches the OB support zone 4,130 – 4,126 and shows a bounce signal (rejection / engulfing).
• Entry: 4,130 – 4,126
• SL: below 4,115
• TP1: 4,166
• TP2: 4,181
• TP3: 4,207
• TP4: 4,243
→ Quick setup, good RR, trend aligned.
2️⃣ BUY 2 – Discount FVG 4,104 – 4,089
This is the best BUY zone if the market drops sharply before rising.
• Entry: 4,104 – 4,089
• SL: 4,070
• TP1: 4,166
• TP2: 4,181
• TP3: 4,207
• TP4: 4,243
→ Strong confluence: FVG + fibo discount + key liquidity.
3️⃣ BUY 3 – Deep Accumulation at Bearish OB Shift
• Entry: 4,060 – 4,045
• SL: 4,020
• TP: 4,104 → 4,166 → 4,207
→ Only activate if “flush liquidity” appears.
🎯 SELL Scalp (secondary – not priority)
Only SELL when there is a clear rejection reaction at:
• 4,166 – first liquidity sweep zone
• 4,181 – strong reaction zone
• 4,207 – main bearish OB
• 4,243 – large liquidity peak
• SL: 10–15 USD
• TP: 4,148 → 4,130
→ For scalpers only, not a main setup.
🧠 Vincent’s View
The market structure remains completely bullish. The market is accumulating energy in a narrow range before breaking strongly to the upper liquidity targets.
As long as gold stays above 4,089 – the uptrend remains dominant.
“Patience builds the entry – liquidity completes the move.” ⚜️
⏰ Timeframe: 1H
✍️ Analysis by: Captain Vincent

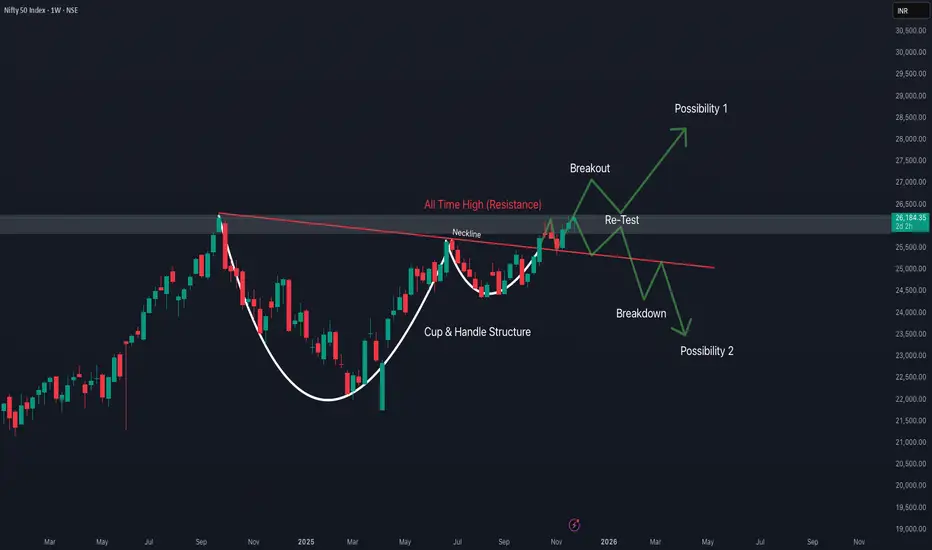
Weekly Price Action in Nifty 50The chart shows a classic Cup & Handle pattern
The cup is wide and smooth – a strong long-term accumulation pattern.
The handle is small, healthy, and formed near resistance → a sign of strength.
These patterns on the weekly chart typically lead to multi-month rallies.
The chart structure is strongly bullish unless Nifty falls below 25,500.
XAU/USD: Gold Bullish, Waiting for Perfect Buy Pullback📊 Market Structure
Gold is maintaining a strong bullish structure after a series of BoS from the bottom region. The most recent rally broke the 4,130 mark and continues to hold above the small OB area, indicating that the BUY side is still in control.
Currently, the price is slightly retracing to retest the structure — the target is to test the area:
• OB 4,130 – 4,126 USD
• Or deeper to FVG 4,104 – 4,089 USD
In both cases, these are discount areas to continue BUYING according to the main trend.
The larger trend still targets the upper liquidity levels including:
• 4,151
• 4,181
• 4,207
• 4,243
💎 Key Technical Zones
• OB Retest Zone: 4,130 – 4,126 (quick bounce area)
• FVG Zone: 4,104 – 4,089 (best discount area to BUY)
• Large Bearish OB: 4,045 – 4,060 (final area if price adjusts deeply)
• Target Zones: 4,151 – 4,181 – 4,207 – 4,243
🎯 Trading Plan – BUY (priority)
1️⃣ BUY 1 – Retest OB 4,130
• Entry: 4,126 – 4,131
• SL: below 4,115
• TP1: 4,151
• TP2: 4,181
• TP3: 4,207
• TP4: 4,243
→ This is a quick setup – for a short retracement before continuing.
2️⃣ BUY 2 – FVG 4,104 – 4,089 (best)
• Entry: 4,089 – 4,104
• SL: 4,070
• TP1: 4,151
• TP2: 4,181
• TP3: 4,207
• TP4: 4,243
→ This FVG area is a strong confluence: fibo, small demand, and trendline.
3️⃣ BUY 3 – OB Bearish shift (deep entry)
• Entry: 4,045 – 4,060
• SL: 4,020
• TP1: 4,104
• TP2: 4,151
• TP3: 4,207
→ Only activate when the market shakes strongly, but RR is extremely good.
🎯 SELL Scalp (secondary – only short trades)
Only SELL when the price reaches strong resistance areas and rejection signals appear:
• 4,151
• 4,181
• 4,207
• 4,243
Entry SELL: only enter when there is H1 rejection
SL: 10–15 USD
TP: back to 4,151 → 4,130
→ This is counter-trend, not a priority setup.
🧠 Vincent’s View
The overall trend is still bullish. The current retracements are just a “breathing phase” – the market is accumulating energy to continue pushing up to higher liquidity areas.
As long as the price stays above 4,089 – the bullish trend is not threatened.
“Smart Money buys the dip — Retail buys the breakout.” ⚜️
⏰ Timeframe: 1H
✍️ Analysis by: Captain Vincent
