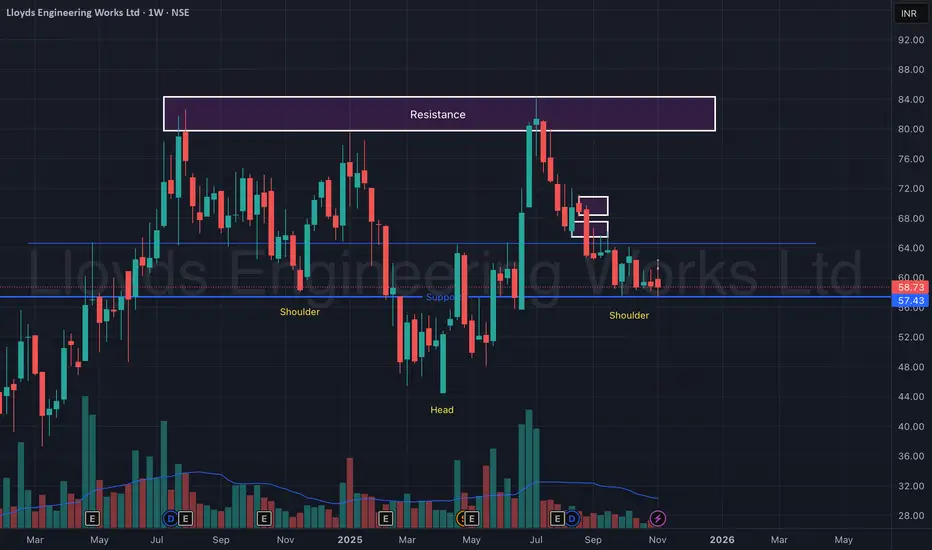
Lloyds Engineering Works Ltd – Ready to Blast from Support Zone!Lloyds Engineering is showing a textbook Inverted Head & Shoulders pattern on the weekly timeframe — a strong reversal formation that often precedes a major uptrend.
The support zone near ₹57–₹58 has held firmly for months, acting as a base for accumulation.
A bullish structure is clearly visible, with both shoulders aligning near the same horizontal support and increasing volumes hinting at smart money participation.
Once the stock decisively breaks above the ₹64 neckline zone, a powerful breakout toward ₹80+ could unfold in the coming weeks.
🎯 Key Levels:
CMP: ₹58.73 (+0.22%)
Pattern: Inverted Head & Shoulders
Support Zone: ₹57 – ₹58 (Strong base)
Neckline / Breakout Zone: ₹64 – ₹66
Target Zone: ₹80 – ₹85
Stop-Loss: ₹54 (Weekly close basis)
📊 Technical View:
Inverted Head & Shoulders forming over a year-long base.
Strong volume spikes near the right shoulder = early accumulation.
EMAs flattening and ready for crossover confirmation.
Sustaining above ₹64 could ignite momentum breakout toward ₹80+.
🧠 View:
Lloyds Engineering looks technically ready for a breakout. With the pattern structure completed and strong volume support, a close above ₹64 can trigger a new uptrend — this one’s “ready to blast.”
Techincalanalysis
XAU/USD – Retest Before Takeoff📊 Market Structure
After several days of fluctuating within a narrow range, gold has finally broken through the main descending trendline extending from the peak of 4,108 USD.
Buyers are currently controlling the short-term structure by continuously creating BoS (Break of Structure) in the price range of 3,965 – 3,980 USD.
The Order Block 3,970 – 3,975 USD area has become an important dynamic support zone , converging with the newly formed trendline.
If the price continues to hold above this area, there is a high possibility of a light retest to absorb liquidity before breaking out to higher resistance zones.
Above, the Resistance 4,028 USD zone is the first barrier to overcome to confirm the medium-term uptrend, while the Liquidity Zone around 4,070 – 4,080 USD is the extended target of the breakout.
💎 Key Technical Zones
• Order Block (Support): 3,970 – 3,975 USD → potential retest area.
• Resistance Zone: 4,028 USD → first profit-taking point for buyers.
• Liquidity Zone: 4,070 – 4,080 USD → extended target if resistance is successfully broken.
🎯 Trading Scenarios
1️⃣ BUY Scenario – Retest OB:
If the price adjusts to the 3,970 – 3,975 USD area and a confirming candle signal appears (bullish rejection / engulfing):
• Entry: 3,972 – 3,975
• SL: 3,960
• TP1: 4,015
• TP2: 4,028
• TP3: 4,070
→ Prioritize trading with the trend after the uptrend structure is confirmed.
2️⃣ SELL Scenario – Reaction at Resistance:
If the price hits the 4,028 – 4,070 USD area and there is a strong reversal signal:
• Entry: 4,045
• SL: 4,065
• TP1: 4,015
• TP2: 3,985
→ Short-term scalp, only activate if a clear rejection signal appears.
🧠 Vincent’s View
Gold is showing signs of transitioning from accumulation to range expansion .
Breaking the descending trendline is the first signal for a new upward move, as long as the OB 3,970 area remains intact.
Buyers can take advantage of pullbacks to increase their position, targeting 4,070 USD – where significant liquidity converges above.
“Break the line, respect the retest — that’s where smart money joins the move.” ⚜️
⏰ Timeframe: 1H
📅 Updated: 07/11/2025
✍️ Analysis by: Captain Vincent

Cholamandalam Financial Holdings Ltd (CFHL) Triangle Breakout 1DCholamandalam Financial Holdings Ltd (CFHL) – Triangle Breakout & 1-Year Resistance Breakout 🚀
📊 Technical View:
CFHL has given a triangle breakout along with a 1-year resistance breakout, indicating strong bullish momentum. If Trend continues, The price action also shows a successful retest of the breakout zone, shows trend continuation.
Resistance Turned Support: ₹1650 – previously a resistance, now acting as strong support.
Current Action: Price broke above the ₹1650 range, retested the level today , and is now moving upward again.
Next Resistance Targets Levels: ₹1824 / ₹2004
Support Levels: ₹1536 / ₹1410
🏦 Company Overview:
Cholamandalam Financial Holdings Limited (CFHL), incorporated in 1949, is a part of the Murugappa Group, one of India’s most diversified business conglomerates.
CFHL is a Non-Deposit Taking Systemically Important Core Investment Company (CIC) registered with the Reserve Bank of India (RBI).
The company holds substantial investments in group companies and provides a diverse range of financial products and risk management services to individual and corporate clients through its subsidiaries and group companies.
📈 For educational purpose only. Not a buy/sell recommendation.

UPL Limited – Weekly Chart Analysis
📊 UPL Limited – Weekly Chart Analysis
Company Overview:
UPL Limited is a global leader in sustainable agricultural solutions, ranked among the top five agricultural solutions companies worldwide. The company operates across multiple countries, offering an integrated portfolio of patented and post-patent agricultural solutions for both arable and specialty crops — including biologicals, crop protection, seed treatment, and post-harvest solutions.
UPL is principally engaged in:
Production and sale of agrochemicals, field crops, and vegetable seeds
Non-agro business of industrial chemicals, chemical intermediates, and speciality chemicals
With market access across the world’s food basket, UPL is focused on driving growth and innovation throughout the entire agricultural value chain — from growers to distributors and partners. 🌱
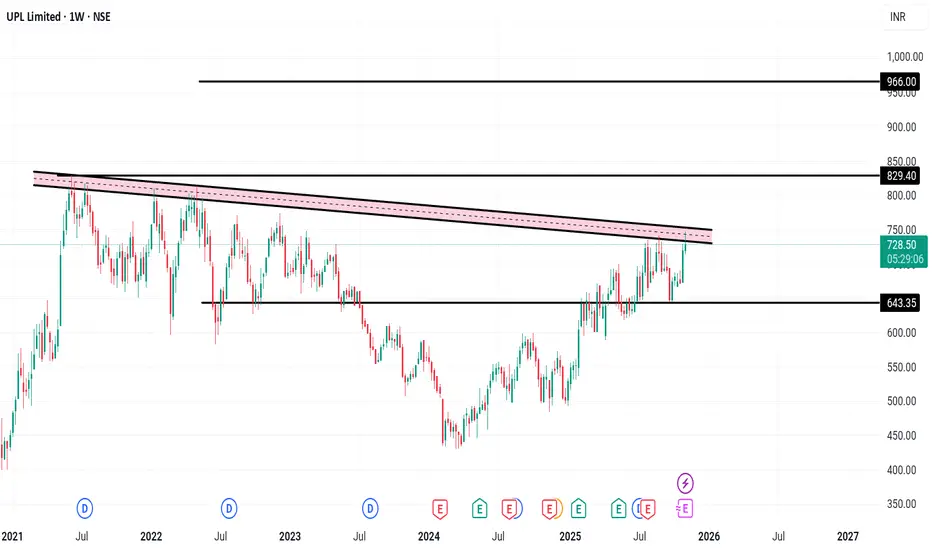
📈 Technical View (1-Week Chart):
A trendline formation is observed on the weekly timeframe, indicating a potential breakout setup.
Resistance: ₹830 – strong resistance zone. A breakout above this level can trigger the next target near ₹930.
Support: ₹643 – strong support base.
This formation suggests the move could take time to play out, as it’s developing over the weekly chart.
📊 Key Financial Snapshot:
UPL’s current market price is around ₹724.15 with a P/E ratio of 11.65. The company holds a market capitalization of ₹61,068.53 crore and offers a dividend yield of 0.83%.
In the latest quarter, net profit stood at ₹612 crore, reflecting a 125.74% increase compared to the previous quarter. Quarterly sales were ₹12,019 crore, showing an 8.38% rise. The company’s Return on Capital Employed (ROCE) is 7.66%, indicating stable operational efficiency.
Disclaimer: For educational purposes only, not investment advice
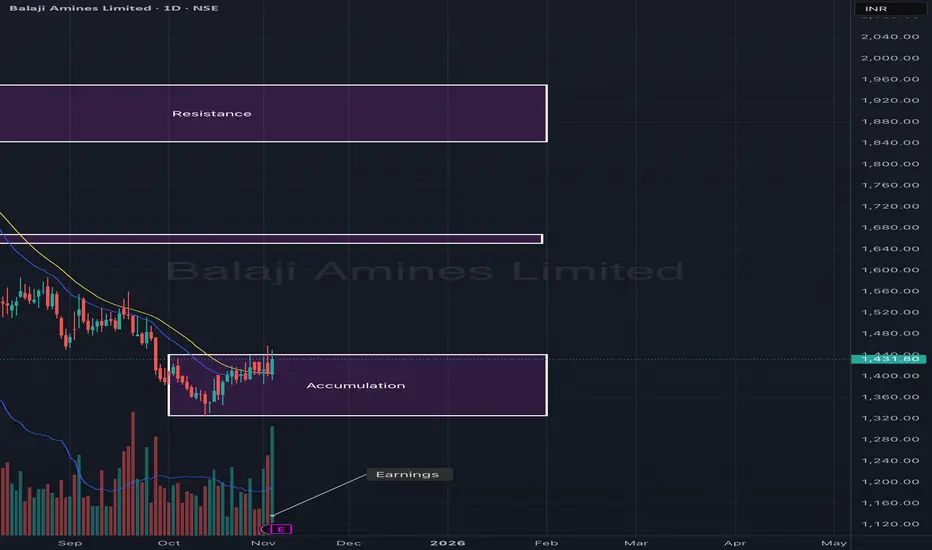
Balaji Amines Ltd – Accumulation Phase Before Potential UpsideBalaji Amines appears to be in a strong accumulation zone after an extended downtrend. The stock has been consolidating between ₹1,350–₹1,450, forming a solid base supported by stable volumes. A sustained move above this range could mark the beginning of a trend reversal and initiate a fresh leg toward the upper resistance levels.
The recent earnings announcement may act as a potential catalyst, as the stock shows early signs of momentum supported by short-term moving average crossovers.
🎯 Key Levels:
CMP: ₹1,431.80 (+1.93%)
Accumulation Zone: ₹1,350 – ₹1,450
Resistance 1: ₹1,650 – ₹1,700
Resistance 2: ₹1,900 – ₹1,950
Stop-Loss: ₹1,340 (on daily close basis)
📊 Technical View:
Price consolidating near the base zone post-correction, signaling accumulation.
Volume stability and EMA alignment suggest early buying interest.
A breakout above ₹1,450 could trigger a move toward ₹1,700.
Sustaining above ₹1,700 may open the next leg toward ₹1,950+.
🧠 View:
Balaji Amines is forming a base after prolonged correction. A close above ₹1,450 with volume confirmation can trigger momentum toward ₹1,700 in the short term, and ₹1,950 in the medium term.
VCP Formation within Symmetrical Triangle above 200 EMAThis chart displays a Volatility Contraction Pattern (VCP) developing within a classic symmetrical triangle on the daily timeframe. Two sharply converging trendlines encapsulate the price action with the lower line connecting a series of higher lows (the trendline) and the upper line linking lower highs (counter trendline). Such convergence is characteristic of symmetrical triangles, which represent a period of price consolidation and equilibrium between buyers and sellers.
Volume tends to contract as the pattern matures, signaling market indecision and reduced volatility. Notably, this consolidation is taking place right around the 200-day moving average, which serves as an important reference point for longer-term market participants. The convergence of price and volume patterns here aligns with textbook VCP behaviour and highlights the potential for significant crowd psychology shifts.
This post’s intent is observational and educational, focusing on the visual behavior of price and volume embedded within technical patterns. Studying such symmetries can strengthen understanding of market structure and technical analysis skills, allowing for systematic review rather than speculative outlooks or trade signals.
RBL BANKStock is maintaining the move above all key EMAs, last Swing Low (242.35) took support at 50 exponential moving average, which is a good sign.
Previous resistance is becoming a support, price is consistently taking support above 20ema.
A move from here may give a good upside move.
✅ If you like my analysis, please follow me as a token of appreciation :)
in.tradingview.com/u/SatpalS/
📌 For learning and educational purposes only, not a recommendation. Please consult your financial advisor before investing.

Suzlon Energy Ltd – EMA Crossover & Volume Confirmation (Daily CSuzlon Energy has shown a bullish EMA crossover on the daily chart, supported by a strong volume burst, signaling renewed buying interest after a corrective phase. The price has reclaimed the baseline resistance zone (₹59–₹61), and a sustained move above it could open the path toward the next major resistance near ₹68.
This setup suggests a potential trend reversal with strong momentum confirmation.
🎯 Key Levels:
CMP: ₹59.99 (+1.27%)
Baseline Resistance: ₹59 – ₹61
Target Zone: ₹67 – ₹69
Support Zone: ₹54 – ₹55
Stop-Loss: ₹53 (on daily close basis)
📊 Technical View:
20 EMA has crossed above 50 EMA, indicating a bullish trend shift.
Volume spike during the crossover adds strength to the move.
Price breakout from consolidation confirms accumulation.
Sustaining above the baseline could trigger a continuation rally toward ₹68+.
🧠 View:
Suzlon Energy is showing early signs of trend reversal after weeks of consolidation. A close above ₹61 with sustained volume can extend momentum toward ₹68, while ₹54 acts as key support.

Real Knowledge of MarketCore Foundational Knowledge
Derivatives Basics: Options are derivative contracts, meaning their value is derived from an underlying asset (stocks, indices, commodities, etc.).
Key Terminology: A trader must be fluent in terms like call options (right to buy), put options (right to sell), strike price, premium, expiration date, intrinsic value, and time value.
Rights vs. Obligations: Understanding that option buyers have the right, but not the obligation, to exercise, while option sellers (writers) have the obligation if exercised, is fundamental to risk assessment.
Leverage: Options offer significant leverage, meaning a small amount of capital can control a large position in the underlying asset, which amplifies both potential profits and losses.

Real value of Market # Entry #Exit #Trail # StoplossThe phrase "Market # Entry #Exit #Trail # Stoploss" refers to the core parameters of a structured trading plan. The "real value" does not imply a single numerical figure, but rather the monetary gain or loss realized from a trade based on how these elements are defined and executed, combined with the discipline to follow them consistently.
Market: The specific financial instrument or market being traded (e.g., a particular stock, currency pair, or commodity).
Entry: The predefined price level or condition at which a trader opens a position. A good entry can offer a favorable risk-to-reward ratio from the start.
Exit: The predefined strategy or points at which a trader closes a position, either to take a profit or to limit a loss. Exits are crucial as they determine the final profit or loss.
Trail: Refers to a trailing stop-loss order, a dynamic risk management tool that automatically adjusts the stop-loss level as the market price moves in the trader's favor. This locks in profits while allowing the trade to continue if the price keeps moving favorably.
Stoploss (SL): A pre-determined price level or percentage below (for a long position) or above (for a short position) the entry price where the position is automatically closed to prevent further losses if the market moves against the trader.

Titan: Breakout Awaited ?Titan is up by almost 4% right now, and a flag pattern is quite visible. Probability of a breakout might be there provided it breaches the hurdle successfully with volume.
7% upside could be seen after the breach.
Note: Just an observation

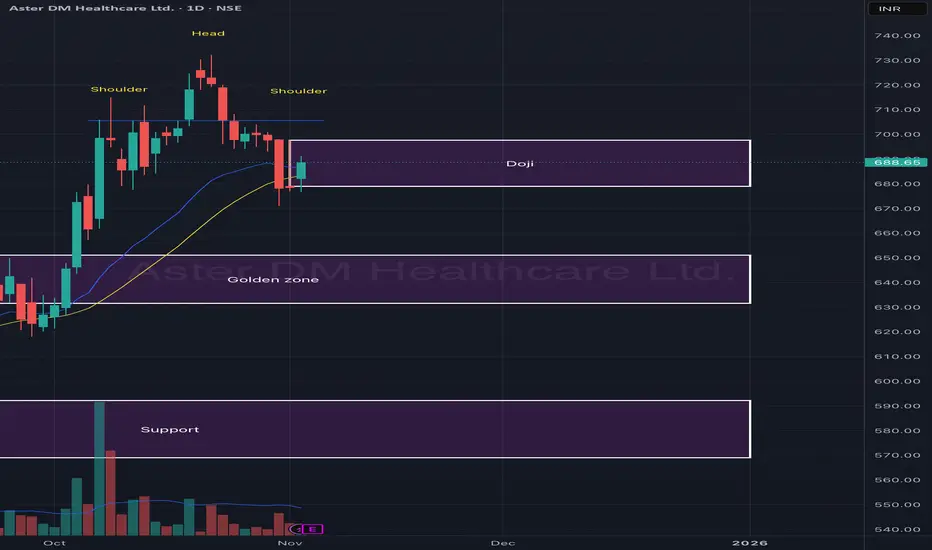
Aster DM Healthcare Ltd – Head & Shoulders Pattern with Doji at Aster DM Healthcare is currently forming a Head & Shoulders pattern, indicating potential short-term distribution after a strong uptrend. The right shoulder has developed with a Doji candle near support — suggesting indecision and possible reversal or continuation depending on the next few sessions.
The stock is hovering around its golden zone (₹640–₹660) — a critical area to watch for either a bounce or a breakdown. Sustaining above this zone can lead to recovery, while failure to hold it could push prices back to the lower support zone.
🎯 Key Levels:
CMP: ₹688.65 (+1.50%)
Pattern: Head & Shoulders
Doji Zone: ₹685 – ₹700
Golden Zone: ₹640 – ₹660 (key retracement area)
Major Support: ₹580 – ₹600
📊 Technical View:
Head & Shoulders structure forming after a sharp rally.
Doji candle shows hesitation near the neckline zone — watch next candle for confirmation.
20 EMA acting as dynamic support; breakdown below it can accelerate selling.
Volume contraction indicates reduced momentum — possible retest ahead.
🧠 View:
Aster DM is at a key decision point. A daily close above ₹700 could invalidate the bearish setup and trigger recovery, while a breakdown below ₹660 may lead to a slide toward ₹600. The Doji formation adds to the significance of the next move.
Accumulated Gold on Support, 3,952 USD is the Gateway for a New 🔍 Market Context
Gold is oscillating within a symmetrical triangle pattern , reflecting price compression and waiting for a breakout signal.
Buyers still maintain a short-term bullish structure, but the series of lower highs indicates increasing selling pressure.
The zone 3,959–3,964 USD is currently the “balance point” — if this area is breached, the downtrend may extend to the lower liquidity zone around 3,929–3,921 USD .
💎 Key Technical Zones
• Resistance Zone: 4,020 – 4,040 USD → the main resistance of the triangle, where strong reactions are likely.
• Support Zone: 3,959 – 3,964 USD → the support zone maintaining the bullish structure.
• Liquidity Zone: 3,929 – 3,921 USD → a low liquidity zone, potentially attracting price sweeps before reversing.
🎯 Trading Scenarios
1️⃣ BUY Setup – Preferred when price holds above support
• Entry: 3,959 – 3,964 USD
• Stop Loss: 3,940 USD
• Take Profit:
– TP1: 3,985
– TP2: 4,020
– TP3: 4,040
– TP4: 4,096
✳️ “Buy the discount” – Buy at the trendline support zone when a confirmation signal appears (rejection or bullish ChoCH).
2️⃣ SELL Setup – Scenario if support breaks
• Entry: 3,950 – 3,955 USD (after closing a candle below the support zone)
• Stop Loss: 3,970 USD
• Take Profit:
– TP1: 3,935
– TP2: 3,925
– TP3: 3,912
✳️ “Sell the breakdown” – Sell when support is clearly breached, targeting the lowest liquidity zone (3,912 USD).
💬 Summary
Gold is in a phase of accumulation before a major move .
If it holds above 3,952 USD → prioritize BUY according to the bullish structure .
If it breaks below 3,952 USD → SELL according to the breakout towards the Liquidity Zone.
The scenario will be clearly confirmed when the current symmetrical triangle is broken.
💡 Today's Tagline:
“Liquidity defines direction — follow where the money hides.”
⏰ Timeframe: 1H
📅 Update: 04/11/2025
✍️ Analysis by: Captain Vincent

GOLD TRADING INSIGHTS TODAY WITH LUCYGOLD TRADING INSIGHTS TODAY WITH LUCY 💛
Hello everyone 🌸
The gold market (XAUUSD) today is showing many interesting signals as the price continues to test the crucial trendline area. Traders' sentiment is quite cautious at the moment – both buyers and sellers are “squaring off” around the liquidity balance zone.
🔍 Technical Analysis
On the chart, gold is moving within a narrowing triangle price channel – this indicates momentum is accumulating, and when the price breaks in either direction, the subsequent volatility will be very strong ⚡
Currently, the price is reacting around the main trendline, but there is no clear breakout signal yet.
In my personal view, the probability of a decline remains higher, however, further confirmation is needed before entering a trade.
The important point to note is the support area at 3965, which is the key boundary to confirm a clear downtrend.
If the price breaks through this area, the possibility of extending towards the Fibonacci 2.618 area around 3890 is entirely possible.
⚙️ Price Levels to Watch
Currently, the 3990 – 4012 area is short-term resistance, where sellers may reappear.
Meanwhile, the 3965 – 3945 – 3920 areas are the main supports that need close observation.
If the price continues to hold above 3945, the likelihood of a short-term rebound is quite high.
🎯 Today's Trading Scenario
💼 Buy: 3945
⛔ SL: 3938
🎯 TP: 3958 – 3977 – 3992 – 4012
💼 Sell: When the price clearly breaks below support 3965
⛔ SL: Above the breakout area
🎯 Expected TP: extending towards the Fibonacci 2.618 area around 3890
I still prefer to observe the price reaction at the trendline area, and only act when there is clear confirmation — because in a triangle pattern, the patient one will always be the winner 🌙
⚠️ Note & Conclusion
The above analysis reflects only Lucy's personal perspective, based on Trendline – Fibonacci – ICT factors 📊
This is not investment advice.
Please share your views on gold in the comments section 💬
And don't forget to follow Lucy for daily updates on insightful analyses —
where technical analysis merges with market emotions 💫🌸

[INTRADAY] #BANKNIFTY PE & CE Levels(04/11/2025)Bank Nifty is expected to open flat near the 58,100–58,150 zone, following a phase of mild recovery from lower levels in the previous sessions. The index is currently consolidating in a narrow range, suggesting that traders are waiting for a clear breakout to determine the next directional move.
If Bank Nifty manages to sustain above 58,150–58,200, it may extend its upside move toward 58,250, 58,350, and 58,450+. A breakout above 58,450 will strengthen bullish momentum, opening the path toward 58,600–58,700 in the short term.
On the downside, immediate support lies at 57,950–57,900. A decisive move below this zone could trigger a decline toward 57,750, 57,650, and 57,550, where buyers may look to re-enter.
Overall, with a flat opening, Bank Nifty is likely to trade within a range of 57,900–58,400. Traders should wait for a breakout on either side before taking fresh positions and maintain strict stop losses to navigate potential intraday volatility.

Ambuja Cements Ltd – Inverted Head & Shoulder Breakout in ProgreAmbuja Cements is displaying a classic Inverted Head & Shoulder pattern on the weekly timeframe, signaling a potential medium-term trend reversal. The neckline breakout zone around ₹560–₹580 is being tested again, and the price has shown a strong rebound from this area, confirming buyer strength.
The stock had earlier broken out of a falling wedge pattern, further strengthening the bullish bias. A sustained move above ₹580 with volume could confirm the breakout and pave the way for higher targets.
🎯 Key Levels:
CMP: ₹577.20 (+2.09%)
Pattern: Inverted Head & Shoulder + Falling Wedge
Neckline Zone: ₹560 – ₹580
Target-1: ₹630 – ₹640
Target-2: ₹690 – ₹710
Stop-Loss (Weekly Close): ₹540
📊 Technical View:
Price breaking out from a falling wedge after forming a reversal base.
EMA alignment turning positive – 20 EMA attempting to cross above 50 EMA.
Volume spikes seen near breakout areas indicate accumulation.
Sustaining above ₹580 may lead to a rally toward ₹640 and then ₹700+.
🧠 View:
Ambuja Cements shows early signs of a trend reversal backed by a strong chart structure. A weekly close above ₹580 would confirm the breakout, opening potential upside targets of ₹640 and ₹700 in the medium term.

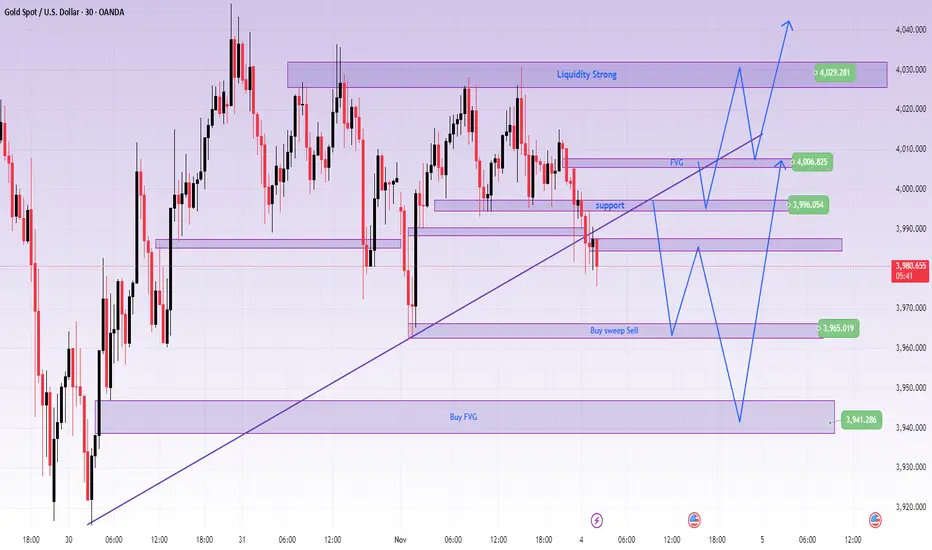
GOLD CONFIRMS SHORT-TERM DECLINE AFTER BREAKING TRENDLINEXAUUSD – GOLD CONFIRMS SHORT-TERM DECLINE AFTER BREAKING TRENDLINE
🪞 1. Overview
🌤️ In the Asian session this morning, gold broke the upward trendline even though the selling pressure wasn't particularly strong.
However, this is the first signal indicating that the short-term trend is leaning towards the sellers.
💬 Currently, the 3996 level is a significant resistance, and the price might retest this area before continuing to decline.
If the price surpasses the FVG at 4007, the trend might temporarily rebound in the short term.
💹 2. Technical Analysis (ICT Perspective)
🔸 Market structure: After breaking the trend, the structure temporarily shifts to short-term bearish.
🔸 Liquidity & FVG: Liquidity is drawn to the 3960–3940 area, while FVG 4007 is the first barrier.
🔸 Order Flow: Smart Money may lightly sweep up to the resistance area before pushing the price further down.
🎯 3. Reference Trading Scenarios
💔 MAIN SELL
Entry: 3996 | SL: 4004
TP: 3985 – 3972 – 3948
💢 SELL scalping
Entry: 4007 | SL: 4014
TP: 3998 – 3978
💖 REACTIVE BUY
Entry: 3965 | SL: 3957
TP: 3976 – 3988 – 3999
🌸 DEEP BUY
Entry: 3941 | SL: 3931
TP: 3955 – 3968 – 3988 – 4012 – 4066
🔍 4. Price Levels to Note
✨ 4007 → FVG resistance, short-term trend confirmation area
✨ 3996 → Retest area of the broken trendline
✨ 3965 – 3941 → Strong support area, likely to see reversal reactions
💬 5. Notes & Call for Interaction
⚠️ This is not an investment recommendation, but merely a personal technical perspective following the ICT method.
Observe the price reaction around the trendline carefully before making a decision 💭
If you find this post helpful, please 💛 like – 💬 leave a comment – 🔔 follow LanaM2
to stay updated with daily gold insights and learn more about the Smart Money Concept 🌷✨
XAU/USD – Gold Accumulating Before Breakout, Target 4,096 USD🔍 Market Context
Gold is trading within a symmetrical triangle pattern , indicating short-term accumulation before forming a new breakout wave.
Following a sharp decline from the peak region of 4,096 USD, the market has shown two instances of Change of Character (ChoCH) – early signs of buying pressure returning.
As long as the price holds above the 3,959 – 3,917 USD zone, the short-term bullish structure remains intact. This support zone acts as a crucial “discount zone” in the current accumulation cycle.
💎 Key Technical Zones
• Support Zone 1: 3,959 USD → main structure holding zone, coinciding with the lower trendline.
• Support Zone 2: 3,917 USD → final liquidity reaction zone.
• Resistance Zone: 4,040 USD → potential break & retest zone.
• Liquidity Zone: 4,096 USD → expansion target if the peak is breached.
🎯 Trading Scenarios
1️⃣ BUY Setup – Prioritise bullish structure
• Entry: 3,959 – 3,917 USD
• Stop Loss: 3,905 USD
• Take Profit:
– TP1: 3,985
– TP2: 4,040
– TP3: 4,072
– TP4: 4,096
✳️ “Buy the discount” – prioritise buy orders at the confluence support zone of trendline + FVG to follow the SMC flow.
2️⃣ SELL Scalp – Secondary strategy when price reacts at the peak
• Entry: 4,096 USD
• Stop Loss: 4,108 USD
• Take Profit:
– TP1: 4,072
– TP2: 4,040
– TP3: 3,985
✳️ “Sell the premium” – only activate if there is a strong price rejection signal at the liquidity peak.
💬 Summary
The short-term trend of gold remains bullish as the price stays above the trendline and continuously forms higher lows.
The main strategy is buy the dip – sell reaction around the 3,959 → 4,096 USD zone.
The confirmation of a strong uptrend will be when the price closes steadily above 4,040 USD .
“Smart money accumulates in silence before the market makes noise.”
⏰ Time Frame: 1H
📅 Update: 03/11/2025
✍️ Analysis by: Captain Vincent

Price Halts and Power of Confluence The price chart displays a noteworthy transformation as a previous supply zone evolves into an area of strong demand, illustrating a crucial market shift. The highlighted supply region, which had earlier capped price advances and attracted selling interest, has now transitioned into a price zone where buyers are stepping in, creating multiple reactions that signify growing demand as prices revisit this level.
- Supply to Demand Conversion: The red-shaded supply band acted as a ceiling for prices historically, but recent moves show price halting and consolidating above this region, marking a critical change in the market’s balance. This type of consolidation—where price compresses and pauses just after clearing a major supply area—is a visible sign of acceptance by market participants, as both buyers and sellers reassess value at this pivotal zone.
- Consolidation as Price Stability: Observing the price action post-supply area, there is clear evidence of tight, sideways movement—an area of price equilibrium or market indecision. This consolidation signals an important digestion phase, a hallmark of healthy price action
- Trendline Confluence: The thick green upward trendline adds a second layer of technical strength to this setup. Historically, prices have repeatedly taken support on this trendline during corrections, aligning perfectly with the newly converted demand area. This intersection of the time-based trendline with the horizontal supply/demand zone forms a strong confluence. Confluence zones like this are typically high-probability areas of interest, as the overlap of structural (trendline) and behavioral (supply/demand) features amplifies the significance of the region and attracts greater participation from market players.
-

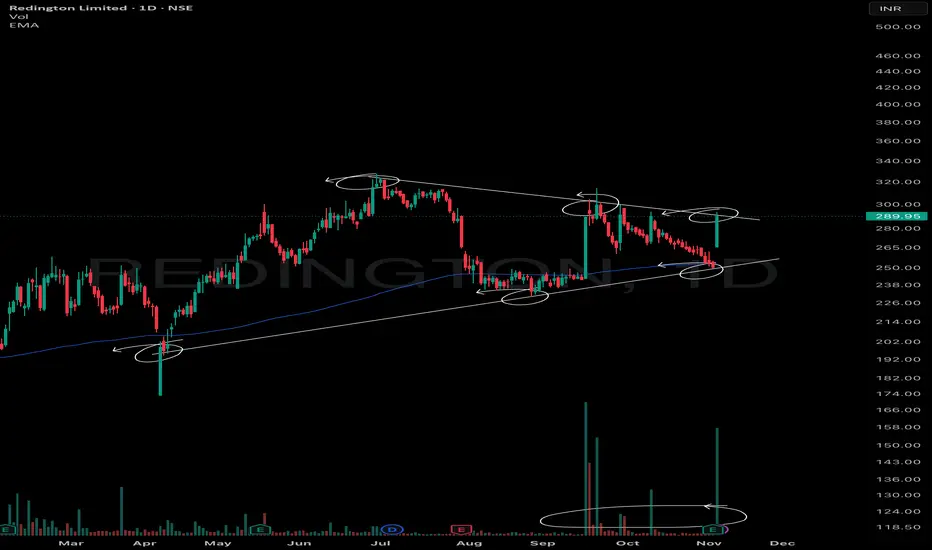
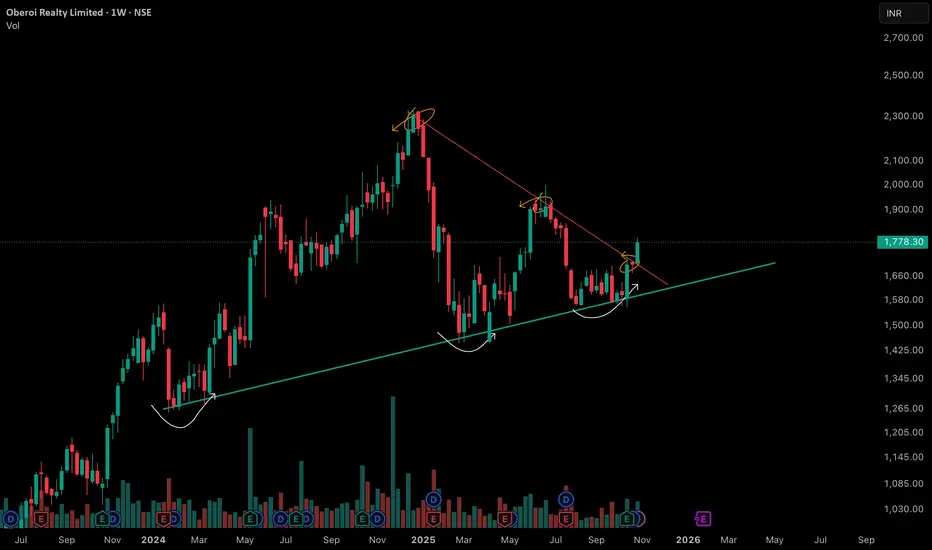
Volume Contraction Pattern Amidst Dual TrendlinesThe chart reveals important price structure and behavior over the past 18 months, featuring both a prominent counter trend line (marked in red) and a long-term support trendline (marked in green). Each element signifies distinct phases of supply absorption and buyer interest.
• Counter Trend Line (Red): This line has consistently acted as a pivot for multiple lower highs, reflecting the presence of vigilant sellers at each attempt to move higher. Multiple reaction points along this line indicate repeated supply emergence whenever price approached the zone, especially after sharp rallies earlier in the trend.
• Support Trend Line (Green): The green upward-sloping line marks sequential higher lows. This support axis has been respected multiple times, hinting at growing accumulation at each retest despite temporary price weakness in the broader market. The curvatures at lows (forming cup-like bases) display periods of volatility contraction and constructive price action as buyers step in at successively higher prices.
• VCP Dynamics: The pattern visible in the chart exhibits systematic contraction in the price swings. Each corrective structure—characterized by the curved reactions at support—shows a shrinking amplitude in both price and volume. This VCP sequence typically points toward consistent supply absorption, with sellers getting exhausted at lower levels after each contraction. The emergence of strong green candles with above-average volume near the support line often signals a revitalization of demand forces, as seen recently.
Privi Speciality Chemicals Ltd – Weekly Breakout SetupPrivi has shown a clean breakout from a long consolidation zone, backed by steady volume expansion. After months of range-bound action, the stock finally broke above ₹2,600 and is now sustaining well above its breakout zone — indicating the start of a new upward leg.
Price action shows strong bullish candles supported by the 10- and 20-week EMAs, signaling trend confirmation.
🎯 Key Levels:
CMP: ₹2,903 (+2.55%)
Breakout Zone: ₹2,500 – ₹2,600
Target Zone: ₹3,150 – ₹3,250
Stop-Loss: ₹2,700 (weekly close basis)
📊 Technical View:
Weekly breakout from multi-month consolidation box.
Volume confirmation supports sustained momentum.
Price trading above both EMAs, confirming bullish trend continuation.
Minor resistance near ₹2,950; sustained move above can accelerate momentum.
🧠 View:
Privi Speciality Chemicals has completed a strong breakout after a long accumulation phase. Sustaining above ₹2,900 can push the stock towards ₹3,200 levels in the coming weeks.

XAU/USD – Gold in Equilibrium Zone: Sell Opportunities Around...🔍 Market Context
Gold is currently consolidating within a triangle structure , showing short-term accumulation before a potential breakout.
Buyers are trying to maintain a minor bullish structure, but the series of lower highs indicates that sellers still hold the upper hand.
At the moment, price is reacting within the FVG 3,942–3,979 USD area, staying below the descending trendline.
If this zone fails to break, selling pressure may return.
💎 Key Technical Levels
• Bearish Order Block: 4,022 USD → main supply zone, aligning with the descending trendline.
• FVG Zone 1: 3,979 USD → short-term liquidity test area.
• FVG Zone 2: 3,942 USD → potential retracement zone before further downside.
• Bullish Order Block: 3,882 USD → key support aligning with long-term bullish trendline.
• Liquidity Zone: 3,789 USD → extended target if main support breaks.
🎯 Trading Scenarios
1️⃣ Sell Setup – Reaction from Resistance Zone
• Entry: 4,012 – 4,022 USD
• Stop Loss: 4,035 USD
• Take Profit:
– TP1: 3,979
– TP2: 3,942
– TP3: 3,900
– TP4: 3,882
– TP5: 3,789
✳️ “Sell the premium” – utilise supply and FVG reactions following Smart Money flow.
2️⃣ Buy Setup – Reaction from Demand Zone
• Entry: 3,882 USD
• Stop Loss: 3,865 USD
• Take Profit:
– TP1: 3,910
– TP2: 3,942
– TP3: 3,979
– TP4: 4,012
– TP5: 4,022
✳️ “Buy the discount” – valid when strong absorption or reversal signal forms near the lower OB.
💬 Summary
Current structure remains short-term bearish , yet the market is balanced.
The most efficient approach is to sell near premium zones (4,022) and buy back near discount (3,882) .
Expected range in the next 24–48 hours: 3,880–4,020 USD .
💡 Tagline:
“Trade where institutions act — not where retail reacts.”
⏰ Timeframe: 1H
📅 Updated: 30/10/2025
✍️ Analysis by: Captain Vincent

Gold Rebounds Toward OB, but Deeper Correction May Follow🔍 Market Context
After forming a Change of Character (ChoCH) and a clear Break of Structure (BoS) to the downside, gold dropped sharply from 4,080–4,100 USD, confirming a shift from bullish to bearish structure.
Price is now making a technical rebound, forming Lower Highs toward the Order Block 4,012 USD — aligning with a small Fair Value Gap (FVG) , suggesting new selling pressure may emerge.
This rebound is seen as a “pullback retest supply” within a completed bearish setup.
If the 4,012 USD supply zone reacts strongly, price may extend its drop toward lower liquidity pools.
💎 Key Technical Structure
BoS (bearish): confirms a break below prior bullish structure.
Order Block (OB): 4,010–4,020 USD → main supply area confluencing with FVG.
FVG zone: 3,985–4,010 USD → technical retracement zone.
Supply Zone: 3,891–3,895 USD → temporary support, may be swept.
Liquidity Zone: 3,850–3,860 USD → key liquidity target.
📈 Trading Scenarios
1️⃣ SELL Setup – Retest OB 4,010–4,020 USD
Entry: 4,010 – 4,020
SL: 4,035
Take Profit: 3,985 - 3,965 - 3,945 - 3,915 - 3,890/Open
✅ Condition:
Wait for price to retest FVG–OB with clear bearish confirmation (strong rejection, bearish engulfing, or minor ChoCH on M15).
➡️ Trend-follow setup – sell after price retests supply zone.
2️⃣ BUY Setup – Reversal at Liquidity Zone 3,850 USD
Entry: 3,850 – 3,860
SL: 3,830
TP1: 3,870 - 3,885 - 3,900 - 3,920 - 3,940/Open
✅ Condition:
Wait for strong absorption or bullish reversal signal (long-tail rejection or bullish ChoCH on M15–H1).
➡️ Counter-trend scalp setup for reversal traders.
⚠️ Risk Management
Prioritise SELLs below 4,035 USD.
BUYs only valid with confirmation at Liquidity Zone.
Avoid mid-range trading (3,920–3,970) to reduce noise.
💬 Conclusion
Gold remains in a bearish trend after breaking prior bullish structure.
As long as price stays below 4,035 USD , downside momentum prevails.
Next major target: 3,891 – 3,851 USD .
👉 Strategic Plan:
Sell 4,010–4,020 | SL 4,035 | TP 3,985 → 3,890 🎯
Buy 3,850–3,860 | SL 3,830 | TP 3,870 → 3,940 🎯
💎 Price never lies — liquidity always reveals the truth.
⏰ Timeframe: 1H
📅 Updated: 29/10/2025
✍️ Analysis by: Captain Vincent
