XAUUSD – PRICE ABOVE $4000: ABSOLUTELY CRAZY FOR TRADERSXAUUSD – PRICE ABOVE $4000: ABSOLUTELY CRAZY FOR TRADERS
Gold has officially surpassed the $4000 mark, marking one of the most robust increases in recent history.
Let's take a look at the key price zones and short-term opportunities 👇
🔻 SELL Scenario
SELL 4025–4027 → SL 4033 → TP 4015 – 4000 – 3980
SELL 4042–4044 → SL 4049 → TP 4030 – 4015 – 4000 – 3980
🟩 BUY Scenario
BUY 3993–3995 → SL 3988 → TP 4005 – 4013 – 4023 – 4040
BUY 3980–3983 → SL 3975 → TP 3998 – 4005 – 4013 – 4023 – 4040
📈 Technical Analysis
The medium-term upward price channel continues to be stable.
Rising lows indicate that buying pressure remains very strong.
The nearest psychological resistance is around the 4043 zone, coinciding with the Fibonacci extension.
The expected buying zone is at the POC Volume Profile area — a high liquidity zone, once anticipated by many traders to reject gold prices, but now could become a strong demand zone.
🧭 Macroeconomic Perspective
If the Federal Reserve (Fed) continues to cut interest rates, the market may aim for the next milestone – 5000 USD/ounce.
Although short-term fluctuations may occur (such as temporary ceasefires in the Middle East or Ukraine), the core drivers of this trend remain unchanged:
US public debt is increasing
Central banks are diversifying foreign reserves
The USD is weakening
All of which support gold's medium-term upward trend.
⚡️Summary
Gold remains in a solid upward structure, even as it approaches overbought territory.
There might be strong corrections, but as long as the upward structure is maintained, buyers remain in control.
Techincalanalysis

LiamTrading – Risk of correction before hitting the $4000 mark? LiamTrading – GOLD: Risk of correction before hitting the $4000 mark?
Hello everyone,
Gold is approaching the psychological price zone of $4000/oz, but before reaching this historic milestone, the market may be preparing for a short-term correction.
According to Bank of America's technical strategist – Paul Ciana, gold's upward momentum is “too hot,” and a mid-cycle correction could occur soon.
📉 Technical Analysis (Chart H1 – Wolfe Waves Formation)
Observing the chart, a Wolfe Waves pattern is clearly forming:
The Sell zone 3988–3990 is the convergence point of wave number 5 – a potential short-term reversal zone.
The Buy zone 3963–3965 is the retest point of local support, where sellers often tend to take short-term profits.
The Wolfe trend line indicates the possibility that the price will take liquidity above the peak zone before a corrective decline appears.
If a correction occurs, the 3940–3955 zone will be the first reaction area, where strong buying support is present.
🎯 Trading Scenario
Buy retest:
📍 3963–3965
🛑 SL: 3960
🎯 TP: 3972 – 3985 – 4000
Sell following Wolfe wave:
📍 3988–3990
🛑 SL: 3995
🎯 TP: 3972 – 3955 – 3945
🧭 Medium-term Outlook
Although the upward momentum remains dominant, the momentum is gradually decreasing and the market needs to “cool down” to create a new accumulation rhythm.
Dense liquidity zones around POC 3957–3960 may trigger a short-term pullback, before gold gains momentum to advance to the ATH zone of $4000 in the late-week sessions.
📌 Conclusion
Gold remains in a medium-term uptrend, but a short correction is necessary to maintain a sustainable upward structure.
Traders should prioritize flexible scalping, observing reactions at Fibo zones – Volume Profile – and especially the developing Wolfe Waves pattern.
I will continue to update the latest scenario details for XAUUSD daily.
👉 Follow me to not miss important wave rhythms!

LiamTrading – GOLD approaches the $4000 mark LiamTrading – GOLD approaches the $4000 mark: The upward wave continues
Hello everyone,
Gold continues to maintain its impressive upward momentum as the DXY only slightly increases by 0.50% and is currently at 98.21 – a signal indicating that safe-haven flows still prioritise precious metals.
Currently, the technical structure on H1 shows gold is in a clear upward channel, with price reaction zones accurately identified through Fibonacci and trendline, aiming for the next major target of $4000/oz.
📊 Technical Analysis (H1)
Main Trend: Strong upward, Higher High – Higher Low structure remains intact
Main Support Zone: around 3890 – 3900, coinciding with Fibo 1.0 confluence + upward trendline
Psychological Resistance Zone: 3955 – 3999, corresponding to Fibo extension 2.0 – 3.6
RSI is moving into the 70+ zone, reflecting strong buying force but short-term correction signs need to be observed.
🎯 Today's Trading Scenarios
Buy scalping
📍 3909 – 3911
🛑 SL: 3904
🎯 TP: 3940 – 3955 – 3970 – 3990
Buy swing
📍 3888 – 3890
🛑 SL: 3882
🎯 TP: 3910 – 3925 – 3950 – 3975 – 3990
Sell scalping
📍 3956 – 3958
🛑 SL: 3964
🎯 TP: 3935 – 3910 – 3890
Sell swing
📍 3997 – 3999
🛑 SL: 4010
🎯 TP: 3975 – 3950 – 3925
🧭 Trend Analysis
With the current upward force and stable technical structure, the $4000 target is entirely feasible in the short term.
The preferred strategy is to BUY with the trend, watch for pullbacks to optimise entry, and avoid FOMO at the peak.
Adjustments to the support zone 3890–3900 will be a beautiful opportunity to open buy positions.
💡 I will continue to update detailed reaction zones & new plans in each session.
Follow me for the earliest updates on daily gold scenarios!

Gold Soars on FOMO – 1000-Pip Opportunity Ahead!GOLD PLAN FOR 06.10 | Captain Vincent
✳️ Hello to all traders,
Today, we are not only analysing Gold (XAU/USD) from a purely technical perspective ⚙️, but also witnessing the perfect confluence between technicals and fundamental news. A bullish storm is forming, promising attractive trading opportunities.
📊 1. Technical Analysis: Sustainable Bullish Structure
From a technical standpoint, the uptrend of Gold on the H1 chart is undeniable.
🔹 Break of Structure (BoS):
Gold continuously breaks previous highs, indicating that buying pressure is completely dominant.
Each BoS point is a clear affirmation of the strength of the uptrend.
🔹 Potential Demand Zone:
After each rally, the price often takes a “pause” to accumulate.
Currently, the price may adjust to the $3,883,020 - $3,911,169 zone, where the confluence between Fair Value Gap (FVG) and Bullish Order Block (Bullish OB) – creates an ideal launchpad for the next rally.
🏦 2. Fundamental Analysis: The Fire Has Been Lit
If technicals show the way, then fundamental news is the fuel driving the uptrend.
🔸 US Government Shutdown:
This event creates political and economic instability, causing capital to flee from risky assets.
Gold – the number one safe haven – is directly benefiting as investors seek to preserve their assets.
🔸 Fed Ready to Cut Interest Rates:
The market is almost certain that the Fed will cut interest rates by 0.25%.
This reduces the appeal of the USD, further strengthening Gold's advantage, which is a non-yielding asset.
🔸 “Thirst” for Economic Data:
The government shutdown also disrupts the release of important economic data, leaving the market lacking information and increasing uncertainty.
In this environment, Gold continues to hold its safe haven role.
🎯 3. Comprehensive Trading Plan
When technicals and fundamentals align, the reliability of the trading strategy is significantly enhanced.
Strategy:
Wait to buy (Long) when the price adjusts to the demand zone $3,883,020 - $3,905,169.
Entry signals:
Observe confirmation of a bullish reversal in this zone such as:
Pin bar candles, engulfing
Or BoS on the M15 chart
Targets:
Short-term: $3950 – $3990
Long-term: Target “+1000 pips”
Risk management:
Place Stop Loss below the Bullish OB to protect the account.
🧭 Conclusion
The current market sentiment is very favourable for the Buyers:
USD is under downward pressure
Defensive capital flows are strongly moving into Gold
The FOMO effect can stimulate an extended rally
The combination of a solid technical structure and strong fundamental support is creating an almost perfect bullish picture.
👉 Be patient, stick to the plan, and await this golden opportunity.
💼 Wishing everyone an effective and victorious trading day!

LiamTrading – GOLD Weekly Plan ..GOLD Weekly Plan: Prepare for a Breakthrough to a New ATH
The new trading week opens with extremely complex sentiments — many traders are confused, and even the “big players” are cautious.
But if you look closely at the price structure, everything becomes clear: gold is still in a sustainable uptrend.
🧠 Psychological & Trend Analysis
Gold has just closed the week with a strong upward momentum, confirming the continuation of the medium-term uptrend.
At this stage, “Selling at the peak” is almost a dangerous move – as each correction is shallow and quick, not allowing sellers enough time to exit.
This creates a strong “fear of missing out” (FOMO) sentiment – driving funds to continue pouring in when the price hits the trendline or technical retracement zones.
📊 Technical Analysis
On the H4 chart, the upward structure of gold is clearly visible following the impulse + correction box pattern (each accumulation – breakout repeats).
The 3820–3830 zone continues to be the “golden retracement point” as it coincides with the medium-term uptrend line.
Last week's bounce from this zone brought excellent profits for those who patiently waited.
Currently, the next target for gold lies at the Fibonacci 1.618 zone – around 3980, which is also a significant psychological level where many investors might take profits.
🎯 Trading Scenario
Buy setup (trend-following):
Entry: 3830
Stoploss: 3815
Take Profit: 3980
Sell reaction (short-term upon reaching target):
Entry: around 3980
Stoploss: 3988
TP open depending on price reaction (scalping strategy)
🔍 Conclusion
Gold is still on the right growth trajectory, with short corrections merely opportunities to “accumulate”.
Continue trading with the trend, patiently waiting for the price to retrace to strong confluence zones instead of FOMO at high prices.
I will continue to share more details in daily updates here.
Follow me to not miss the latest gold scenarios.

XAU/USD Near Record Highs: Key Data AheadGold (XAU/USD) Technical Outlook – October 3, 2025
1. Macro & News Context
Gold is holding near record highs, heading for its seventh consecutive weekly gain, supported by expectations that the Federal Reserve will continue cutting rates and by concerns around the ongoing U.S. government shutdown. Spot prices have recently tested the ₹3,890–3,900 region and are now consolidating around ₹3,860.
Nonfarm Payrolls (NFP) – Typically scheduled for 18:00 IST on the first Friday of the month, the September jobs report is likely to be delayed due to the U.S. government shutdown.
Key event to watch today:
ISM Services PMI (September) will be released at 19:30 IST. Since ISM data is privately produced, it will be published regardless of the shutdown and may serve as the main volatility catalyst in today’s U.S. session. 【ISM】
Labor market signals: Challenger job cut data showed lower layoffs in September, but planned hiring at the lowest level since 2009, reinforcing a softer employment backdrop. Combined with the Fed’s recent 25 bps rate cut (to 4.00%–4.25%), this continues to support the bullish gold narrative.
USD trend: The dollar has weakened broadly this week, aligning with market bets on further monetary easing. This backdrop provides an additional tailwind for gold.
2. Technical Landscape (H1 Chart)
The attached chart highlights key technical zones and a completed Harmonic XABCD pattern on the 1H timeframe:
Support levels:
Near-term: ₹3,844–3,841
Deeper: ₹3,827 (intraday pivot), ₹3,792 (strong low)
Strategic: ₹3,764–3,770 (Bullish Order Block)
Resistance levels:
Immediate: ₹3,865
Strong supply: ₹3,880–3,890 (Bearish Order Block)
Extended target: ₹3,930–3,940 (Sell Scalping | Fibo zone)
Momentum: After bouncing from point D of the harmonic structure, gold has been forming higher lows (HL). Price currently sits above the longer-term moving average and is testing the shorter-term average, suggesting a constructive short-term bias as long as supports hold.
3. Trade Scenarios
Scenario 1 – Buy-the-dip (preferred bias)
Entry zone: ₹3,844–3,841
Stop loss: Below ₹3,827 (safer: below ₹3,792)
Targets:
₹3,865 (first take-profit)
₹3,880–3,890 (major supply)
Stretch: ₹3,930–3,940
Rationale: Higher low formation, bullish macro backdrop, aligned with strong weekly uptrend.
Scenario 2 – Countertrend short at resistance
Trigger zone: ₹3,880–3,890 (Bearish OB)
Confirmation: Rejection candles (H15–H1) such as wicks, engulfing, or failed breakout.
Stop loss: Above ₹3,895–3,900 (or above ₹3,945 if price spikes into the ₹3,930–3,940 fib zone).
Targets: ₹3,865 → ₹3,844 → ₹3,827
Rationale: Potential liquidity sweep ahead of ISM, with profit-taking likely near supply zones.
Scenario 3 – Breakdown through support
Trigger: 1H close below ₹3,841
Path: ₹3,827 → ₹3,792 (Strong Low) → ₹3,764–3,770 (Bullish OB)
Rationale: Loss of intraday structure would flip bias short until major demand zones.
4. How to Trade Around Today’s Data
If NFP is indeed delayed, the 18:00 IST slot may bring limited volatility.
Focus instead on the ISM Services PMI at 19:30 IST, which could trigger sharp swings in both USD and gold.
Adjust position sizing: Expect spread widening and slippage around the release. Reduce leverage or scale into positions.
5. Risk Management
Limit risk per trade to 0.5–1% of account equity.
Avoid chasing price once levels are tested; wait for H15–H1 candle closes for confirmation.
Monitor the U.S. Dollar Index (DXY) and Treasury yields – further dollar weakness would reinforce bullish gold setups.
🔑 Key Takeaway
Gold remains structurally bullish in the broader trend, with immediate support at ₹3,841–3,844 critical to maintain upside momentum. Watch for reactions around ₹3,880–3,890 and ₹3,930–3,940. With NFP possibly delayed, the ISM Services PMI at 19:30 IST will be today’s most important catalyst for directional moves.

XAUUSD – Price Channel Rising Towards 4000 USD Next Week
Hello Traders,
Every day I share scenarios for you to refer to and build your own strategy. And here is the perspective for next week – as gold is in a sustainable uptrend, approaching the psychological mark of 4000 USD.
Technical Perspective
On the H4 frame, gold continues to move within a clear upward price channel.
Every time the price touches the support trendline, a strong rebound reaction appears, indicating that buying pressure still dominates.
This price channel has remained stable for many weeks, providing a basis for us to prioritise buying in line with the trend.
The target of 4000 USD is not far away, especially when the fundamental context continues to support the upward trend.
Fundamental Context
The market is expecting the Fed to continue cutting interest rates in October, creating momentum for gold.
Current US financial-economic news is limited, as the US Government remains shut down.
Geopolitical factors have somewhat cooled down, but gold still holds its position as an important safe-haven asset.
Trading Scenario
1. Buy (main priority):
Entry: 3860 – 3865 (at the rising trendline).
TP: 3960 – 4000.
SL: manage below the trendline.
2. Sell (backup if the channel breaks):
Condition: 3853 is breached.
At that point, a new trend will form and the Sell scenario will be activated.
Conclusion
Main trend: Buy in line with the rising channel, aiming for 4000 USD next week.
Sell should only be considered if there is confirmation of a break below 3853.
The market is in a critical phase, so be patient and wait for a good entry point to trade safely and effectively.

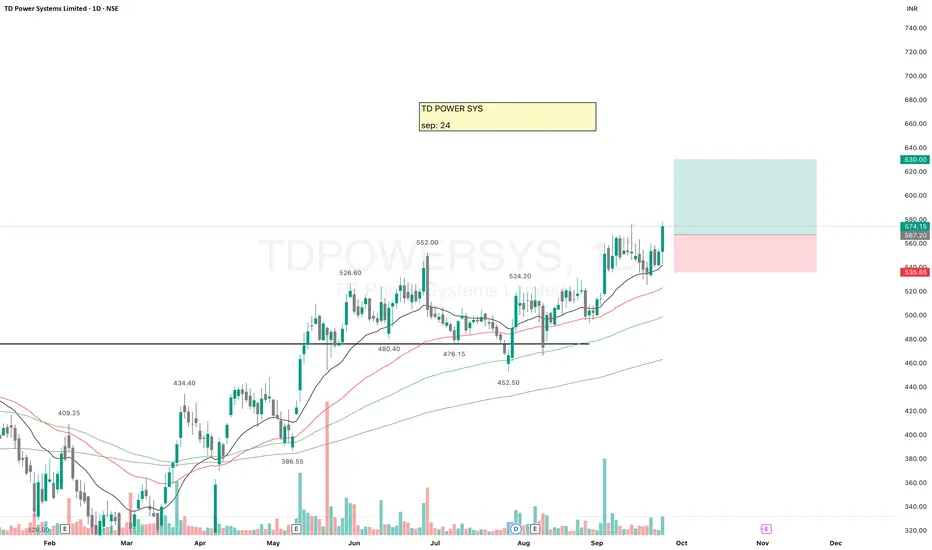
TDPOWERSYS (TD Power System)The stock is trading above all key EMAs, showing strong momentum.
After facing resistance near ₹475, it broke out in May, then briefly retested the ₹475–₹460 zone, which has now turned into solid support.
Now there is probability of another upside move.
✅ If you like my analysis, please follow me as a token of appreciation :)
in.tradingview.com/u/SatpalS/
📌 For learning and educational purposes only, not a recommendation. Please consult your financial advisor before investing.
XAUUSD – Prioritise Sell After Breaking Trendline
Hello Traders,
Gold has experienced a strong upward movement for several consecutive days, but currently, the market is showing significant reversal signals. The upward trendline on H4 has been broken, confirming the weakening buying momentum. In the medium term, the preferred scenario will be selling rather than continuing to chase buys.
Basic Context
The US Treasury has just repurchased an additional 2 billion USD in bonds, raising the total repurchase this week to 4.9 billion USD. This move indicates an effort to stabilise the bond market but also reflects significant pressure on the USD and the US financial situation.
In the short term, the injection of additional bond liquidity makes gold's movement more unpredictable, and the trendline break at this time is an important warning signal.
Technical Perspective
Breaking the upward trendline → confirms a structural change.
MACD signals weakening, with buyers losing clear strength.
The 3865 – 3868 zone is a beautiful resistance retest point to Sell.
If the price falls deeply, the support zones around 3830 – 3810 – 3790 will be the next targets.
Today's Trading Scenario
Sell (main priority):
Entry: 3865 – 3868
SL: 3875
TP: 3855 – 3832 – 3810 – 3790
Buy Scalping (counter-trend – high risk):
Entry: 3803 – 3805
SL: 3795
TP: 3822 – 3835 – 3850
Conclusion
Gold has broken the trendline, prioritising Sell in the short and medium term.
News from the US bond market further emphasises the risk of instability, making counter-trend Buy moves suitable only for short-term Scalping.
Follow me for the earliest updates on scenarios as price paths change.

LiamTrading – INTRADAY TRADING SCENARIO
When we look at the global financial landscape, an interesting picture emerges:
Equities – All Time High (ATH)
Housing Prices – ATH
Bitcoin – ATH
Gold – ATH
Money Supply – ATH
National Debt – ATH
CPI Inflation – averaging 4% per year since 2020, double the Fed’s “target”
Federal Reserve – continuing rate cuts this month
Clearly, easy money combined with inflationary pressure is a powerful driver pushing gold to new historical levels. This makes buying with the trend more reasonable than ever.
📊 Technical Analysis – H1 Chart
Gold is moving within a well-defined upward channel.
Volume Profile highlights the POC around 3840–3850, a key zone to watch for scalping buys.
The VAL coincides with the rising trendline near 3820–3822, offering strong confluence for medium-term buys.
If price breaks above 3895 to confirm a new ATH, trend-following buys remain the priority.
Key resistance: 3913–3915, suitable for short-term scalping sells.
🎯 Trading Scenarios
Buy scalping: 3845 | SL 3839 | TP 3856 – 3870
Buy zone (main): 3820 – 3822 | SL 3816 | TP 3832 – 3845 – 3860 – 3875 – 3890
Sell scalping: 3915 – 3913 | SL 3920 | TP 3900 – 3885 – 3872 – 3860
Buy breakout: If price breaks ATH 3895 and confirms, continue buying with the trend → Open targets towards 3915+
📌 Conclusion
Gold remains in a strong uptrend, both fundamentally and technically. Short-term pullbacks are simply opportunities to add to buy positions. However, traders should watch the immediate resistance zones to optimise entries.
👉 This is my personal outlook on XAUUSD, not financial advice.
Follow me to stay updated with the latest daily gold scenarios 🔥

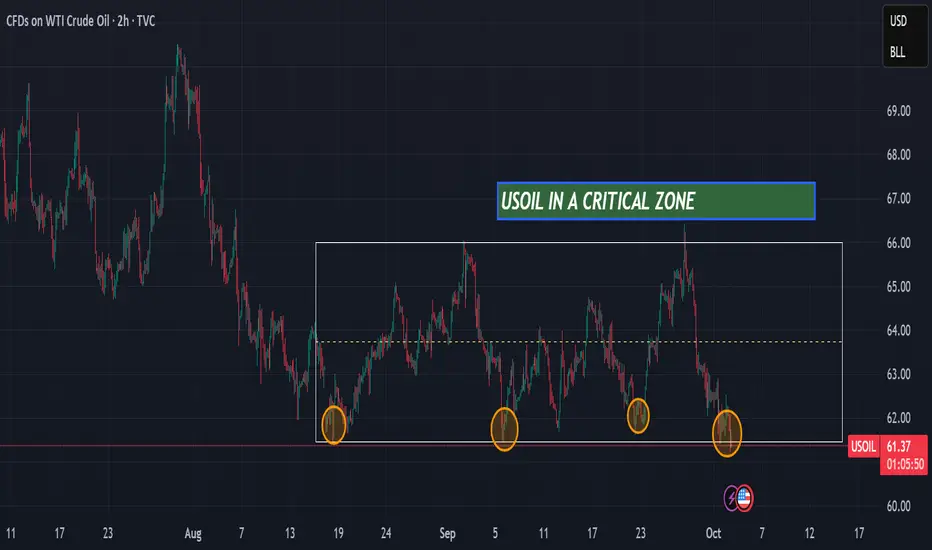
USOIL is in a critical zoneHello,
USOIL is currently at a major support level that has held for the past 2 months. There are two possible scenarios: either the support holds and USOIL bounces back toward the resistance at $66, or the support breaks and the price moves down to the next level at $60,
Ibrouri Abdessamad
(XAU/USD) – Gold likely to touch $4,000/oz: Ideal buying levels?1. Market Structure & Trend Outlook
On the H1 chart, gold is sustaining its bullish structure with higher highs and higher lows.
After the BoS (Break of Structure), price retraced near 3,862 Buy Zone and bounced upward.
At present, price trades above EMA34 and EMA89, keeping bullish bias intact.
2. Important Levels
Buy Zone: 3,862 – 3,865. Acts as short-term support. Holding above strengthens the bullish case.
OB1: 3,806 – 3,810. Next support in case Buy Zone breaks.
OB2: 3,763 – 3,770. Deeper support, triggered only if market corrects heavily.
Sell Scalping Zone (Fibo): 3,912. A short-term resistance, profit booking expected.
Sell Zone / ATH: 3,933 – 3,935. Breakout here may lead to fresh record highs.
3. Trade Setups
Bullish Setup: Buy on retest of 3,862 – 3,865.
SL: Below 3,850.
TP1: 3,912.
TP2: 3,933 – 3,935.
Bearish Setup (Defensive): If below 3,860, expect test of 3,806 – 3,810.
If this fails, price may decline towards 3,763 – 3,770.
4. Conclusion
Trend remains positive on H1. Best strategy: Buy on dips near support, manage SLs carefully, and book partial profits near resistances. Sustaining above 3,933 may open doors for new highs.

XAUUSD – Maintaining the Core Uptrend (BUY Bias)
Hello traders,
On the H4 timeframe, gold continues to show a steady upward trend. After testing the upper trendline, price bounced back and is now consolidating around the 386x region. This suggests the market may be in an accumulation phase, awaiting major news.
Fundamental Context
Tomorrow, the market will look towards the release of the Nonfarm Payrolls (NFP) data, an event that often brings strong volatility to gold prices.
In addition, concerns around the potential US Government shutdown are adding to the macro uncertainty, further supporting gold’s safe-haven appeal.
At present, there is little evidence to suggest gold will decline, particularly when other markets are also breaking higher.
Technical Analysis
Price continues to trade within the ascending channel on H4, with buyers holding the advantage.
MACD remains above the zero line, showing no clear signs of weakness.
Price is likely to consolidate further in the 3860 – 3870 range before a sharp move triggered by news.
Trading Plan
Buy Setup (preferred – trend following)
Entry: 3829 – 3832
SL: 3825
TP: 3845 – 3862 – 3877 – 3890
Sell Scalping (counter-trend, higher risk)
Entry: 3927 – 3930
SL: 3934
TP: 3915 – 3900 – 3882 – 3865
Note: Sell setups should be treated only as short-term scalps, as the primary bias remains on the buy side.
Conclusion
Gold is holding firmly within the uptrend structure, with no significant weakness yet. Given the backdrop of political uncertainty and the upcoming NFP release, the priority remains buying at suitable support zones. Any sell trades should be viewed as quick reactions rather than core positions.
👉 Follow me to get the latest updates as soon as price structure changes.

XAUUSD – US Government Shutdown Pressure on Gold
Hello Traders,
For the first time since 2018, the US Government is facing the risk of a shutdown. This can only be avoided if Congress passes new funding legislation, but the timing remains uncertain. This political backdrop is exerting strong pressure on the financial markets, and gold – the traditional safe haven asset – has become the focal point for investors.
Technical Outlook
Gold continues to set new ATHs right in the Asian session today, indicating the uptrend remains intact.
The upward price channel on H4 maintains a beautiful structure, with the main trend continuing to favour buying.
Yesterday's dip was merely a "liquidity sweep," after which the price quickly returned to its upward momentum.
Short positions can be considered when the price hits strong resistance, combining Fibonacci + Trendline, to optimise winning probabilities.
Trading Scenario
Sell (short-term at resistance):
Entry: 3884 – 3886
SL: 3890
TP: 3872 – 3860 – 3845 – 3830
Buy (aligning with the main trend):
Entry: 3820 – 3823
SL: 3816
TP: 3835 – 3850 – 3862 – 3880
Conclusion
Gold remains strongly supported by the political instability in the US.
The medium-term strategy continues to prioritise Buying at support zones, while Selling should only be considered when there is a clear reaction at resistance zones.
Traders need to closely monitor political news, as any developments related to the US government could alter the short-term structure of gold.
Follow me for the quickest updates on new scenarios as the price path changes.

LiamTrading – Follow the Buy trend, target ATH 3915
The gold market continues to demonstrate the strength of an upward trend. After yesterday's shakeout, we witnessed a very clear Long Squeeze: all buying forces were forced to exit, but immediately after, the price quickly rebounded. This is the hallmark of a strong trend – the more it shakes out, the more momentum it creates for a new peak.
Today's perspective:
Continue to follow Buy, do not SELL against the trend.
The Buy position from 3797 is still being held, if the price returns to retest, we will continue to add orders.
Prioritise observing the POC of the Volume Profile to place Buy orders; if the price adjusts deeper, the VAL area coinciding with the rising trendline will be an extremely safe buying point.
Trading scenario
Buy 3847–3844, SL 3840, TP 3868 – 3880 – 3900 – 3915
Buy 3821–3819, SL 3814, TP 3835 – 3850 – 3868 – open
In summary: The upward trend remains extremely strong, the short-term target is ATH 3915. Stick to the trend, prioritise Buy to maximise profits.
This is my personal view on XAUUSD. Please follow the scenario and stay tuned for my updates.

XAUUSD – Will ATH Diminish Gold's Value?Hello Traders,
Gold once accounted for up to 21% of total global assets, but now this figure is only about 5%. Two perspectives are clearly visible:
Gold is gradually losing its relative importance in the financial system.
The total value of global assets has increased significantly (the denominator has expanded), causing gold's proportion to decrease, while the absolute value of gold still plays an important role.
Technical Analysis
In today's Asian session, gold continues to set higher price levels, indicating a very strong upward momentum.
The upward price channel on H1 has touched the upper boundary, showing slight hesitation, but the main trend remains bullish.
The H1 and H4 frames maintain strong buying pressure, with market sentiment heavily leaning towards buyers, ready to push prices to higher levels.
According to Elliott Wave, the price is currently in wave 5 (market sentiment wave). The current task is to observe the reaction when this wave completes, to prepare for the ABC correction cycle.
Regarding Fibonacci, the next important resistance area is at 3880, where a bearish reaction is likely to occur.
Trading Scenario
Sell (at Fibo resistance 3880):
Entry: 3880
SL: 3886
TP: 3866 – 3850 – 3835
Buy (trend-following preferred):
Entry: 3813 – 3816
SL: 3809
TP: 3828 – 3843 – 3860 – 3878
👉 Note: Smaller frames H1 – M15 will provide additional confirmation signals to optimize entry points.
Conclusion
The bullish trend of gold is still prioritized, wave 5 is not yet complete, and the scenario aiming for 4000 – 4050 is entirely feasible.
Short-term selling at strong resistance areas can be considered, but risk management must be tight.
Traders need to closely follow support – resistance areas in smaller frames to maximize profits.
Follow me for the fastest updates when the price structure changes and to discuss more scenarios in the community.

H1 bullish momentum intact | Buy 3,792–3,765, target 3,821🟡 XAU/USD – 29/09/2025 | Captain Vincent ⚓
🔎 Captain’s Log – Structure & Trend
H1 continues to print consecutive BoS → bullish trend sustained.
Price broke the long-term downtrend line and surged to new highs.
EMA 34 & EMA 89 both pointing up and below price → confirming short-to-mid-term bullish momentum.
📈 Captain’s Chart – Key Zones
Storm Breaker (Sell Zone / ATH test) : 3,818 – 3,821
Golden Harbor (FVG – Buy Zone) : 3,792 – 3,779
OB Harbor 1 : 3,772 – 3,765
OB Harbor 2 (deeper) : 3,731 – 3,724
Core Idea: 3,792 – 3,765 is the main support “cushion” for trend-follow Buys; 3,818 – 3,821 is the wave edge where profit-taking may occur.
🎯 Captain’s Map – Trade Plan
✅ Golden Harbor (BUY – main priority)
Buy Zone 1 – FVG (3,792 – 3,779)
Entry: 3,792 – 3,779
SL: 3,765
TP: 3,805 – 3,818 – 3,821+
Buy Zone 2 – OB1 (3,772 – 3,765)
Entry: 3,772 – 3,765
SL: 3,758 (below 3,765)
TP: 3,792 – 3,805 – 3,818 – 3,821
Buy Zone 3 – OB2 deep (3,731 – 3,724)
Entry: 3,731 – 3,724
SL: 3,714
TP: 3,745 – 3,765 – 3,792 – 3,805
⚡ Quick Boarding (SELL – scalp only)
Sell Zone – Storm Breaker (3,818 – 3,821)
Entry: 3,818 – 3,821
SL: 3,828
TP: 3,805 – 3,796 – 3,792
Breakdown Short (conditional)
Only consider Short if H1 closes below 3,724
SL: 3,735
TP: 3,710 – 3,700 – 3,690
⚓ Captain’s Note
“The Golden sails remain filled after consecutive BoS . Golden Harbor 🏝️ (3,792 → 3,765) is the anchor dock to board in trend’s direction. Storm Breaker 🌊 (3,818 – 3,821) may trigger profit-taking waves – only go Quick Boarding 🚤 if clear signals appear. If the tide drags below 3,724, let the ship retreat to OB2 to gather strength before resuming the northbound voyage.”

Extended Inverted Head & Shoulders Structure in Price ActionThis chart features an extended inverted head and shoulders pattern, illustrating how these classic formations can significantly vary in length and shape across timeframes. The left and right shoulders frame a deeper head, while the neckline is not strictly horizontal but angled, reflecting real market dynamics. Observing these variations enhances one’s ability to identify patterns in imperfect conditions.
Key aspects include the evolving symmetry between the shoulders, the consistency of the head’s depth, and the interaction of price with the neckline angle. This post encourages traders to look beyond textbook structures and develop a refined eye for authentic technical setups, emphasizing pattern recognition without predicting price direction.
Disclaimer: This analysis is for educational purposes only and does not constitute investment advice. Always conduct your own research before making trading decisions.
Nifty – Potential Reversal ZoneNifty – Potential Reversal Zone
Nifty is testing a key support area once again, its third touch of the 100-EMA after previous successful reversals.
Price is also hovering near the 0.786 Fibonacci retracement, adding confluence.
A brief consolidation here could set up a strong upside move, but confirmation is critical after eight straight sessions of decline.
One should look for a decisive candle or volume pickup before taking any long trade.
In case it goes down further then next support areas are 24350, 24190, 23900.
✅ If you like my analysis, please follow me as a token of appreciation :)
in.tradingview.com/u/SatpalS/
📌 For learning and educational purposes only, not a recommendation. Please consult your financial advisor before investing.

XAUUSD – Prioritise waiting to buy after gold hits ATHXAUUSD – Prioritise waiting to buy after gold hits ATH, target 3840
Hello Trader,
Right at the start of the week, gold has set a new ATH, affirming the upward trend remains dominant. The price structure on H1 shows buying pressure remains quite strong, while adjustments are mainly to balance liquidity. In the current context, the preferred trading strategy is still to wait to buy at key support zones, with a target towards 3840.
Basic Context
This week, the usual focus would be on the Nonfarm Payrolls (NFP) data. However, the risk of a US Government shutdown might delay this crucial report.
The US fiscal year runs from 1/10 to 30/9. If Congress does not pass all 12 spending bills, agencies without funding will have to cease operations.
In the absence of important economic information, gold continues to benefit from safe-haven sentiment and fiscal policy uncertainty.
Technical View
The price has broken out and created an ATH, with the 3837 – 3840 zone currently being strong resistance (Fibonacci + market psychology).
The 3770 – 3773 zone is near support, coinciding with the trendline and previous liquidity, suitable for buying.
MACD on H1 shows buying momentum is maintained, but a correction is needed for price balance before breaking higher.
Trading Strategy
Short-term Sell (at resistance):
Entry: 3837 – 3840
SL: 3844
TP: 3830 – 3800 – 3770
Note: This is only a reactive order at resistance, going against the main trend, so manage risk tightly.
Preferred Buy (trend-following):
Entry: 3770 – 3773
SL: 3766
TP: 3784 – 3799 – 3810 – 3838
Conclusion
This week, gold still prioritises the Buy strategy at support zones. The main target is towards 3840, an important resistance zone and a benchmark for trend strength. The Sell order is only short-term at resistance, while the main scenario remains waiting for a correction to buy up.
Follow me for short-term scenario updates during the week, especially as news and US fiscal policy changes can significantly impact gold.

[INTRADAY] #BANKNIFTY PE & CE Levels(29/09/2025)Bank Nifty is expected to open slightly gap up today around 54,400–54,450 levels, but the overall market structure still looks weak with sellers dominating recent sessions. On the upside, if Bank Nifty sustains above 54,550–54,600, then a short covering move can be seen, taking the index higher toward 54,750, 54,850, and 54,950+. However, this zone will act as a strong hurdle, and only a decisive breakout can shift momentum in favor of the bulls.
On the downside, immediate support lies at 54,450–54,400. A breakdown below these levels could accelerate selling pressure, opening the path toward 54,250, 54,150, and 54,050-. The bias remains weak, and traders should be cautious with long positions unless the index breaks and sustains above the resistance zone. Following the trend with strict stop-loss and quick profit booking will be the safer strategy in this slightly gap-up but overall bearish setup.

Gold awaits PCE | EMA squeeze, big waves ahead🟡 XAU/USD – 26/09 | Captain Vincent ⚓
🔎 Captain’s Log – Context & News
Trump : Announced a 100% tariff on branded drugs if not produced in the US → escalating trade tensions.
PCE tonight : The FED’s most important inflation gauge, key to shaping October rate cut expectations (current probability 91.09%).
The market is in “hold breath” mode, awaiting the PCE spark to decide the next direction.
⏩ Captain’s Summary : Gold is squeezed between two winds – short-term EMA pressure and major expectations from PCE.
📈 Captain’s Chart – Technical Analysis
EMA : EMA 34 (yellow) remains below EMA 89 (red) → short-term bearish pressure persists, but narrowing gap signals big volatility ahead.
Golden Harbor (Support / Buy Zone)
3,738 – 3,730
3,718
3,687
3,651
Storm Breaker (Resistance / Sell Zone)
3,755 – 3,773
🎯 Captain’s Map – Trade Plan
⚡ Sell (scalp at resistance)
Entry: 3,773 – 3,776
SL: 3,783
TP: 3,755 – 3,745 – 3,734
✅ Buy (trend-follow priority)
Buy Zone 1 (Scalping)
Entry: 3,72x – 3,718
SL: 3,710
TP: 3,750 – 3,769 – 3,776
Buy Zone 2 (Deeper OB)
Entry: 3,685 – 3,683
SL: 3,675
TP: 3,690 – 3,695 – 3,700 – 3,705 – 3,7xx
⚓ Captain’s Note
“The Golden sails are being squeezed between EMA 34 & 89. Golden Harbor 🏝️ (3,734 – 3,683) remains the safe dock for sailors to await the big wave. Storm Breaker 🌊 (3,773 – 3,776) is raising fierce waves, only suitable for short Quick Boarding 🚤 scalps. Tonight’s PCE will be the decisive wind – either pushing the ship beyond 3,78x or forcing it back to retest 3,72x.”
📢 If you find Captain’s Log useful, don’t forget to Follow for the latest updates.
💬 What do you think? Will Gold break through 3,78x or retest 3,72x first?

LiamTrading – Medium-term Gold Outlook H4Let's prepare the scenario for the new week, folks!
In my opinion, gold in the coming week may start to show a medium-term correction phase. However, it is important to note that nothing is absolutely certain on a larger timeframe. If you are trading intraday, stay closely aligned with price action to ensure higher accuracy.
Gold closed the weekly candle at 3759.85 – a price level that clearly indicates hesitation. The end-of-week session showed a rejection of price increase, mainly due to profit-taking pressure, so it cannot be immediately confirmed that a downtrend will begin.
The upward price channel is still strong, so it is essential to maintain a buying trend mindset to ensure the confidence in holding profits remains firm.
The upward structure is still stable, but the RSI has reflected a weakening in buying sentiment. To confirm a medium-term correction, gold needs to break 3720. At that point, a reasonable strategy would be to wait to sell around 3737–3740 (retracing to the trendline), targeting the support area coinciding with the highest volume profile cluster at 3645.
Conversely, the buying scenario will occur when:
- Price touches the 3735 boundary and a candle rejection reaction appears.
- Or gold breaks above the minor resistance at 3780, in which case you can buy immediately, with expectations towards the 3850 area.
Next week, be patient and wait for market confirmation to increase the probability of success. I will continue to share detailed scenarios in each trading session for everyone to stay updated.
