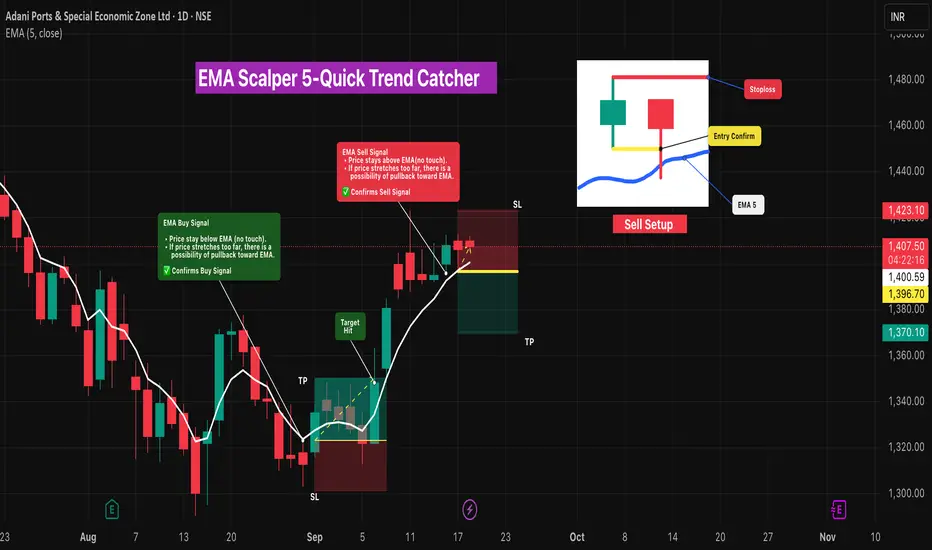
EMA Scalper 5-Quick Trend Catcher🔎 Intro / Overview
This idea uses a single EMA (Length 5) as a trend confirmation tool.
- When price stays below EMA (no touch), it signals bullish continuation.
- When price stays above EMA (no touch), it signals bearish continuation.
If price stretches too far from EMA, expect a possible pullback toward the line.
This EMA Scalping Strategy focuses on quick entries and exits 🎯.
- Best suited for intraday scalping where small, quick moves are captured. ⚡
___________________________________________________________
📌 How to Use
- In a downtrend , when price stays far below EMA(5) with no touch, then the next candle breaks the previous high → immediate Buy entry .
- In an uptrend , when price stays far above EMA(5) with no touch, then the next candle breaks the previous low → immediate Sell entry .
- EMA acts as a fast trend filter, confirming momentum while defining risk–reward levels.
- Once the signal is confirmed, entry is validated only if the next candle breaks the price level — otherwise, the signal is devalidated.
___________________________________________________________
🎯 Trading Plan
- Entry → When the next candle breaks the previous candle’s high , enter long (for immediate Buy).
- Stoploss → Swing Low for Buy / Swing High for Sell.
- Target → 1R (equal to stop distance).
___________________________________________________________
📊 Chart Explanation
ADANIPORTS
1️⃣ Buy Signal →
- Entry @ 1323.15
- Stoploss @ 1301.40
- Target @ 1345.70 → 🎯 Target Hit
2️⃣ Sell Signal →
- Entry @ 1396.70
- Stoploss @ 1423.10
- Target @ 1470.10
Trade continue in live
___________________________________________________________
👀 Observation
- EMA(5) gives fast and responsive trend signals.
- Works best in strong trending markets.
- False signals may occur in choppy sideways markets — use structure confirmation.
___________________________________________________________
❗ Why It Matters?
- Provides clear Buy/Sell confirmation with less lag.
- Defines structured entry, SL, and TP rules.
- Simple, rule-based system to avoid emotional trading.
___________________________________________________________
🎯 Conclusion
The EMA(5) Signal Strategy is a simple yet effective way to confirm trend and capture moves.
By combining breakout entries with disciplined SL/TP, traders can maintain risk–reward balance and trail winners effectively.
🔥 Patterns don’t predict. Rules protect. 🚀
___________________________________________________________
⚠️ Disclaimer
📘 For educational purposes only.
🙅 Not SEBI registered.
❌ Not a buy/sell recommendation.
🧠 Purely a learning resource.
📊 Not Financial Advice.
Techincalanalysis
FED countdown | Buy at support, Sell at resistanceXAU/USD – 17/09 | Captain Vincent ⚓
🔎 Captain’s Log – News Context
18/09, 01:00 (US time): FED rate decision + Dot Plot → policy outlook for upcoming meetings
01:30: Powell’s speech – the key market focus
Market consensus: FED almost certain to cut -25bps. However, the -50bps scenario still exists → if it happens, it will be a “big boost” for Gold
During Asia–Europe session, Gold faced early profit-taking, dropping quickly to 3,677 – 3,675, reflecting caution ahead of the FED
⏩ Captain’s Summary
Gold is making a technical pullback before the FED.
Medium-term trend remains bullish, but patience is needed to wait for better Buy entries.
📈 Captain’s Chart – Technical Analysis
Storm Breaker (Resistance / Sell Zone)
Nearby OB: 3,693 – 3,695 (short scalp)
ATH Zone: 3,717 – 3,720 (strong resistance, potential heavy selling)
Golden Harbor (Support / Buy Zone)
Shallow Dock: 3,656 – 3,657 (short-term)
Main Harbor: 3,629 – 3,630 (trendline confluence + old BoS)
Market Structure
Multiple BoS confirm bullish trend
Price retracing to support, likely to bounce back and test 3,693 – 3,717
Break above 3,720 → confirms new ATH
🎯 Captain’s Map – Trade Plan
✅ Buy (priority)
Buy Zone 1
Entry: 3,656 – 3,657
SL: 3,648
TP: 3,675 – 3,693 – 3,717
Buy Zone 2
Entry: 3,629 – 3,630
SL: 3,618
TP: 3,656 – 3,690 – 3,717
⚡ Sell (only at resistance)
Sell Zone OB
Entry: 3,693 – 3,695
SL: 3,705
TP: 3,690 – 3,685 - 3680 - 368x - 36xx
Sell Zone ATH
Entry: 3,717 – 3,720
SL: 3,727
TP: 3,715 – 3,710 – 3,705 - 37xx
⚓ Captain’s Note
“Before the FED countdown, profit-taking waves pulled the Golden ship toward Golden Harbor 🏝️ (3,656 – 3,629) .
Yet the main current still flows north, the bullish trend remains intact.
Storm Breaker 🌊 (3,693 – 3,720) is the big wave, suitable for short Quick Boarding 🚤 scalps.
Sailors must stay patient – the FED wind could be the force to propel Gold to new peaks.”

LiamTrading – XAUUSD OutlookSharing my personal view on the possible next move for gold.
Based on the current chart structure, the wave formation suggests that XAUUSD is most likely in Wave 4. The correction started yesterday after price touched the 3,700 mark – a round resistance level which also coincides with the 1.618 Fibonacci extension. This area often attracts heavy liquidity, and the subsequent pullback further supports the view that Wave 4 has been activated.
At present, the key support to watch is 3,675. If this level breaks, the corrective structure could complete around 3,656. On the H1 timeframe, the RSI has moved below the 30 level, indicating oversold conditions. In my view, while the market remains in this phase, it is still preferable to look for selling opportunities, though patience is needed until clearer confluence signals appear.
Trading plan (short-term focus):
Sell entry 3685–3687, SL 3693, TP 3670 – 3656
Buy entry 3656–3654, SL 3648, TP 3675 – 3690 – 3702 – 3721 – 3740
I will continue to share further updates if there are significant moves in price. Wishing everyone successful and effective trading.

XAUUSD H1 – Pennant + Head & ShouldersXAUUSD H1 – Pennant + Head & Shoulders: Two Key Levels 3657 / 3627
Hello Traders,
Gold opened the week with a bounce of over 20 points from the rising trendline and is now consolidating within a Pennant, which aligns with a small Head & Shoulders structure on the H1 chart. At the moment, the market is waiting for a breakout and confirmation to establish a clearer direction.
Pattern: A narrowing Pennant Flag alongside an H&S (left shoulder – head – right shoulder).
Key Zones to Watch
3655–3660: Crucial reaction zone (trendline + Pennant top).
3627: Critical support — a break below would invalidate the short-term bullish structure.
Fibonacci Levels:
1.618 in the mid-range, 2.618 lower — possible targets for a deeper correction.
MACD (12,26,9): Histogram has turned negative → short-term bearish momentum has the edge, though clear confirmation is still pending.
Trading Scenarios
Bullish Setup
Entry: Retest around 3654–3657
Targets: 3663 – 3670 – 3680 → 3695
Stop: Below 3648
Bearish Setup
Entry: Sell directly on breakdown, or wait for a retest near 3671–3674
Targets: 3663 – 3650 – 3633 – 3615 → 3595 → 3568 → 3540
Stop: Above 3679
the market is currently pricing in near certainty of a 0.25% Fed rate cut on 17th September, while the probability of a 0.50% cut still remains on the table.
If you find this analysis helpful, feel free to share your thoughts in the comments. I’ll update the outlook as soon as the price structure changes — follow me to get the latest setups first.

LiamTrading – XAUUSD Strategy for TodayI would like to share my personal view on gold for the day.
The overall trend in XAUUSD continues to be very strong, with the price consistently making fresh highs over the past two weeks. Buying interest has remained steady across sessions, while any corrections have been short-lived, mostly visible on the M15–M30 timeframes.
Yesterday, gold broke out of the Pennant pattern on the upside and is now consolidating near 3,680. On the H4 chart, this level aligns with an important Fibonacci zone, providing further technical confirmation.
From an Elliott Wave perspective, I expect Wave 3 to conclude near 3,700, followed by a corrective Wave 4 towards 3,660 – a level which has acted as reliable support in the past. After that, gold may enter its final Wave 5, with the potential to move towards the 3,740+ region.
Trading setups for consideration:
Buy 3658 – 3656, SL 3651, TP 3674 – 3688 – 3700 – 3715 – 3730 – 3744
Sell 3697 – 3700, SL 3705, TP 3688 – 3672 – 3660 – 3650
Sell 3740 – 3744, SL 3748, TP will be decided based on the price structure at that time
Important levels to keep in focus: 3673 – 3663 – 3635 and 3721, as these zones may trigger price reactions and could be useful for intraday scalping opportunities.
This is my personal outlook on gold for today. I hope it will be helpful to fellow traders in making better trading decisions. Kindly share your feedback in the comments.

XAUUSD – Pennant Pattern Waiting for ConfirmationXAUUSD – Pennant Pattern Waiting for Confirmation
Hello Traders,
Gold started the week with a strong bounce of nearly 20 dollars after testing the ascending trendline. This move further confirms the Pennant Flag formation that is currently in play. The key now is to wait for a clear breakout from this structure to position trades effectively.
Bullish Scenario
A break above the upper trendline, with confirmation ideally above 3657, would signal continuation of the uptrend.
Best entry: around 3650, targeting 3680 in the short term.
Bearish Scenario
The 3627 level is critical. A breakdown below this zone, along with a close under nearby support, would validate the bearish case.
Traders can either enter directly on the break or wait for a retest around 3630 for a cleaner entry.
Downside targets could extend to 356x or even lower.
Medium-Term Buy Setup
The 3560 – 3564 zone remains an attractive area, aligning with an FVG and strong volume accumulation.
This is a medium-term buying opportunity, with stop-loss placed below 3544.
Requires larger account size (above $1000) due to wider stop distance, but offers higher reward potential while aligning with the broader bullish trend.
This is my outlook for gold today. Traders can take it as a reference and align it with their own setups.
If you trade gold regularly, you can follow me here and join my community to receive updates quickly when the price action changes.
👉 Wishing everyone a profitable and disciplined trading week with Gold.

XAUUSD – Week 3: Will Fibo 2.618 Hold Strong?XAUUSD – Week 3: Will Fibo 2.618 Hold Strong?
Good day, fellow traders,
Gold has been on a continuous rise for the past three weeks, even making fresh all-time highs (ATH). This has made trading conditions quite challenging, especially for short-term traders. The reason is simple:
Buying: Not easy to find a good entry point.
Selling: Very risky as it means going against the strong uptrend, which can be extremely dangerous.
Market Structure and Key Levels
Gold has touched the psychological Fibonacci 2.618 extension and showed a reaction, after which it started consolidating sideways around 3643 – the closing price of this week.
The sideways structure indicates that the market may need more time before making a clear breakout.
The current trading range is between 3675 – 3616. Most likely, the price will continue to consolidate within this 60-dollar band and form a compression pattern.
Upside Scenario
If the price breaks above the range, the next target would be 3800, and in the longer term, the market could even aim for the 4000 level in the coming year.
Downside Scenario
Traders should keep an eye on liquidity reaction zones (FVG): 3595 – 3568 – 3540.
The key long-term buying zone lies around 3500, which would almost complete the liquidity test.
Trading Strategy
The wise approach is to remain patient and wait for a clear confirmation when price breaks out of the current sideways range. That will provide a higher-confidence setup for entering trades.
This is the scenario I am projecting for Gold this week. Traders may use it as a reference and combine it with their own analysis to optimise their trading strategy.
If you are actively trading Gold, feel free to follow me and join the community to get the quickest updates whenever price action changes.
Wishing all of you a disciplined, successful, and profitable trading week ahead!

Bitcoin – Trend Update Ahead of PPIBitcoin – Trend Update Ahead of PPI
Hello Traders,
The current scenario for Bitcoin is unfolding in line with expectations, with the uptrend continuing to develop strongly. Price waves are moving with solid volume, and the overall structure is progressing exactly as anticipated.
Key Levels
Price has broken through the 113k zone, confirming that the bullish trend is intact. This move increases the likelihood of completing the final wave of the inverse head-and-shoulders pattern.
The next level to watch is around 116k, where a mild reaction or pullback may occur before the trend resumes higher towards the 121k region.
Special attention should be given to the 117k level, as this marks the potential completion of the inverse head-and-shoulders structure. At this point, price may consolidate before establishing a new primary trend.
Trading View
For now, it remains important to follow the prevailing uptrend. Any shift in price structure will require re-evaluation, and updated strategies should be applied only after clear confirmation.
This is my latest outlook on Bitcoin ahead of the PPI release. I hope this perspective proves useful in shaping your trading approach.

XAUUSD – Latest Trend UpdateXAUUSD – Latest Trend Update
Hello Traders,
Gold is moving in line with yesterday’s outlook: after a corrective pullback towards 3660, price resumed its decline and is currently trending lower. If this bearish structure is confirmed on the higher timeframes such as H1 and H4, it may signal that a larger corrective phase on the D1 chart has already begun.
Key Levels to Watch
3620: Marked as an important support zone from yesterday, now considered the key level to confirm continued downside.
3630: Aligned with the lower boundary of the ascending channel, where a reaction could occur before the trend direction becomes clearer.
Medium-Term Scenarios
Gold could decline towards 3550, before bouncing higher again – this is the preferred medium-term scenario.
A deeper move towards 3510 is also possible, where liquidity from previous candle wicks may be retested, before the broader uptrend resumes on the daily timeframe.
The reason for favouring this medium-term downside: price has already completed the Fibonacci Extension 2.618, which often signals the potential for a corrective pullback.
Trading Strategy
Observe reactions around 3630 – 3620 – 3610 for potential buy opportunities aligned with the broader bullish structure.
Sell setups should only be considered if price closes firmly below 3620, confirming further downside momentum.
This is my trading plan for gold today. Use it as a reference and feel free to share your own perspective in the comments.

XAUUSD – Trend Outlook Ahead of PPIXAUUSD – Trend Outlook Ahead of PPI
Hello Traders,
Gold has moved close to the Fibonacci 2.618 extension and immediately reacted at this level. Price has already broken through the most recent minor low of the previous uptrend, which in my view indicates a violation of the bullish structure. For a confirmed shift in trend, another leg would be needed to form a more sustainable structure. Still, the basis for a sell bias is already present.
Fundamental Factor
The US PPI data is due today, with forecasts at 0.3% compared to 0.9% previously. If this projection turns out correct, gold could see another strong upward push. However, my view is that the data may not be as weak as expected, so traders should carefully observe the market reaction to the release before making entries.
Key Levels to Watch
3660: This level could be tested again and provide another reaction before a potential downward move begins. It remains the most attractive zone for initiating sell positions.
3318: Should gold confirm a Dow-style lower structure and break past old support, the deeper downside target may lie around this region.
Trading Strategy
The main strategy for today is to look for sell opportunities:
Best entry area: around 3660, if price retests and reacts.
Strong confirmation: once a candle closes below previous support, short positions can be taken with targets further down.
For intraday traders, scalping opportunities may be considered within the corrective range left from the US session yesterday, as the market redistributes price action.
This is my outlook on gold for today – use it as a reference and align it with your own strategy.

Bitcoin – Current Trend UpdateBitcoin – Current Trend Update
Hello Traders,
Bitcoin continues to follow the structure of an inverse head-and-shoulders pattern, which has not yet been invalidated. After testing the 113.5k zone, price once again reacted lower – this marks the third rejection at this level, confirming it as a key resistance area. For BTC to sustain its bullish momentum and complete the final wave of the formation, this zone will be crucial.
Scenarios to Watch
Bullish Case: The uptrend remains intact as long as price holds above 109k. In this case, buying opportunities are still valid.
Bearish Case: A sustained close below 109k would invalidate the bullish outlook and activate a bearish scenario. Traders should wait for confirmation before committing to shorts.
Short-Term View
On the lower timeframes, BTC is moving within a sideways range. For intraday traders, range strategies such as buying near support and selling near resistance can still be applied until a clear breakout occurs.
Market Sentiment
At the moment, most of the market’s attention is shifting towards gold, leaving Bitcoin with relatively lower momentum. This may keep BTC trading in a tighter range, so traders should lower expectations for strong volatility in the immediate term.
This is my trading outlook for today. Use it as a reference and feel free to share your own perspectives in the comments.

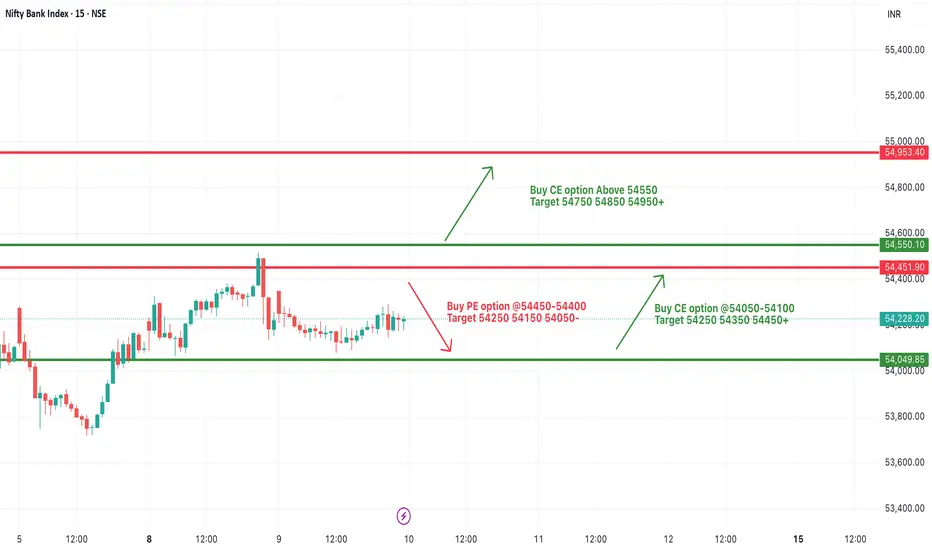
[INTRADAY] #BANKNIFTY PE & CE Levels(10/09/2025)Bank Nifty is likely to open with a gap up start, indicating positive momentum after recent consolidation. The index has been moving in a narrow range, and today’s levels could decide whether it continues consolidating or attempts a breakout.
On the upside, if Bank Nifty sustains above the 54,050–54,100 zone, a bullish move can be expected with targets at 54,250, 54,350, and 54,450+. A breakout above 54,550 may open the way for a stronger rally towards 54,750, 54,850, and 54,950+, signaling renewed buying strength.
On the downside, weakness may come into play if the index slips below 54,450–54,400. In such a case, short opportunities could emerge with targets at 54,250, 54,150, and 54,050. Sustained weakness below 54,000 would further expose Bank Nifty to deeper correction levels.
Currently, the index remains in a sideways consolidation phase, but traders should watch closely for a decisive breakout on either side. Intraday opportunities will be clearer once Bank Nifty holds above 54,550 or breaks below 54,050. Strict stop-loss management is advised to tackle volatility.
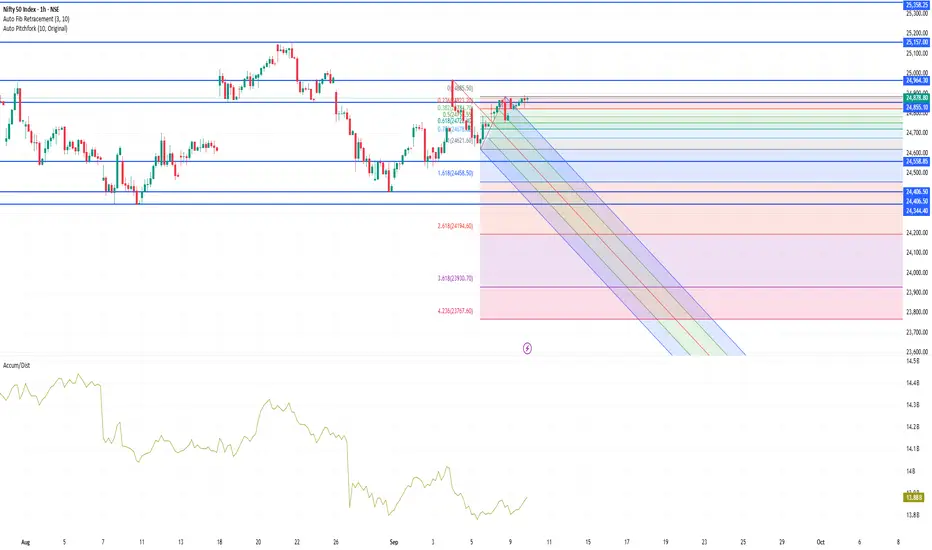
NIFTY50 index levelsKey Levels & Swing Trade Outlook (1-Hour Timeframe)
Resistance & Support (Broader Technical View)
Key Resistance Zones:
24,900–25,000 range (daily level)—a critical breakout area
Slightly higher potential if breakout occurs, toward 25,200+
Immediate Support Zones:
24,750–24,800 level
Broader range support at 24,620–24,700
More defensive base near 24,400 (longer-term)
Intraday Pivot Levels (Based on latest derived pivots)
From Moneycontrol, for the current trading session:
Classic Pivot R1: 24,855 | R2: 24,937 | R3: 24,989
Classic Pivot S1: 24,721 | S2: 24,669 | S3: 24,587
1-Hour Swing Trading Perspective
Although explicit 1-hour pivot data is not readily available, we can infer swing strategies using the broader technical context and typical indicators:
1-Hour Swing Fundamentals:
Use short-term moving averages (e.g., 20/50 EMA) to gauge trend direction. The index is trading above these on shorter timeframes, suggesting intraday bullish bias
Common indicators: RSI, Bollinger Bands, MACD, etc.
Bitcoin – Short-Term Trend ScenarioBitcoin – Short-Term Trend Scenario
Hello Traders,
Bitcoin is maintaining a bullish tone in the short term while still moving within a corrective structure on the medium-term horizon.
Chart Patterns
On the chart, a double-bottom formation has already completed and confirmed.
In a broader view, the market appears to be progressing towards a potential inverse head-and-shoulders pattern, with the current wave contributing to its completion. This structure would be confirmed if price retests the 117k zone.
Elliott Wave Outlook
From an Elliott Wave perspective, the current structure suggests that wave C has not yet been completed, leaving room for further upside.
MACD & Volume
MACD signals, along with trading volumes holding above average, continue to support the buying side, strengthening the bullish bias.
Trading Strategy
Long positions remain the preferred approach.
The 111k level stands out as a favourable intraday buying zone today, with higher probability of success if price pulls deeper into the rising trendline.
Conclusion
Technical signals collectively favour the bullish case for BTC in the short term. Monitoring reactions at the 111k zone and along the trendline will be essential for optimising entries. This is my perspective on the current market – feel free to share your own views in the comments.

XAUUSD – Early Week Trading ScenarioXAUUSD – Early Week Trading Scenario
Hello Traders,
The Asian session opened the new week with mild fluctuations in gold, followed by a pullback into the major liquidity zone created during last week’s bullish wave.
At present, price is showing signs of breaking below the 3585 support. If a strong M15 candle closes under this level, it can be considered a short-term correction signal. In that case, a light sell position may be initiated, targeting the 3560 zone.
The 3560 level stands out as a reliable support, aligning with the ascending trendline. This makes it a key area for buying in line with the prevailing uptrend, with the potential for price to extend higher and even revisit its all-time highs. However, if price climbs back to retest the trendline, any short positions from that area should be approached cautiously and only with clear confirmation.
Another potential buy zone lies near 3516, where the market previously cleared the liquidity from the closest FVG.
Overall, gold is likely to require some corrective moves before continuing its broader trend. In particular, short trades should only be considered when the reversal structure is clearly validated.
This is my trading perspective for gold today. Please take it as a reference for your own strategies.

Bitcoin – H4 Mid-Term AnalysisBitcoin – H4 Mid-Term Analysis
Hello Traders,
Bitcoin continues to trade within a wide sideways range. Despite the spike in volume following the recent NFP release, the market has not yet confirmed a dominant trend. Price action is still rotating within the 107k – 113k zone.
Elliott Wave Perspective
Wave 5 appears to have completed, and an A–B corrective structure is taking shape. This opens the possibility for one more upward leg before the next decisive move develops.
Trendline & Key Levels
A descending trendline is currently acting as resistance. It may offer early short opportunities, though a clear break below 107k is required to confirm a mid-term bearish outlook.
On the flip side, if price respects the trendline and bounces higher, a wave C rally could unfold.
Importantly, BTC is still holding above the rising channel, suggesting that bearish momentum remains limited for now.
Scenarios to Watch
Bullish Case:
If Bitcoin sustains above 107k and manages a breakout above 113k, momentum could extend towards 115k – 118k. Long positions can be considered once confirmation comes from stronger volume or a MACD crossover.
Bearish Case:
Failure to hold above 107k would expose the market to further downside, targeting 104k – 101k where strong historical support is located.
Professional Take
The market remains indecisive in the mid-term, with no clear directional bias yet. Traders should closely watch the reaction at 107k and the descending trendline to determine the next move. Flexibility and strict risk management are essential in this phase of heightened volatility.
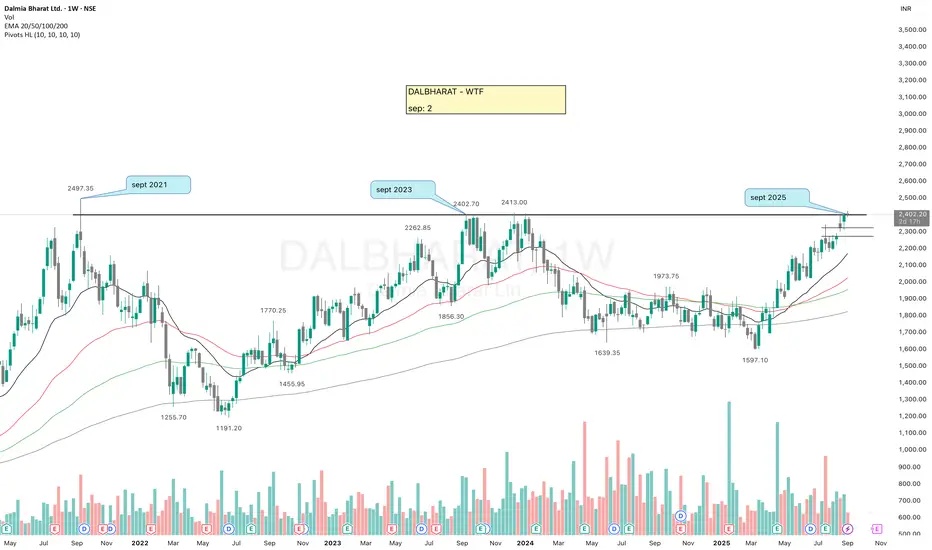
DALBHARAT - At 4yrs old Resistance LevelTechnical Analysis
DALBHARAT is currently at a strong 4-year-old resistance level, which it has interestingly tested three times in the month of September.
After forming a swing low near 1597 in early March, the stock turned bullish and established a HH-HL structure. Ideally, for a clean breakout, some consolidation near this level would strengthen the move. The overall structure remains bullish, and a decisive breakout here could trigger a strong upside rally.
Fundamental Analysis
PE Ratio: 48 – on the higher side, but broadly in line with the industry.
ROCE: 5.58% and ROE: 4.15% – both relatively weak.
Promoter Holding: Strong at 55.8%.
Pledged Shares: 0% – a positive sign.
✅ If you like my analysis, please follow me as a token of appreciation :)
in.tradingview.com/u/SatpalS/
📌 For learning and educational purposes only, not a recommendation. Please consult your financial advisor before investing.
TI (Tilaknagar Industries)TI is looking strong. After hitting a fresh ATH, the price has been consolidating and is now resting at a key demand zone.
All major EMAs are well aligned, adding to the strength.
Today, a Hammer candle has formed, taking support near the previous swing low. A breakout from here may give an upside move.
✅ If you like my analysis, please follow me as a token of appreciation :)
in.tradingview.com/u/SatpalS/
📌 For learning and educational purposes only, not a recommendation. Please consult your financial advisor before investing.

DRREDDYDRREDDY - The stock is showing strength as it trades above all the key EMAs, indicating bullish momentum. A clear volume pickup is visible, adding confirmation to the move.
After a healthy retracement, price has broken above the immediate resistance zone. If it sustains this breakout, there’s a strong probability of an extended upside move.
The last hammer candle took solid support at the 200 EMA, which often acts as a major trend indicator, this bounce further validates the underlying strength.
Defining stop-loss and position sizing is crucial to manage downside risk, even in strong setups.
✅ If you like my analysis, please follow me as a token of appreciation :)
in.tradingview.com/u/SatpalS/
📌 For learning and educational purposes only, not a recommendation. Please consult your financial advisor before investing.

Gold Trading Scenario – Start of the WeekGold Trading Scenario – Start of the Week
Hello traders,
A new week begins with gold holding above the 34xx zone, establishing a fresh value area. The current structure has already broken through major resistance levels on the higher timeframe – including trendline and H4 barriers – confirming strong bullish momentum.
The uptrend played out exactly as expected, reaching the target around 3450 (specifically 3454). Now price is seeing a mild pullback. This will only be considered a trend reversal if price breaks below 3404. Otherwise, it is just a secondary correction as per Dow theory.
Wave 5 may be complete, but the ABC structure is still unclear. For that reason, the plan is to continue with long positions in line with the trend, which increases the probability of success.
Buy zone for today: 3408–3412, an area where sellers previously failed at resistance and which was broken through the trendline on Friday.
This is my outlook for Monday, viewed from a medium-term perspective. Take it as reference, and feel free to share your thoughts in the comments.

MASTEKMASTEK has successfully re-tested its breakout zone and posted a strong bullish candle, closing firmly above the 2566 resistance level.
Price action shows tight consolidation near the swing-high supply zone with a series of higher-lows, reflecting strong accumulation.
Volume had been drying up till now; today’s green candle came with noticeable volume, strengthening the breakout conviction.
The stock is sustaining above all key EMAs, further reinforcing bullish momentum.
A decisive follow-through above 2600 could open room for the next leg higher.
Keep it on your watchlist and prepare your paper trade plans.
✅ If you like my analysis, please follow me as a token of appreciation :)
in.tradingview.com/u/SatpalS/
📌 For learning and educational purposes only, not a recommendation. Please consult your financial advisor before investing.

Bitcoin Confirms Downtrend – Short Setup ActivatedBitcoin Confirms Downtrend – Short Setup Activated
Hello traders,
BTC is showing clear bearish momentum as it has broken below a key support level and also dropped out of the rising channel. With price now trading steadily under this zone, the downtrend is confirmed.
The strategy from here is to wait for a pullback and then enter a short. The 111k level looks like a strong entry zone, as price could retest the broken channel and form a clean Dow structure for the next leg lower.
Short setup: Entry around 111k, with a target at 105k.
Buy opportunity (short-term): Around 105k, traders can also look for a quick Long to capture a reaction move as liquidity is taken and to offset any trapped sell positions.
The primary view in the medium term remains bearish.
This is my outlook on BTC for the sessions ahead. Take it as reference and adjust your trading plan to fit your own strategy.

Bearish Hammer with EMA High-Low Band - Rule Based Entry 🔹 Intro / Overview
The Bearish Hammer candlestick is a signal of potential downside reversal.
It forms when buyers push price higher, but sellers regain control and close the candle near its low.
When combined with EMA High–Low Band confirmation, it creates a disciplined setup to identify short trade opportunities with clear rules.
---
📖 How to Use
✅ Validation → A valid signal occurs when the close price is below the low of the Bearish Hammer.
❌ Invalidation → If the close price crosses above the high of the Bearish Hammer, the signal is invalid. (Before validation )
EMA Band Confirmation:
- The Bearish Hammer must be above the EMA High–Low Band.
- The EMA High-Low band should not touch the Bearish Hammer.
- This ensures the setup aligns with bearish conditions.
✅ Bearish Hammar High must be swing high
---
🎯 Trading Plan
Entry → Enter short when the close price is below the Hammer’s low (validation line).
Stop-Loss (SL) → The high of the Bearish Hammer candle(Swing High)
Target (TP):
- First Target → 1R (equal to the risk defined by Entry–SL distance).
- Remaining Lots → Trail using ATR, Fibonacci levels, Box Trailing, or structure-based stops.
---
📊 Chart Explanation
- The Bearish Hammer shows rejection of higher prices, with a small body near the low and a long upper shadow.
- The EMA High–Low Band sits below the candle, and the Hammer forms above the band (no touch), confirming the setup.
- Validation occurs when the next close is below the Hammer’s low.
- Invalidation occurs if price closes above the Hammer’s high(before Validation)
---
👀 Observation
Bearish Hammer Behavior → Most effective after an uptrend or at resistance zones.
EMA Role → Ensures trade alignment with broader market bias.
Risk Management → SL above Hammer high, TP at least 1:1, with trailing options for extended downside moves.
---
❗ Why It Matters?
- Shows buyers losing strength.
- Sellers step back in and dominate.
- EMA Band ensures cleaner filtering of weak signals.
- Provides a strict framework for entry, SL, and targets.
---
🎯 Conclusion
The Bearish Hammer, combined with EMA High–Low Band confirmation, creates a structured short setup.
Using strict validation, devalidation, and risk management, traders can filter false signals and ride potential bearish moves with confidence.
🔥 Patterns don’t predict. Rules protect.
---
⚠️ Disclaimer
For educational purposes only · Not SEBI registered · Not a buy/sell recommendation · Not financial advice — purely a learning resource.
