TECHM intraday chartThis is just a trading discussion.
Today TECHM reversed from upper trend line indicating resistance at those levels also Higher high structure at 530 level was broken which gives us warning of short term trend reversal. So the overall bias turns to be negative. Today's High and low (marked on the chart) will play a crucial role in determining the direction. If high is broken with volume and price sustains at that level up movement will be fast. Red lines marked on the chart will act as support/resistance.
Techmahindra


Techmanidra Upward rising channelLong Positions can be made in tech mahindra as since its near it support line

TECHMIt has given a fresh breakdown in hourly time frame which suggest a retest of 500 and then 460. View would be negated above 555

Long Long for Tech Mahindra with Price Levels and Flow Diagram
Ascending Triangle Formation
Flow Diagram with Price Levels


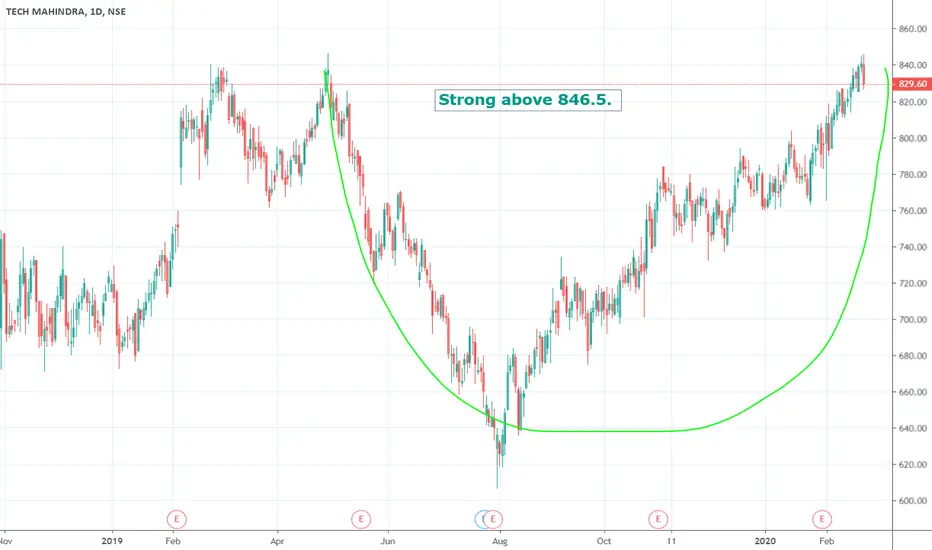

TECHM - Bullish above 841Can consider TechM bullish above 841 based on chart analysis and previous reversal trend
Keep on radar.

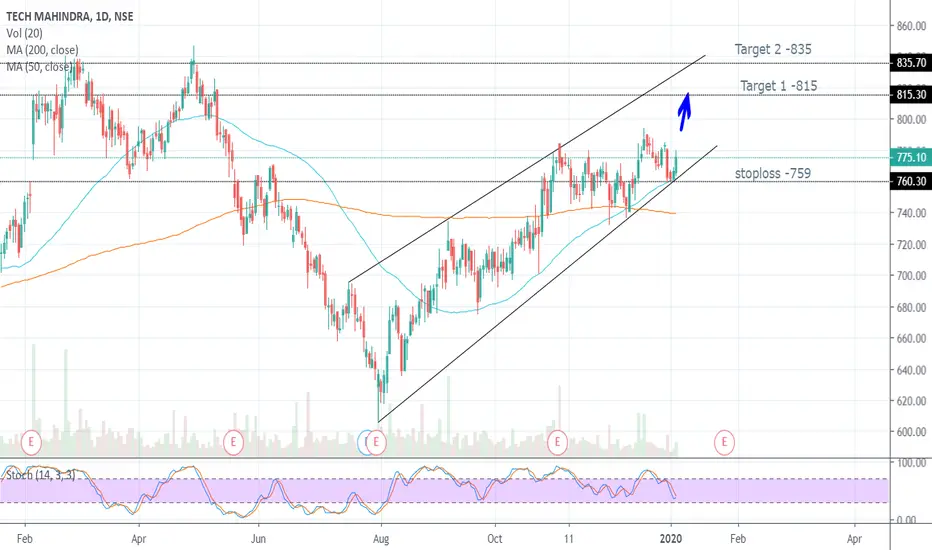
TechM TechM looks good to buy for long term. Trading in ascending channel with targets of 815 and 835.

Tech Mahindra Pure Price ActionThe price is at a very crucial zone in the Weekly. A mountain pattern is forming in the Weekly. You can call it Head and Shoulders. Facing stiff resistance from the Weekly area.
In the Daily, the long term TL has been broken comfortably on 2nd Dec. The recent trend was already down. Price is seen moving in this parallel channel. Today, we are seeing a rejection of channel upper line, LT Trend Line and monthly zone.
The short term trend line has been broken in the 75 min and price has made Lower High and Lower Low.
In the 15 min, the EMA crossover can be seen, and price breaks below EMAs and Pivot trigerring a short.


