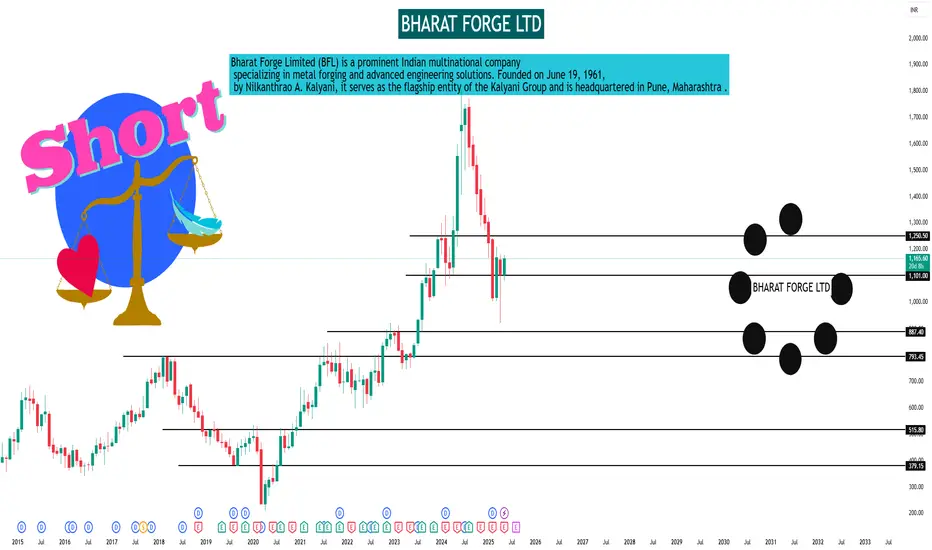
BHARAT FORGE LTDAs of May 9, 2025, Bharat Forge Ltd. (NSE: BHARATFORG) closed at ₹1,165.60. Below are the key monthly support and resistance levels based on various technical analyses:
📊 Monthly Support & Resistance Levels
Standard Pivot Points
Pivot Point: ₹1,215.77
Support Levels:
S1: ₹1,067.43
S2: ₹955.87
S3: ₹807.53
Resistance Levels:
R1: ₹1,327.33
R2: ₹1,475.67
Fibonacci Levels
Pivot Point: ₹1,067.43
Support Levels:
S1: ₹968.15
S2: ₹906.82
S3: ₹807.53
Resistance Levels:
R1: ₹1,166.72
R2: ₹1,228.05
R3: ₹1,327.33
Camarilla Levels
Pivot Point: ₹1,067.43
Support Levels:
S1: ₹1,080.38
S2: ₹1,056.55
S3: ₹1,032.73
Resistance Levels:
R1: ₹1,128.02
R2: ₹1,151.85
R3: ₹1,175.67
Woodie's Levels
Pivot Point: ₹1,076.62
Support Levels:
S1: ₹974.25
S2: ₹816.72
Resistance Levels:
R1: ₹1,234.15
R2: ₹1,336.52
Demark Levels
Pivot Point: ₹1,141.60
Support Level:
S1: ₹881.70
🔍 Observations
The stock is currently trading near the Fibonacci R1 level of ₹1,166.72, indicating potential resistance.
The Camarilla R2 level at ₹1,151.85 has recently been surpassed, suggesting bullish momentum.
Key support levels to monitor include ₹1,067.43 (Standard S1) and ₹1,056.55 (Camarilla S2).
Technical
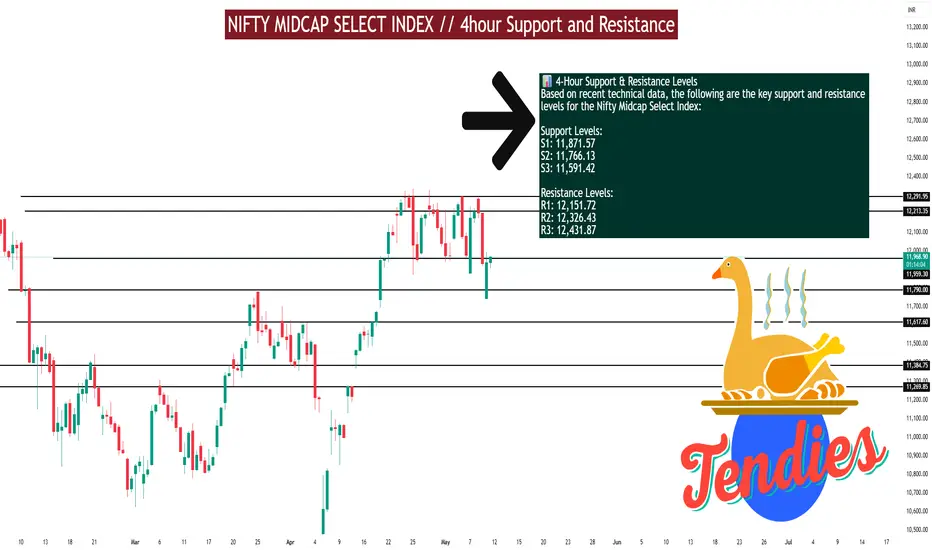
Nifty Midcap Select IndexAs of May 9, 2025, the Nifty Midcap Select Index is exhibiting a mildly bullish trend on the 4-hour timeframe, supported by various technical indicators and pivot point analyses.
📊 4-Hour Support & Resistance Levels
Based on recent technical data, the following are the key support and resistance levels for the Nifty Midcap Select Index:
Support Levels:
S1: 11,871.57
S2: 11,766.13
S3: 11,591.42
Resistance Levels:
R1: 12,151.72
R2: 12,326.43
R3: 12,431.87
🔍 Technical Indicators (4-Hour Timeframe)
Relative Strength Index (RSI): 74.96 – approaching overbought territory, suggesting potential for a short-term pullback.
Moving Average Convergence Divergence (MACD): 250.27 – indicates bullish momentum.
Average Directional Index (ADX): 25.11 – signifies a strengthening trend.
Stochastic Oscillator: 96.87 – overbought condition, caution advised.
Supertrend Indicator: Positioned at 11,824.56 – currently acting as a support level.
Parabolic SAR: 11,733.42 – below the current price, reinforcing the bullish stance.
📈 Trend Analysis
The index is trading above its 5-period and 15-period simple moving averages on the 4-hour chart, indicating a mild bullish crossover. This suggests continued upward momentum in the near term.
⚠️ Trading Insights
Bullish Scenario: A sustained move above 12,151.72 could open the path toward 12,326.43 and potentially 12,431.87.
Bearish Scenario: Failure to hold above 11,871.57 may lead to a retest of 11,766.13 or even 11,591.42.
NIFTY BANK INDEX Nifty Bank Index – 15-Minute Timeframe (As of May 9, 2025)
📌 Intraday Support & Resistance (15-min Chart):
🔻 Support Levels:
53,500 – Strong intraday support; multiple bounces seen here
53,200 – Minor support from morning session
52,900 – Gap-fill zone and previous demand area
🔺 Resistance Levels:
53,850 – VWAP + supply rejection area
54,200 – Key resistance from early session high
54,500 – Major barrier; breakdown retest level
📉 Intraday View: Trend remains weak below 54,200; bulls need a reclaim above 54,500 for momentum. Short-term scalpers should watch price action around VWAP (near 53,850).

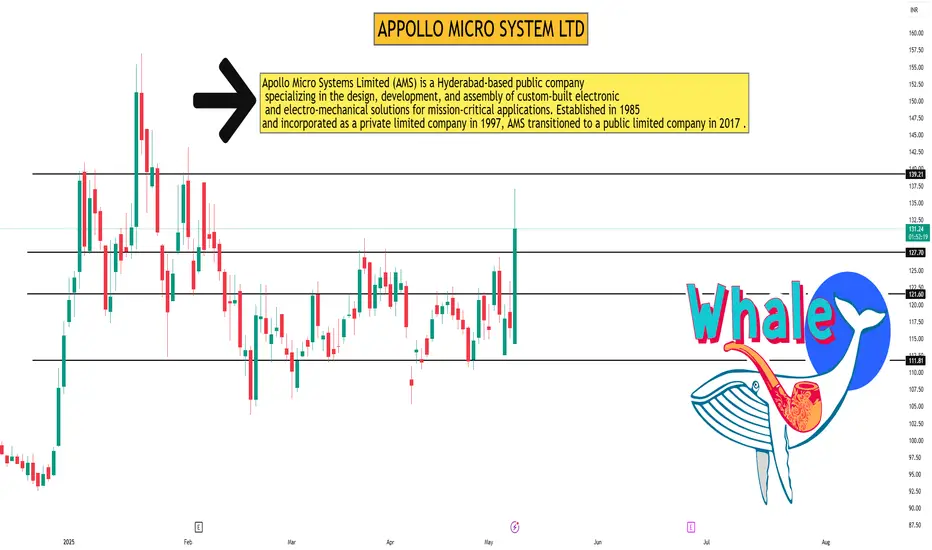
APPOLLO MICRO SYSTEM LTD Apollo Micro Systems Ltd – 1D Timeframe (As of May 9, 2025)
📌 Support & Resistance Levels (1-Day Chart Analysis):
Resistance Levels:
₹137.00 – Intraday high; strong near-term resistance
₹145.00 – Previous swing high and psychological level
₹157.00 – 52-week high, major resistance zone
Support Levels:
₹127.00 – VWAP zone; near-term intraday support
₹120.00 – Recent consolidation zone and demand area
₹114.30 – Today’s opening and previous base; key downside support
🔍 Technical Note: RSI is nearing overbought territory; price may consolidate below ₹137 unless a breakout is confirmed on high volume.
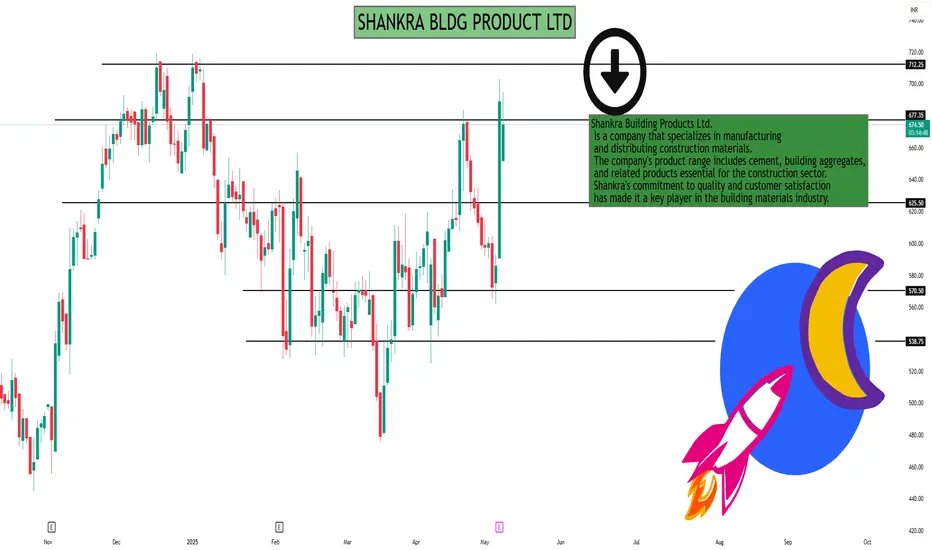
SHANKRA BLDG PRODUCT LTDAs of May 9, 2025, Shankara Building Products Ltd. (NSE: SHANKARA) is trading at ₹689.05, reflecting a 17.62% increase over the past 24 hours .
📊 Intraday Support & Resistance Levels
Based on technical analyses, the following are the key intraday support and resistance levels for SHANKARA:
Standard Pivot Points:
Support Levels:
S1: ₹647.02
S2: ₹625.53
S3: ₹586.52
Resistance Levels:
R1: ₹707.52
R2: ₹746.53
R3: ₹768.02
Pivot Point: ₹686.03
Camarilla Pivot Points:
Support Levels:
S1: ₹659.00
S2: ₹653.46
S3: ₹647.91
Resistance Levels:
R1: ₹670.10
R2: ₹675.64
R3: ₹681.19
Pivot Point: ₹647.02
+2
Fibonacci Pivot Points:
Support Levels:
S1: ₹647.02
S2: ₹623.91
S3: ₹609.63
Resistance Levels:
R1: ₹670.13
R2: ₹684.41
R3: ₹707.52
Pivot Point: ₹647.02
🔍 Technical Indicators
Moving Averages (MA): The stock is currently trading above its short-term moving averages, indicating a bullish trend.
Relative Strength Index (RSI): The RSI is in the overbought zone, suggesting that the stock may be overvalued in the short term.
MACD: The MACD line is above the signal line, reinforcing the bullish momentum.
📈 Trading Insights
Given the current price of ₹689.05, the stock is trading near its R1 resistance level of ₹707.52. Traders should monitor for a breakout above this level for potential upward movement. Conversely, if the stock retraces, the S1 support level at ₹647.02 may provide a buying opportunity.
MACD Trading ( Moving Average Convergence/Divergence) The Moving Average Convergence/Divergence indicator is a momentum oscillator primarily used to trade trends. Although it is an oscillator, it is not typically used to identify over bought or oversold conditions. It appears on the chart as two lines which oscillate without boundaries.

How to Trade ? (Basic to Advance)Open a Demat account. The first step is to open a Demat account, which serves as a digital repository for your stocks. ...
Understand stock terms. ...
Bids and asks. ...
Fundamental and technical knowledge of stocks. ...
Learn to set stop loss orders. ...
Seek expert advice. ...
Start with safer stocks.

Institution TradingInstitutional trading refers to the buying and selling of financial assets by large organizations, like financial institutions, on behalf of their clients or members. These institutions manage large pools of capital and can significantly impact market prices and trends due to their size and trading volume. Unlike retail traders, institutional traders often have access to a wider range of investment opportunities and strategies.

Advanced Trading part 2Advanced trading strategies usually involve multiple technical indicators and more complicated instruments, such as options and futures

Institutional Trading part 4Institutional traders buy and sell securities for accounts they manage for a group or institution. Retail traders buy or sell securities for personal accounts. Institutional traders usually trade larger sizes and can trade more exotic products.

Management and PsychologyMarket psychology is the study of herd behavior and sentiment among economic actors, such as businesses, traders, or consumers. By studying the prevalence of greed, fear, or euphoria in the market, skilled traders can forecast future price movements and fluctuations in supply and demand.

Divergence Based TradingDivergence occurs when the stochastic oscillator's peaks or troughs disagree with the price. For instance, if the stochastic makes lower highs while the price is rising, it indicates a bearish divergence. Likewise, higher stochastic lows against lower price lows indicate a bullish divergence.

Support and Resistance'Support' and 'resistance' are terms for two respective levels on a price chart that appear to limit the market's range of movement. The support level is where the price regularly stops falling and bounces back up, while the resistance level is where the price normally stops rising and dips back down.

Support and ResistanceSupport is a price point below the current market price that indicate buying interest. Resistance is a price point above the current market price that indicate selling interest.

Advanced TradingAdvanced trading strategies usually involve multiple technical indicators and more complicated instruments, such as options and futures.

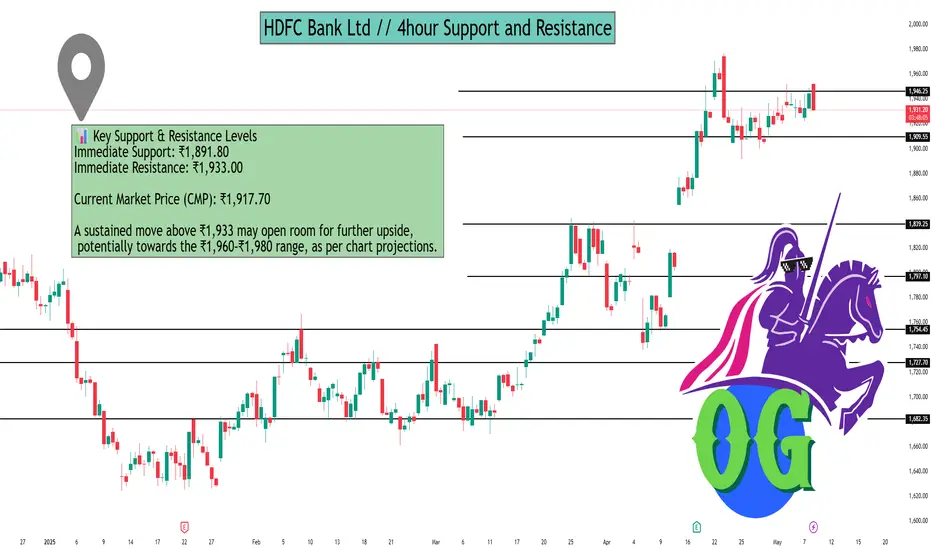
HDFC Bank Ltd // 4hour Support and ResistanceAs of May 8, 2025, here are the key 4-hour support and resistance levels for HDFC Bank Ltd (NSE: HDFCBANK), based on recent technical analyses and pivot point calculations:
📊 Key Support & Resistance Levels
Immediate Support: ₹1,891.80
Immediate Resistance: ₹1,933.00
Current Market Price (CMP): ₹1,917.70
A sustained move above ₹1,933 may open room for further upside, potentially towards the ₹1,960–₹1,980 range, as per chart projections.
🔁 Pivot Point Levels (Daily)
Pivot Type Support Levels Resistance Levels
Classic S1: ₹1,938.90S2: ₹1,929.10S3: ₹1,912.60 R1: ₹1,965.20R2: ₹1,981.70R3: ₹1,991.50
Fibonacci S1: ₹1,938.90S2: ₹1,928.85S3: ₹1,912.60 R1: ₹1,955.15R2: ₹1,965.20R3: ₹1,981.70
Camarilla S1: ₹1,943.19S2: ₹1,940.78S3: ₹1,938.37 R1: ₹1,948.01R2: ₹1,950.42R3: ₹1,952.83
Woodie S1: ₹1,940.57S2: ₹1,932.45 R1: ₹1,958.75R2: ₹1,966.87
Demark S1: ₹1,934.00 R1: ₹1,960.30
📈 Technical Indicators
Relative Strength Index (RSI): 72.46 (Strong Uptrend)
Stochastic RSI: 0.92 (Strong Uptrend)
Commodity Channel Index (CCI): 130.18 (Strong Uptrend)
Money Flow Index (MFI): 86.61 (Strong Uptrend)
These indicators suggest a strong bullish momentum, indicating potential upward movement if buying interest continues.
📌 Trading Insights
Bullish Scenario: A decisive breakout above ₹1,933 could lead to a rally towards ₹1,960–₹1,980.
Bearish Scenario: If the price falls below ₹1,891.80, it may test lower support levels around ₹1,870.69.
Neutral Zone: The area between ₹1,891.80 and ₹1,933 is critical; price action within this range may indicate consolidation before the next significant move.
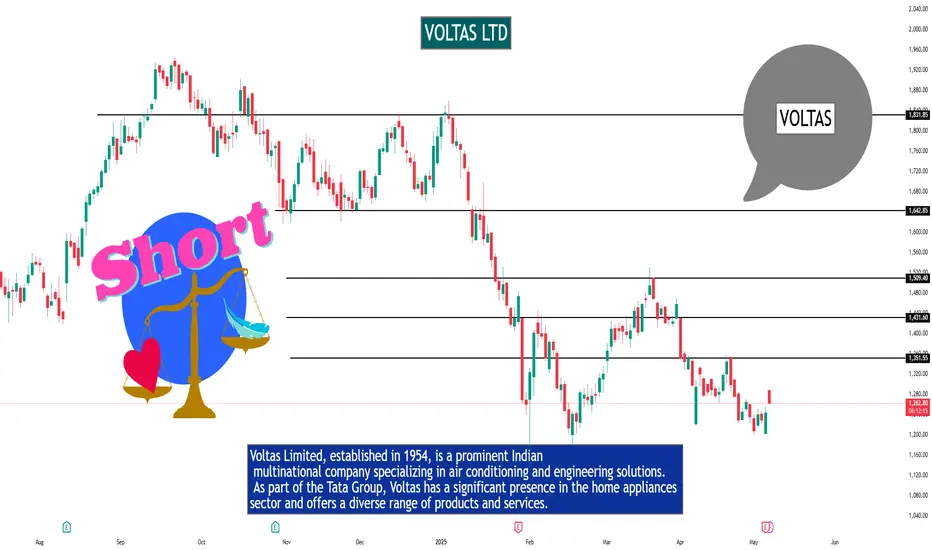
VOLTAS LTDVoltas India Ltd view for Intraday 8th May #VOLTAS
Resistance 1260 Watching above 1263 for upside movement...
Support area 1230 Below 1240 ignoring upside momentum for intraday
Watching below 1228 for downside movement...
Above 1240 ignoring downside move for intraday
Charts for Educational purposes only.
Please follow strict stop loss and risk reward if you follow the level.
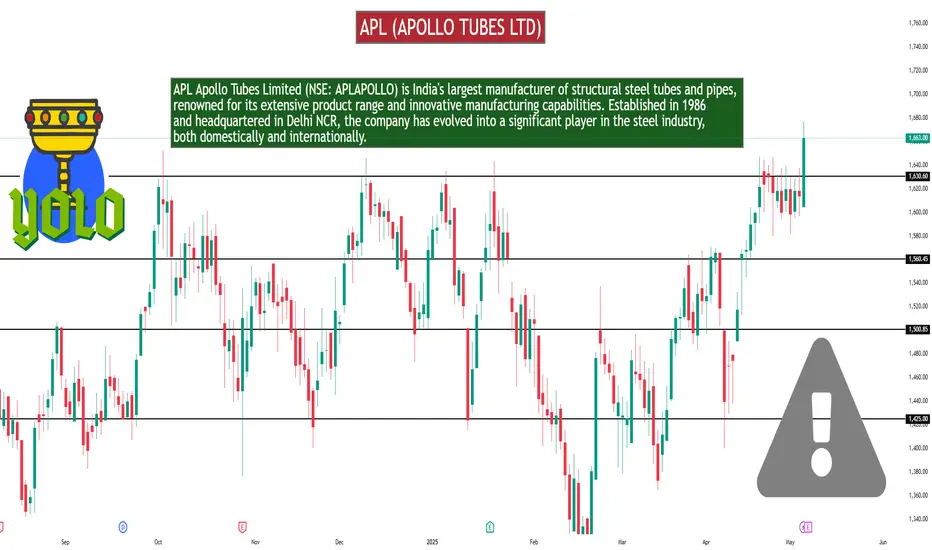
APL (APOLLO TUBES LTD)As of May 6, 2025, here are the key intraday support and resistance levels for APL Apollo Tubes Ltd (NSE: APLAPOLLO):
📊 Intraday Support & Resistance Levels
Standard Pivot Points:
Support Levels:
S1: ₹1614.17
S2: ₹1599.23
S3: ₹1580.17
Resistance Levels:
R1: ₹1648.17
R2: ₹1667.23
R3: ₹1682.17
Fibonacci Pivot Points:
Support Levels:
S1: ₹1614.17
S2: ₹1601.18
S3: ₹1593.15
Resistance Levels:
R1: ₹1635.18
R2: ₹1648.17
R3: ₹1656.20
Camarilla Pivot Points:
Support Levels:
S1: ₹1615.18
S2: ₹1612.07
S3: ₹1608.95
Resistance Levels:
R1: ₹1621.42
R2: ₹1624.53
R3: ₹1627.65
The current price of APL Apollo Tubes Ltd is trading above the Camarilla R3 and Fibonacci R1 levels, indicating strong bullish momentum. Traders may consider these levels for potential entry or exit points, keeping in mind that surpassing the R3 levels could suggest overbought conditions, while approaching S1 or S2 levels might indicate potential support zones.
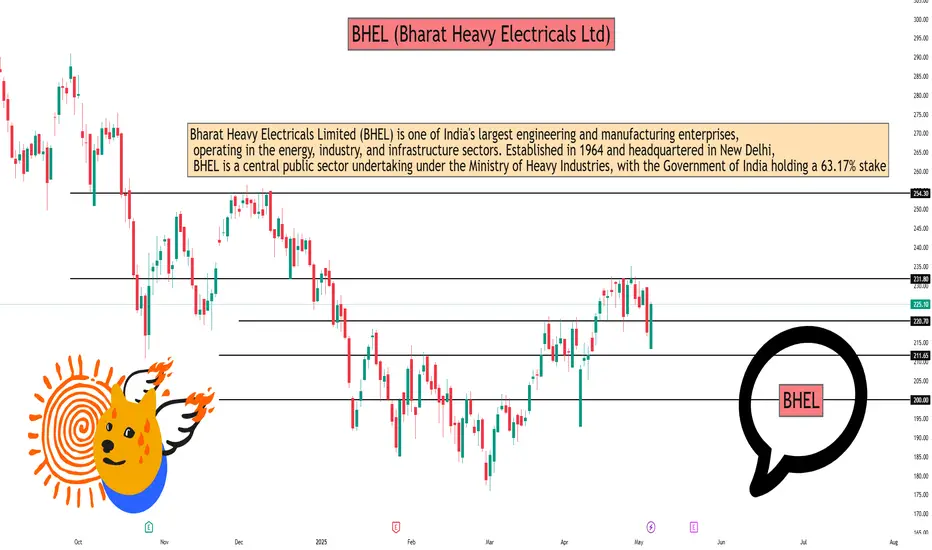
BHEL (Bharat Heavy Electricals Ltd)STOCK BREAKOUT
STOCK: Bharat Heavy Electricals Ltd (BHEL)
CMP: 225
KEEP SUPPORT : 220
TARGET: 235.
In the latest short-term technical analysis, Bhel has shown a strong and consistent bullish trend, indicating the potential for an extended upward move.
The stock is currently trading at *225 and holding above a key support level at *220. This support zone serves as a critical point for risk management.
→ Given the bullish momentum, traders are advised to consider a buying opportunity with a stop-loss placed strategically at *220 to manage downside risk.
The target for this trade is set at *235, suggesting a favorable risk-to-reward ratio and a continuation of the prevailing upward trend.
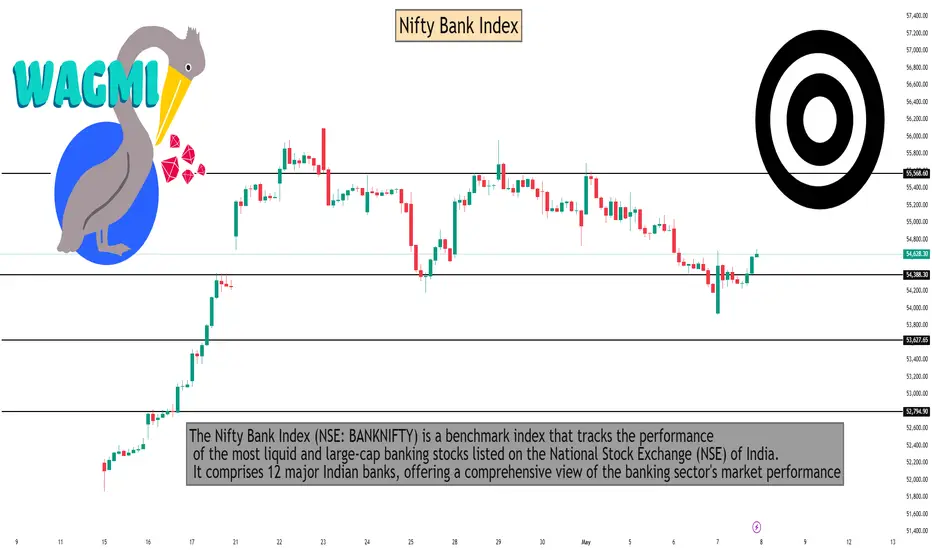
Nifty Bank Index As of May 8, 2025, here are the key intraday support and resistance levels for the Nifty Bank Index (BANKNIFTY), based on various pivot point calculations:
📊 Intraday Support & Resistance Levels
Pivot Type Support Levels Resistance Levels
Classic S1: 54,125.76S2: 53,640.63S3: 53,361.36 R1: 54,890.16R2: 55,169.43R3: 55,654.56
Fibonacci S1: 54,113.03S2: 53,932.63S3: 53,640.63 R1: 54,697.03R2: 54,877.43R3: 55,169.43
Camarilla S1: 54,540.83S2: 54,470.76S3: 54,400.69 R1: 54,680.97R2: 54,751.04R3: 54,821.11
Woodie S1: 54,228.70S2: 53,692.10 R1: 54,993.10R2: 55,220.90
Demark S1: 54,265.40 R1: 55,029.80
Note: The central pivot point (PP) across these methods is approximately 54,405.03.h
🔍 Observations
Immediate Support: The 54,000–54,200 range is a crucial support zone. A breach below this could indicate a bearish trend.
Immediate Resistance: The 54,800–55,200 range serves as a significant resistance area. Sustained trading above this may suggest bullish momentum.
Technical Indicators: The Relative Strength Index (RSI) for Nifty Bank is currently in the neutral zone (45–55), indicating a balanced market without a clear bullish or bearish bias.
📈 Trading Strategy Tips
Bullish Scenario: If the index maintains levels above 54,800, it may target the 55,200–55,650 range.
Bearish Scenario: A drop below 54,000 could lead to further declines toward 53,600 or lower.
Neutral/Bounce Zone: The area between 54,400 and 54,700 is pivotal. Monitoring price action here can provide insights into potential breakouts or reversals
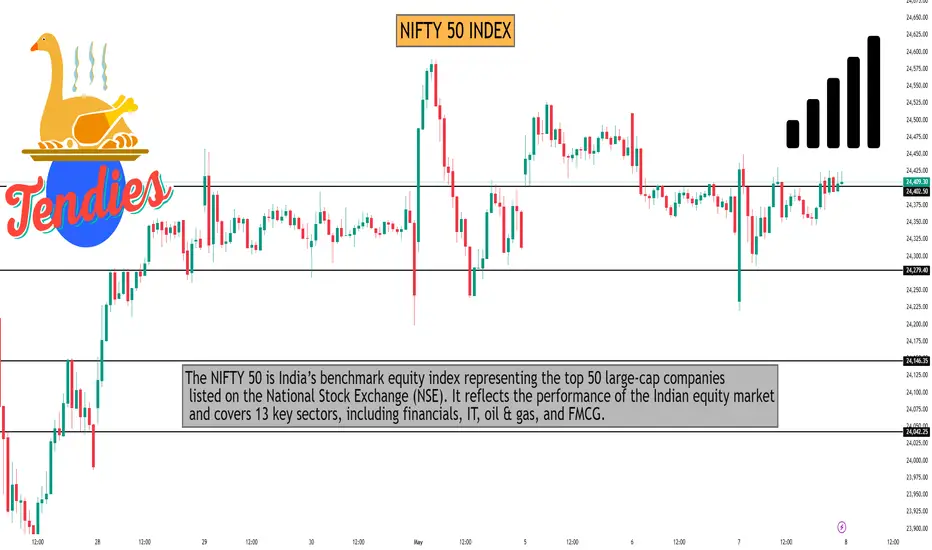
NIFTY 50 INDEXNifty Expiry Day Game Plan (15-Min Chart)
Key Level: 24,300 - Strong Support
Bullish Scenario (High Probability)
✦ If market holds above 24,300:
Look for bullish candles or retest bounce.
Target 1: 24,500
Target 2: 24,800 (in upcoming sessions)
X Bearish Scenario (Only if Breakdown)
✰ If price breaks & closes below 24,300 with volume:With followed Candle Need to Sustain
Target: 24,110
Why this Zone -Prior selling seen below this zone
us Federal Reserve leaves interest rates unchanged, remains at 4.25% - 4.50%.
But warns of potential slowdown in achieving Federal Reserve's objectives.
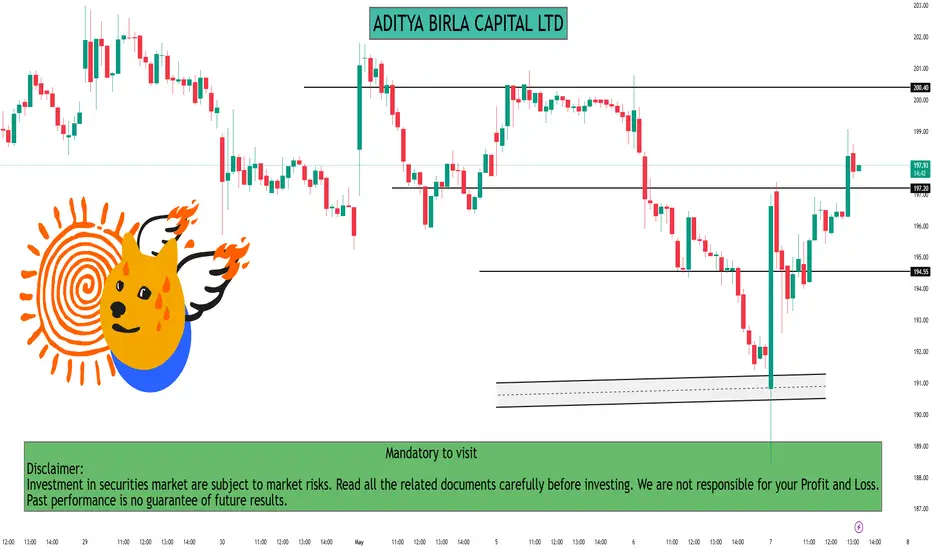
ADITYA BIRLA CAPITAL LTD Company Name: Aditya Birla Capital Ltd (NSE: ABCAPITAL)
Sector: Financial Services
Market Cap: Large Cap | ~₹53,000 Cr
Headquarters: Mumbai, India
Parent Group: Aditya Birla Group
🧾 Business Overview:
Aditya Birla Capital is a diversified financial services player offering a wide range of solutions across:
Lending: Personal, SME, and housing loans through Aditya Birla Finance
Asset Management: One of India's top AMC players via joint venture with Sun Life
Insurance: Life and health insurance products
Wealth & Broking: Wealth management, equity broking, and portfolio management services
💼 Key Strengths:
Strong backing of Aditya Birla Group
Wide distribution network across India
Growing AUM and diversified revenue streams
Focus on digital and retail loan expansion
📊 Stock Insight:
NSE Symbol: ABCAPITAL
52-Week Range: ₹153 – ₹225
Trend: Medium-term bullish with support near ₹209
Support and Resistance Levels (Intraday – 15M):
Immediate Resistance: ₹215.50
(Price tested this level twice, indicating strong short-term selling pressure.)
Next Resistance: ₹218.20
(Gap-fill zone; breakout above this may trigger momentum buying.)
Immediate Support: ₹211.70
(Recent bounce zone and short-term base.)
Strong Support: ₹209.50
(Multiple rejections below this level; buyers likely to defend.)
Trend Insight:
Price is consolidating in a narrow range between ₹211.70 and ₹215.50. A breakout above or below this band may set the next directional move.
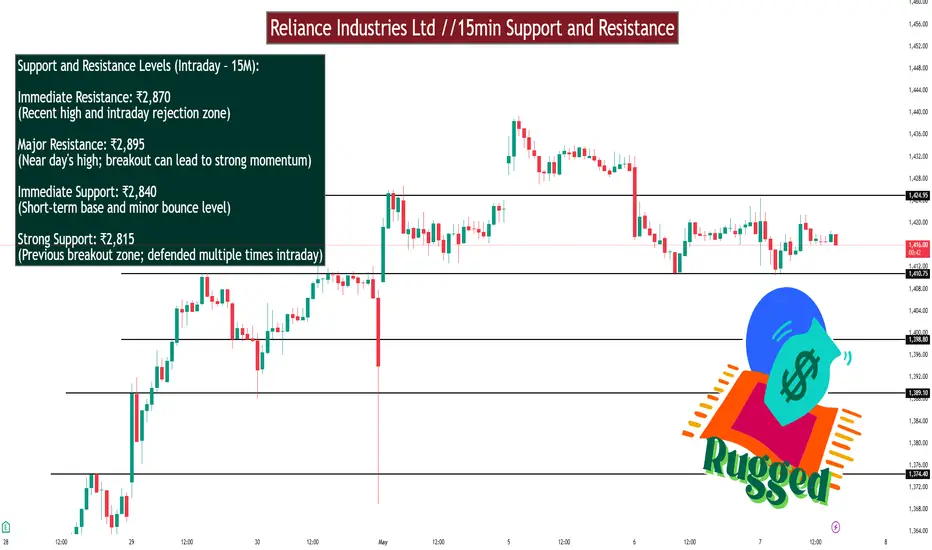
Reliance Industries Ltd //15min Support and ResistanceRELIANCE INDUSTRIES LTD – 15-Minute Chart Support & Resistance
Support and Resistance Levels (Intraday – 15M):
Immediate Resistance: ₹2,870
(Recent high and intraday rejection zone)
Major Resistance: ₹2,895
(Near day's high; breakout can lead to strong momentum)
Immediate Support: ₹2,840
(Short-term base and minor bounce level)
Strong Support: ₹2,815
(Previous breakout zone; defended multiple times intraday)
Trend Insight:
RELIANCE is trading in a rising channel, with buyers stepping in around ₹2,840. Sustained move above ₹2,870 may trigger an upside breakout.