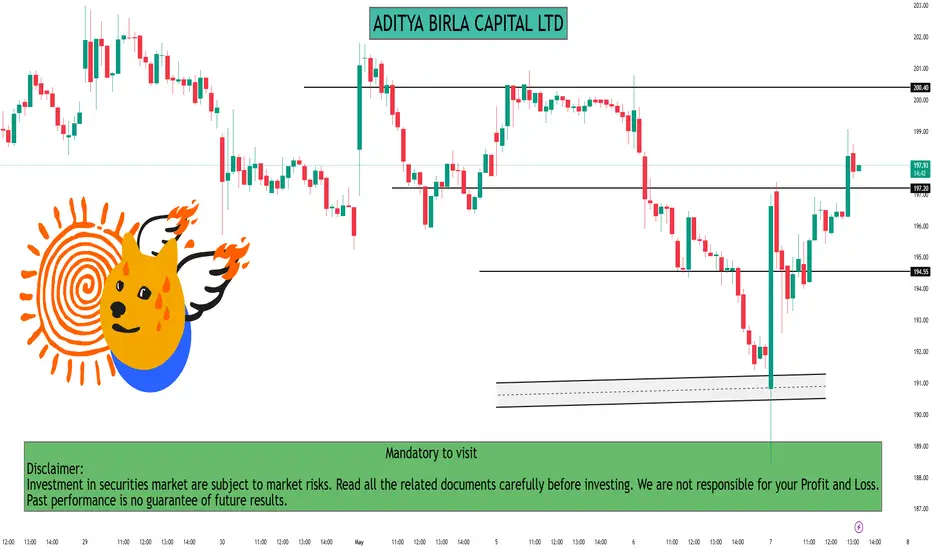
ADITYA BIRLA CAPITAL LTD Company Name: Aditya Birla Capital Ltd (NSE: ABCAPITAL)
Sector: Financial Services
Market Cap: Large Cap | ~₹53,000 Cr
Headquarters: Mumbai, India
Parent Group: Aditya Birla Group
🧾 Business Overview:
Aditya Birla Capital is a diversified financial services player offering a wide range of solutions across:
Lending: Personal, SME, and housing loans through Aditya Birla Finance
Asset Management: One of India's top AMC players via joint venture with Sun Life
Insurance: Life and health insurance products
Wealth & Broking: Wealth management, equity broking, and portfolio management services
💼 Key Strengths:
Strong backing of Aditya Birla Group
Wide distribution network across India
Growing AUM and diversified revenue streams
Focus on digital and retail loan expansion
📊 Stock Insight:
NSE Symbol: ABCAPITAL
52-Week Range: ₹153 – ₹225
Trend: Medium-term bullish with support near ₹209
Support and Resistance Levels (Intraday – 15M):
Immediate Resistance: ₹215.50
(Price tested this level twice, indicating strong short-term selling pressure.)
Next Resistance: ₹218.20
(Gap-fill zone; breakout above this may trigger momentum buying.)
Immediate Support: ₹211.70
(Recent bounce zone and short-term base.)
Strong Support: ₹209.50
(Multiple rejections below this level; buyers likely to defend.)
Trend Insight:
Price is consolidating in a narrow range between ₹211.70 and ₹215.50. A breakout above or below this band may set the next directional move.
Technical
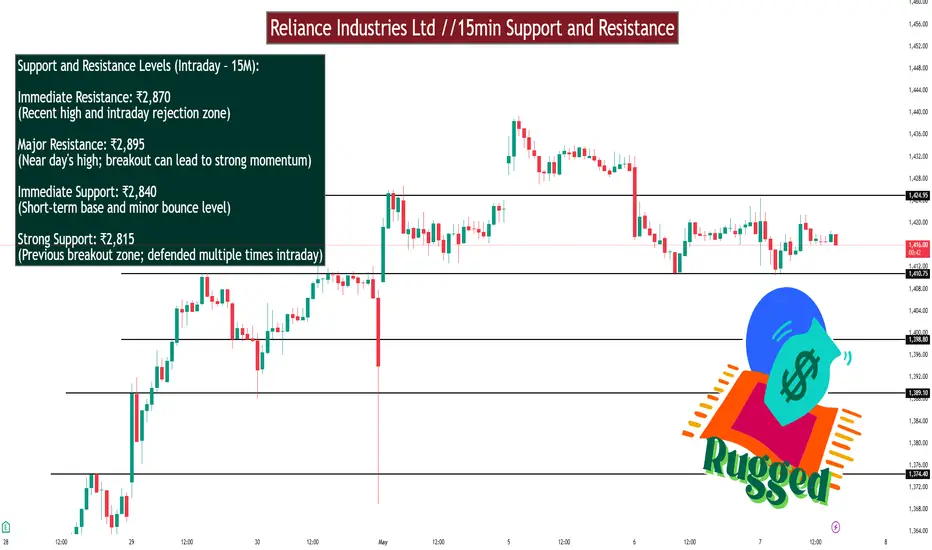
Reliance Industries Ltd //15min Support and ResistanceRELIANCE INDUSTRIES LTD – 15-Minute Chart Support & Resistance
Support and Resistance Levels (Intraday – 15M):
Immediate Resistance: ₹2,870
(Recent high and intraday rejection zone)
Major Resistance: ₹2,895
(Near day's high; breakout can lead to strong momentum)
Immediate Support: ₹2,840
(Short-term base and minor bounce level)
Strong Support: ₹2,815
(Previous breakout zone; defended multiple times intraday)
Trend Insight:
RELIANCE is trading in a rising channel, with buyers stepping in around ₹2,840. Sustained move above ₹2,870 may trigger an upside breakout.
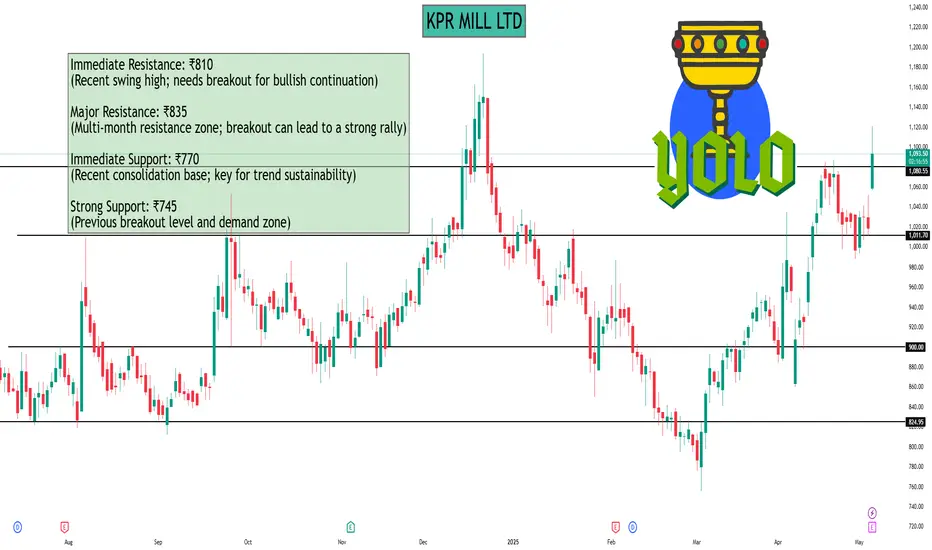
KPR MILL LTD KPR MILL LTD – 1-Day Chart Support & Resistance
Support and Resistance Levels (Daily Timeframe):
Immediate Resistance: ₹810
(Recent swing high; needs breakout for bullish continuation)
Major Resistance: ₹835
(Multi-month resistance zone; breakout can lead to a strong rally)
Immediate Support: ₹770
(Recent consolidation base; key for trend sustainability)
Strong Support: ₹745
(Previous breakout level and demand zone)
Trend Insight:
KPR Mill is in a medium-term uptrend, but facing consolidation near ₹810. A sustained close above ₹810 may trigger momentum, while ₹770 acts as a crucial support zone.
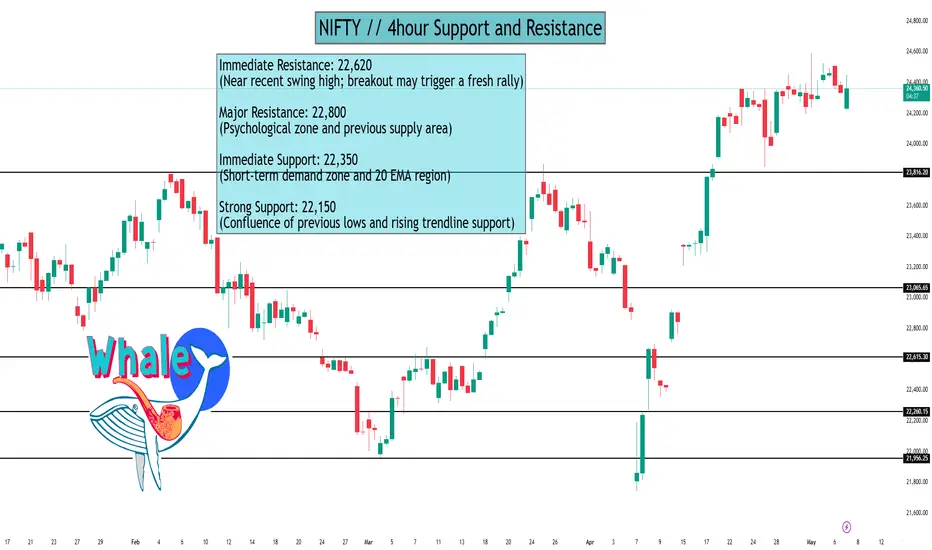
NIFTY // 4hour Support and Resistance Index Name: NIFTY 50
Exchange: NSE | Benchmark index of the Indian equity market
Constituents: 50 large-cap companies across 13 sectors
🧾 Overview:
The NIFTY 50 represents India’s top-performing blue-chip companies and acts as a barometer of the overall market health. It covers sectors like financials, IT, FMCG, energy, and auto.
💼 Key Sector Weights:
Financial Services – ~35%
IT – ~13%
Oil & Gas – ~12%
Consumer Goods – ~9%
Auto – ~6%
📊 Current Trend Insight (as of 4H chart):
Index near resistance at 22,620
Holding support at 22,350 indicates buying strength
Sustained breakout above 22,620 could lead to a move toward 22,800+
NIFTY 50 Index – 4-Hour Chart Support & Resistance
Support and Resistance Levels (4H Timeframe):
c
Trend Insight:
NIFTY is forming higher lows, indicating bullish strength. Consolidation above 22,350 strengthens the case for a breakout. Watch 22,620 for momentum entry confirmation.
Technical TradingTechnical trading is a broader style that is not necessarily limited to trading. Generally, a technician uses historical patterns of trading data to predict what might happen to stocks in the future. This is the same method practiced by economists and meteorologists: looking to the past for insight into the future.

Option and Database TradingOptions data providers collect specific data points that can later be used to determine price movements over time. These price changes in the stock market help investors and brokers decide which stocks might be ideal to sell or buy given current market conditions.

RSI DivergenceRSI: Divergence appears when the RSI's highs or lows diverge from price. For example, if the price makes new lows but the RSI bottoms at higher levels, it signals bullish divergence; if the price makes new highs but the RSI peaks at lower levels, it signals bearish divergence.

DivergenceIn the stock market, divergence refers to a situation where the price of an asset moves in the opposite direction of a technical indicator, like an oscillator or another indicator. This discrepancy can signal a potential trend reversal or weakening momentum.

MACD (Moving Average Convergence/Divergence )The Moving Average Convergence/Divergence (MACD) is a technical analysis indicator used to analyze price trends and momentum. It's calculated by subtracting a longer-term exponential moving average (EMA) from a shorter-term EMA. The resulting MACD line, along with a signal line (an EMA of the MACD line) and a histogram (the difference between the MACD and signal lines), helps traders identify potential buy and sell signals, as well as changes in the strength and direction of a trend.

Option TradingOptions trading may seem overwhelming at first, but it’s easy to understand if you know a few key points. Investor portfolios are usually constructed with several asset classes. These may be stocks, bonds, exchange-traded funds (ETFs), and mutual funds. Options are another asset class, and when used correctly, they offer many advantages that trading stocks and ETFs alone cannot.

Financial Markets A financial market is a market in which people trade financial securities and derivatives at low transaction costs. Some of the securities include stocks and bonds, raw materials and precious metals, which are known in the financial markets as commodities.

Institution Trading prt 5Institutional trading refers to the buying and selling of financial assets by large organizations, like financial institutions, on behalf of their clients or members. These institutions manage large pools of capital and can significantly impact market prices and trends due to their size and trading volume. Unlike retail traders, institutional traders often have access to a wider range of investment opportunities and strategies.

Candlesticks Pattern part 1Candlestick patterns are visual representations of price movements within a specific timeframe, used in technical analysis to identify potential future price movements. Each candlestick represents a period's opening, high, low, and closing prices, and their combinations form patterns that can signal trend changes or potential continuations.

Option Trading AnalysisRelative Strength Index (RSI) The relative strength index (RSI) is one of the most commonly used indicators. ...
Bollinger Bands. ...
Intraday Momentum Index (IMI) ...
Money Flow Index (MFI) ...
Put-Call Ratio (PCR) Indicator. ...
Open Interest (OI)

Institution Trading part 4Institutional trading consists of the purchase and sale of financial assets by institutions through their traders. This definition of institutional trading applies to institutional equity trading, institutional stock trading, institutional options trading - any subcategory.

Institutional TradingInstitutional trade refers to the buying and selling of financial assets by large financial institutions, such as hedge funds, mutual funds, and pension funds. These institutions often manage significant amounts of capital and make trades on behalf of their clients or members. They typically engage in large-scale transactions and require specialized tools and services.

Gold Surges Amid War Tensions Is This the Start of a New Bull 🟡 Gold Surges Amid War Tensions – Is This the Start of a New Bull Run?
📈 XAU/USD Weekly Outlook – May 6, 2025
Gold made a strong comeback this morning, jumping over 600 PIPS as investor demand surged in response to escalating geopolitical risks and massive physical demand in Asia — particularly from China and Japan. The current breakout momentum suggests a high probability of new ATHs if macro and political tensions continue.
🔥 Why is Gold Rising Again?
1️⃣ Geopolitical Flashpoint:
19+ Ukrainian UAVs struck Moscow overnight.
The attack came just ahead of Russia's Victory Day (May 9) — a symbolic blow that rattled global markets.
2️⃣ China Ramping Up Gold Imports:
Reports show China has been quietly stockpiling gold at aggressive levels.
Institutional and retail demand has returned strongly to the Asian bullion market.
3️⃣ Fear and FOMO in the Market:
Asian investors are driving early-session buying frenzies.
Technical retracements are being ignored as price accelerates without respecting classic resistance zones.
📊 Technical Outlook – H4 + D1 Focus
Gold has successfully defended the 3312 zone and surged past resistance zones with ease. Current MA13/MA34/MA89 crossovers on higher timeframes confirm a trend reversal and sustained bullish momentum.
🔑 Key Technical Zones to Watch:
🔻 Support Levels:
3355
3335
3313
🔺 Resistance Levels:
3380
3405
3443
3470
🎯 Trade Plan for May 6 – BUY Bias Dominant
🚫 Avoid SELL positions unless confirmed exhaustion appears — momentum is extremely bullish and politically driven.
🔵 BUY ZONE #1:
Entry: 3314 – 3312
SL: 3308
TP: 3318 → 3322 → 3326 → 3330 → 3340 → 3350 → ???
🔵 BUY ZONE #2:
Entry: 3335 – 3332
SL: 3329
TP: 3340 → 3344 → 3348 → 3352 → 3356 → 3360
🔴 SELL ZONE (High Risk):
Entry: 3343 – 3345
SL: 3359
TP: 3339 → 3335 → 3330 → 3326 → 3320
🧭 Final Thoughts
Gold is currently in hyper bullish mode. Key level 3313 is now confirmed as a volume-based support (VPOC + FIBO 0.5) and will likely be the base for the next wave. As global headlines point to uncertainty, investors are shifting capital back into gold, supported by physical buying from China.
💬 Patience and proper entry are key. Avoid early sell traps. Focus on the Asia-led FOMO rallies and align your strategy with safe-haven flows.

Advanced Trading part 2In business, "trade advance" or "trade credit" generally refers to a short-term, interest-free loan provided by a supplier to a business, allowing the buyer to defer payment for goods or services. It's essentially an arrangement where a supplier allows a buyer to purchase goods on credit, with payment due at a later date, typically within 30 to 90 days.

Advanced TradingAdvanced trading strategies usually involve multiple technical indicators and more complicated instruments, such as options and futures.

Meaning of RSI (Relative Strength Index)RSI stands for Relative Strength Index, a technical indicator used in financial markets to measure the momentum of an asset's price. It helps traders identify potential overbought or oversold conditions by analyzing recent price gains and losses.

Learn institution TradingProspective institutional traders are generally expected to possess, at a minimum, a bachelor's degree in finance, economics, business, or accounting. However, a master's degree or specialized certifications can enhance one's prospects even further.

Institution Trading StrategiesThis strategy involves taking advantage of price discrepancies between two or more markets or instruments. For example, an institution may buy a stock on one exchange where it is undervalued and simultaneously sell it on another exchange where it is overvalued, profiting from the difference.

Support and Resistance part 2Support occurs at the point where a downtrend is expected to pause due to a concentration of demand. Resistance occurs at the point where an uptrend is expected to pause due to a concentration of supply. Support and resistance areas can be identified on charts using trendlines and moving averages.
