UNOMINDA – Daily Timeframe Breakout Idea (Resistance Zone Break)UNO MINDA LTD. has shown a breakout above a key horizontal resistance level on the daily chart, accompanied by a nearly 1.5 times volume surge near the breakout, as seen earlier, supported by strong momentum.
🔍 Breakout Context:
- Price might break above the ~₹1110 horizontal resistance, which had held for over 6 months.
- Breakout supported by more than average volume and just above average range near the resistance zone.
- The price is also trading above both the 50- and 100-day SMAs, indicating strong trend continuation.
- This aligns with a bullish continuation setup.
📉 Trade Plan:
- CMP: ₹1093
- Entry: Near ₹1112
- Target: ₹1188 (~7% upside from CMP)
- Stop-Loss: ₹1082
- Risk-Reward Ratio: ~1 : 2.0
📌 Note:
- Look for a confirmation candle to enter the trade.
- Avoid chasing the extended move unless confident in intraday momentum.
⚠️ Disclaimer: This post is for educational purposes only and not financial advice. Always do your research or consult a financial advisor before trading.
Technicalalysis
impulse wave in HINDUSTAN PETRO. Alternative wave.Elliott Wave Analysis:-
Both correction and impulse wave we are expecting a correction.
once correction get ended an impulse take place.
View 1:-
There is also expected an impulse wave i) completed and a correction wave ii) was almost over if raise start then impulse wave iii) is expected to move on.
View2:-
Correction wave was still pending and a low was expected.
once the low was completed then the impulse wave of v wave was expected .
I'm not a SEBI registered advisor.
Kindly consult your financial advisor.
Correction in hindustan Petro.Elliott Wave Analysis.
Both correction and impulse wave we are expecting a correction.
once correction get ended, an impulse wave will enlight the move.
View 2:-
There is also expected an impulse wave i) completed and a correction wave ii) was almost over if raise start then impulse wave iii) is expected to move on.
I'm not a SEBI registered advisor.
Kindly consult your financial advisor.
a correction in impulse / correction in #KARNATAKA BANK. #SBINElliott Wave Analysis
1) Impulse Wave:-
there is a chance of 3rd major wave ending and the 4th impulse wave is taking place.
after a fall we can accumulate.
2). Corrective Wave:- (complex correction)
A correction wave had completed and now the connecting wave X is forming may be the next wave can be a formation of Y or a complex correction.
The Karnataka bank give the similar pattern like SBIN.
Classic Double Top!Let's Start by admitting the fact that price action works like crisp in FOREX.
A beautiful breakout at $1.36459 made GBPUSD hit $1.37437 - $1.37493 Levels. Which happened to be a small time resistance level.
(During October 2021)
Price then reacted to the resistance and set up its camp down at $1.37007 Levels.
Selling pressure was still intact when it tried crossing $1.37437 - $1.37493 Levels again - 1st Indication for a possible Double top.
I.e, $1.37007 Levels Could possibly be the Neck Line.
Hah! That's what happened!
Price Almost respected our resistance level, and started its jouney downwards. - 2nd Indication for a Double Top.
EMA 9 Going below EMA 21 + RSI breaking its 47 levels Made themselves in the play for going short.
Candle at 7:30 with its good selling pressure and closing below the neckline confirmed the death of $1.37007 levels - THE FINAL INDICATION.
And the trade went on it's journey downwards as predicted.
Current scenario on NZDCADPrice action at its finest shape and form and previous data giving extra confidence
After an Impulse move to upside and breaking a 4H zone ,the price is currently moving in a extended descending channel or bullish correction before moving more to the upside. While analysing previous weeks price movement we can see a very similar extended bearish correction at the same area before movement to the downside by breaking an ascending channel
I tried my best to the represent the movement with path tool ,hoping it will be usesful for someone
A
DEEPAK NITRITE : Cup & handle After the formation of cup & handle , stock has given breakout & formed a nice support near 1600 level before giving today's big move as a breakout. Keeping SL of 1650 one should buy this stock on current level & add on dips (if any) and look for the measured target area of 1950 zone in coming sessions.
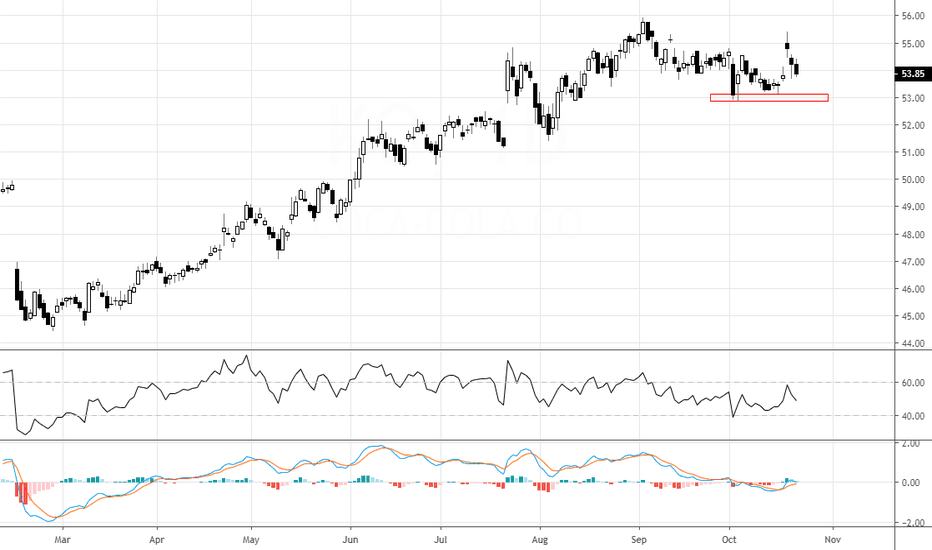
Coca Cola may get bitter here!The stock is in a dominant trend up. Recently a lower high and lower low price pattern has been noticed on the daily charts. The RSI also seems to have shifted the range from bullish 80-40 zones to neutral 60-40 zones in the past few weeks. Important support levels are marked on the charts. Breaking them may result into corrections. The degree of the corrections are still not predictable, but the RSI forewarns. To get more insights into RSI visit www.prorsi.com
Go Long on Indiabulls Housing Finance above 880Indiabulls Housing Finance is running on a range. The stock is taking multiple times resistance over the levels of 880. Anything above the Levels of 880 can be looked upon for long entry.
ILong


