FEDERALBNK - Demand Zone on the Rise📌 Demand Zone
Demand Zone High: 258.80
Demand Zone Low: 253.75
The stock has just broken into a fresh 52-week high with a powerful expansion candle, supported by bullish volume and strong relative strength against the index. Momentum indicators such as RSI, CCI, and Stochastics are all in the overbought zone, signalling a strong trend in motion but also hinting at the possibility of brief pullbacks as price cools off. The demand zone at 258.80–253.75 acts as the key institutional pocket where buyers previously absorbed supply, making it the most reliable retest area if price dips. OBV remains elevated, EMA bands are fully expanded, and the structure continues to show higher highs with controlled corrections, confirming that buyers remain firmly in command. Overall, the setup reflects a clean bullish continuation with a low-risk structure as long as the price holds above the newly formed demand zone.
________________________________________
⚠️ STWP Legal Disclaimer (SEBI-Compliant)
This document is strictly for educational and informational purposes. All examples, charts, levels, and option structures discussed are illustrative and are not intended as buy, sell, or hold recommendations. STWP does not provide investment advice, trading tips, signals, or personalized financial guidance of any kind, nor is it a SEBI-registered intermediary or research analyst. The analyses, illustrations, and risk–reward structures included here are generic in nature and based on publicly available data and observed market behaviour, which may change without notice. Financial markets involve significant risk; derivatives in particular carry the potential for substantial losses. Option premiums, implied volatility, open interest, delta, and other market variables can fluctuate rapidly and unpredictably.
Readers are solely responsible for their trading decisions, capital management, and risk assessment. Before making any investment or trading decision, please consult a SEBI-registered investment advisor. STWP, its representatives, and affiliates shall not be liable for any direct or indirect loss arising from the use of this material. Historical patterns or past market behaviour do not guarantee future outcomes. Nothing in this document should be interpreted as a promise of performance, accuracy, or returns.
Position Status: No active position in FEDERALBNK at the time of analysis.
Data Source: TradingView & NSE India (Past Chart Reference for any charts used).
________________________________________
Technical Analysis

Buy MCX#MCX (Multi Commodity Exchange) Technical Analysis Summary
Current Market Price : ₹8,051.50
Dow Theory Analysis
The chart perfectly demonstrates **Dow Theory principles** in action:
Bullish Structure
Higher Highs : Clear progression from previous peaks
Higher Lows : Each dip maintains above previous lows
Fresh Higher High : Recent peak establishing new uptrend confirmation
Key Technical Levels
Daily Resistance : 8,339.00
Weekly Resistance : 8,901.50
Previous ATH : 9,115.00
Multiple Pattern Confirmations
1. Flag & Pole Pattern : - Bullish continuation pattern Suggests upward momentum continuation
2. Harmonic Pattern :
- Trading near point B
- Activation Level : 8,148.50
- 1st Target : 9,115 (Previous ATH)
- 2nd Target : 9,964 (Current projection)
Do your own analysis before Initiating any Trades.

Cholafin Long - Investment Ideas & AnalysisTechnical Analysis : Cholamandalam Investment and Finance Co. Ltd.
Current Price: 1,610.30
Multi-Timeframe Technical Analysis
Weekly Timeframe Pattern
The stock has formed a **Cup and Handle** pattern on the weekly chart, which is traditionally considered a bullish continuation pattern. This pattern suggests potential accumulation and a possible breakout scenario.
Daily Timeframe Analysis
On the daily chart, a * *Bullish Pennant* * formation has developed, indicating consolidation after a strong upward move. This pattern typically suggests continuation of the prior trend once a breakout occurs.
Key Technical Levels
Fibonacci Retracement Levels:
- 0 Level: ₹1,491.20
- 0.5 Level: ₹1,567.70 (approximate support zone)
- 0.618 Level: ₹1,595.45 (golden ratio support)
- 1 Level: ₹1,644.20
- 1.272 Level: ₹1,685.80
- 1.414 Level: ₹1,707.55
Current Price Action:
The stock is trading near ₹1,610.30, positioned between the 0.618 and 1.0 Fibonacci levels, suggesting a mid-range consolidation zone.
Upside Targets
If the bullish patterns play out and the stock breaks above recent resistance:
- **Primary Target:** Based on the Fibonacci extension, the measured move suggests potential toward ₹1,685-₹1,708 range
- **Pattern Target:** The Cup and Handle height projection aligns with Fibonacci extension levels
Support Analysis
- **Immediate Support:** ₹1,595-₹1,600 zone (0.618 Fibonacci level)
- **Strong Support:** ₹1,567 region (0.5 Fibonacci level)
- **Major Support:** ₹1,491 (pattern base/0 level)
With Nifty made a Bounce back and if the rally continues, adds advantage for the stock to break previous resistance." This highlights the **correlation with broader market sentiment** (Nifty index), suggesting the stock's performance may be influenced by overall market conditions.
Swing Trading Perspective
For short-term traders, the Cup and Handle height provides a **measured move target**. However, confirmation of breakout above resistance with volume would be essential before entry.
**Disclaimer:** This is a technical analysis based on chart patterns and historical price action. This is not financial advice. Traders should conduct their own research, consider risk management strategies, and consult with financial advisors before making trading decisions. Past performance does not guarantee future results.

Canarabank - Short Term BuySImple Technical Analysis.
Multiple PSU stocks are forming Flag&Pole pattern.
Canarabank - Hovering around Prev ATH.
Pattern BO will lead to 139.
Prev High Breakout will lead the Stock to 139/143/152/169.
Target Levels Based on Pattern target and Fibonocci Levels

How to approach any Trade like a PROI make educational content videos for swing / positional trading
Charts used in this video are 3 months older for experience sharing using Bar replay feature of Trading view .

Always check the Higher Time frame but WHY ?I make educational content videos and Posts for Swing Trading based ideas - concepts and my full time trading experience .

GRANULESGRANULES - The stock is currently consolidating after giving a breakout from a 7-month range.
The overall market structure remains bullish, and the EMAs are well-aligned, showing underlying strength.
A decisive breakout above the current consolidation zone could trigger a fresh upside move.
Key resistance levels: 597 and 625.
Keep it on your watchlist for paper trading.
✅ If you like my analysis, please follow me here as a token of appreciation :)
in.tradingview.com/u/SatpalS/
📌 For learning and educational purposes only, not a recommendation. Please consult your financial advisor before investing.

#NIFTY Intraday Support and Resistance Levels - 25/11/2025Nifty is expected to open flat today, indicating a neutral start with no clear directional bias in the early session. If the index sustains above the 26050–26100 zone, it will activate the long setup with upside targets of 26150, 26200, and 26250+. A decisive move above this range may help Nifty recover back toward the higher resistance levels.
On the downside, weakness will confirm only if Nifty breaks below 25950, which will trigger the short setup with targets at 25850, 25800, and 25750-. Since the market is opening flat, initial movement may stay within the consolidation zone, and a breakout from these key levels will determine the trend for the day.

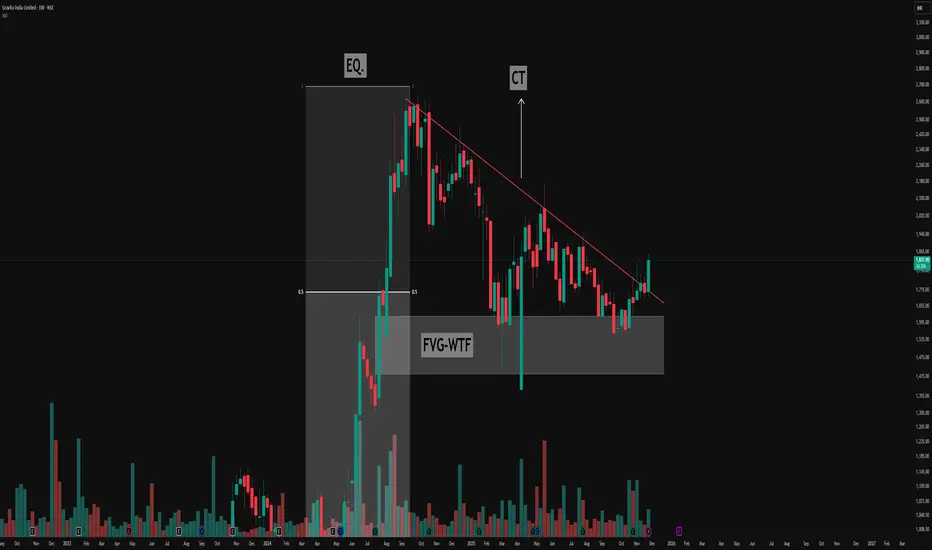
Decoding the Descending Triangle: Key Structure & FVG🔻Understanding the Pattern
- The chart above highlights a classic descending triangle pattern, easily visible by its series of lower highs (marked in red) and a relatively consistent demand zone acting as support.
- This resistance trendline (CT—Contraction Trendline) has been tested multiple times, confirming its significance as sellers consistently respond to price rallies by pushing back from lower levels.
🔻Equilibrium and Price Exploration
- Notice how price action moves from the equilibrium zone (EQ.)—the midpoint of the major move (from lows to all-time highs). This is a key area where supply and demand often rebalance
- The triangle structure forms as buyers continue to find value at support, while sellers become increasingly aggressive at lower highs, compressing price action over time.
🔻Weekly Fair Value Gap (FVG) in Focus
- A prominent Weekly Fair Value Gap (FVG-WTF) is identified, which price has tapped multiple times. This repeated interaction demonstrates its importance as a liquidity pocket where imbalances are re-tested and absorbed.
- Each revisit to this FVG offers a valuable lesson on how strong institutional levels serve as magnets, attracting price to resolve open liquidity.
This post is for educational purposes, highlighting how price structures can be interpreted without suggesting any forecast or trade.
Tata Consumer Products Ltd – Inverted Head & Shoulders Breakout (Long-term Reversal Structure Forming)
Tata Consumer is currently attempting a breakout from a long-term neckline zone around ₹1,170–₹1,200 after forming a large Inverted Head & Shoulders pattern on the weekly timeframe.
The right shoulder has built a strong base above the 20W & 50W EMA, confirming renewed demand. Volume has gradually increased over the past weeks during the breakout attempt — a bullish sign.
A strong weekly close above ₹1,200 could activate the full pattern and open space toward the ₹1,400+ target zone.
🎯 Key Technical Levels
CMP: ₹1,183.10 (+0.78%)
Neckline (Breakout Zone): ₹1,170 – ₹1,200
Pattern Target: ₹1,390 – ₹1,420
Support Zone: ₹1,095 – ₹1,115
Stop-Loss: Below ₹1,090 (weekly close basis)
📈 Technical View
Large Inverted Head & Shoulders visible over a multi-month structure.
Right shoulder built cleanly above EMAs → uptrend strength.
Volume rise during recent candles suggests accumulation by big hands.
A breakout + weekly close above ₹1,200 would indicate strong continuation toward the target zone.
🧠 View
Tata Consumer is approaching a decisive weekly breakout. A sustained close above ₹1,200 could trigger the completion of the Inverted H&S pattern and invite a move toward ₹1,400+. Retests toward ₹1,150–₹1,170 may offer accumulation opportunities.

#NIFTY Intraday Support and Resistance Levels - 24/11/2025Nifty is expected to open with a gap-up today, indicating early strength after the recent decline and signalling that buyers may attempt a recovery from lower levels. If the index sustains above the 26050–26100 zone, the long setup becomes active with upside targets of 26150, 26200, and 26250+. A breakout above the major resistance at 26250 can further extend the bullish momentum toward 26350, 26400, and 26450+.
On the downside, any weakness or reversal will be confirmed only if the index rejects the 26250–26200 zone, activating the reversal short setup toward 26150, 26100, and 26050-. An additional short opportunity emerges only if Nifty breaks below 25950, which opens targets of 25850, 25800, and 25750-. With a gap-up opening, early price action around the key zones will determine whether the market continues upward or faces resistance-driven pullback.

[INTRADAY] #BANKNIFTY PE & CE Levels(24/11/2025)Bank Nifty is expected to open with a gap-up today, indicating early buying interest and a positive sentiment shift after the recent decline. If the index sustains above the 59050–59100 zone, it will activate the buying setup with upside targets of 59250, 59350, and 59450+. A further breakout above 59550 may extend the bullish momentum toward 59750, 59850, and 59950+.
On the downside, weakness will be confirmed only if Bank Nifty slips below 58950, where the selling entry becomes active with targets at 58750, 58650, and 58550-. With a gap-up opening, buyers are likely to dominate initially, but momentum above key levels will decide the continuation of the trend for the rest of the session.

How to Read Candlestick Patterns like a PRO - Price action I make educational content videos for swing / positional trading - breaking down price action movements into simpler steps to make you guys understand the concepts .
Charts used are 3 months or older .

Gold XAUUSD – Fresh Resistance Tested Twice, Bears Eye 4057 PullGold gave us a clean reaction today, rejecting the 4107–4110 supply zone not once, but twice. That double tap reinforced a fresh resistance band at 4087–4095, where sellers stepped back in with intention.
As long as 4012 holds on the upside, this resistance zone remains my short-term line in the sand. Any push back into 4087–4095 may attract renewed selling pressure, keeping the door open for a move toward 4057, with momentum potentially extending lower if sellers stay in control.
I’ll be watching how price behaves on each revisit—structure remains king.
Your feedback drives our content and keeps everyone trading smarter. Let’s make those pips together! 🚀
Happy Trading,
– The InvestPro Team

BNB/USDT – Bullish Reversal Idea | Demand Zone Reaction📌 Overview
BNB is currently trading at a major higher-timeframe demand zone, showing early signs of accumulation after a sharp sell-off. Price has tapped the demand area multiple times and is holding without breaking structure to the downside.
This setup is based on a potential short-term reversal or a relief bounce.
📍 Analysis
🔹 Demand Zone
Price is reacting from a clean demand zone created by previous strong bullish displacement.
Multiple wicks show buyers defending this level.
🔹 Market Structure
Prior strong downtrend
Price now consolidating at support
Lower timeframe shows slowing bearish momentum
🔹 Entry Logic
A long entry is placed at the reaction zone, anticipating a bounce toward the nearest inefficiency / supply zone above.
🎯 Trade Setup
🟩 Long Position Idea
Entry: At demand zone
Stop-Loss: Below the liquidity wick / zone low
Take-Profit: Previous structure high or the first major supply zone above
This gives a clean R:R setup (as shown in chart).
⚠️ Risk Management
Only risk what you can afford to lose
If the zone breaks cleanly, setup is invalid
Wait for candle confirmation if you want safer entry
📌 Final Thoughts
BNB is at a critical make-or-break level. If buyers hold this zone, a strong bounce is likely. If not, expect continuation lower.
Publishing this to track market reaction and trade execution.

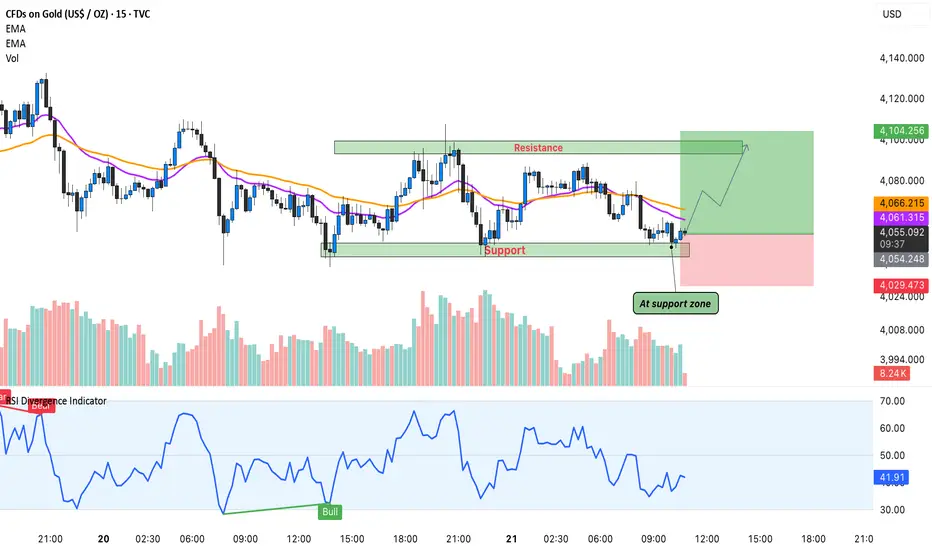
Gold’s Intraday Reversal – Buyers Stepping In!Hello Guy's Let's analyse Gold and it is once again respected the intraday support zone highlighted on the chart. This level has acted as a strong demand area multiple times, and today price reacted from the same zone with clear bullish intent.
Price is also sitting above EMA 20 & EMA 50, and the RSI bullish divergence confirms that momentum could be shifting back toward the upside.
If buyers hold this support, we can see a short-term push toward the 4,090–4,105 resistance region. A clean breakout above that may open more upside, but for now the focus remains on this bounce setup.
This is not breakout trading, this is simply reacting to a level where buyers have shown strength many times.
As long as this support holds, the risk-reward favors the bullish side.
Analysis By @TraderRahulPal | More analysis & educational content on my profile.
[INTRADAY] #BANKNIFTY PE & CE Levels(21/11/2025)Bank Nifty is likely to open flat today, indicating a neutral start with no strong directional bias in the early session. A sustained move above the 59050–59100 zone will activate the buying levels, opening targets of 59250, 59350, and 59450+.
If momentum continues and price moves into the higher resistance band at 59550–59600, the next buying opportunity becomes active with upside targets at 59750, 59850, and 59950+.
On the downside, weakness will be confirmed only if the index slips below the 59450–59400 area, triggering a selling entry with targets of 59250, 59150, and 59050-. Since the opening is flat, price action near these key trigger zones will decide the trend. Until then, the market may remain inside the range with mild volatility.

Premier Polyfilm Ltd – Inverted Hammer Reversal at Key SupportStrong Bullish Candle After Multi-Month Downtrend
Premier Polyfilm has printed a bullish Inverted Hammer at a major support zone after a prolonged decline — a classic early reversal signal on the weekly timeframe. The stock has been falling consistently for months, and this week’s sharp +12% bounce shows strong buying interest returning near the demand zone of ₹34–₹36.
Price is now closing above the minor resistance zone (₹40–₹43). If sustained, the stock may attempt a short-term trend reversal.
RSI also shows a bullish uptick from oversold territory, supporting the possibility of a relief rally.
🎯 Key Technical Levels
CMP: ₹43.00 (+12.33%)
Immediate Resistance: ₹49–₹52
Major Resistance Zone: ₹73–₹80
Support Zone: ₹34–₹36
Major Support: ₹30
Swing SL: Close below ₹35 (weekly basis)
📈 Technical View
A clean Inverted Hammer candle formed exactly at support → early reversal signal.
RSI bouncing sharply from oversold (14–20 range).
Price reclaiming the small demand zone around ₹40–₹43.
Trend is still down, but first signs of exhaustion are visible.
Sustaining above ₹43 could lead to a move toward the 20-week EMA and the ₹49–₹52 area.
🧠 View
Premier Polyfilm has shown its first strong bullish candle after several months of selling pressure. The combination of Inverted Hammer + support + RSI reversal makes this an early-stage reversal watch. A weekly close above ₹43 strengthens the case for upside toward ₹49–₹52, and potentially ₹70+ on a medium-term basis.

[INTRADAY] #BANKNIFTY PE & CE Levels(20/11/2025)Bank Nifty will open with a slight gap-up, indicating early strength and positive sentiment carrying forward from the previous session. As long as the index holds above the 59050–59100 zone after the opening, the market is likely to remain bullish, activating the buying range with potential upside targets of 59250, 59350, and 59450+. If the momentum pushes further toward the upper resistance zone near 59550–59600, the next bullish leg may extend toward 59750, 59850, and even 59950+.
However, any weakness will be confirmed only if the price slips below 58950, where a selling trade becomes active with downside targets of 58750, 58650, and 58550-. Overall, the opening bias remains positive, and buyers are expected to dominate as long as key support levels hold strong.

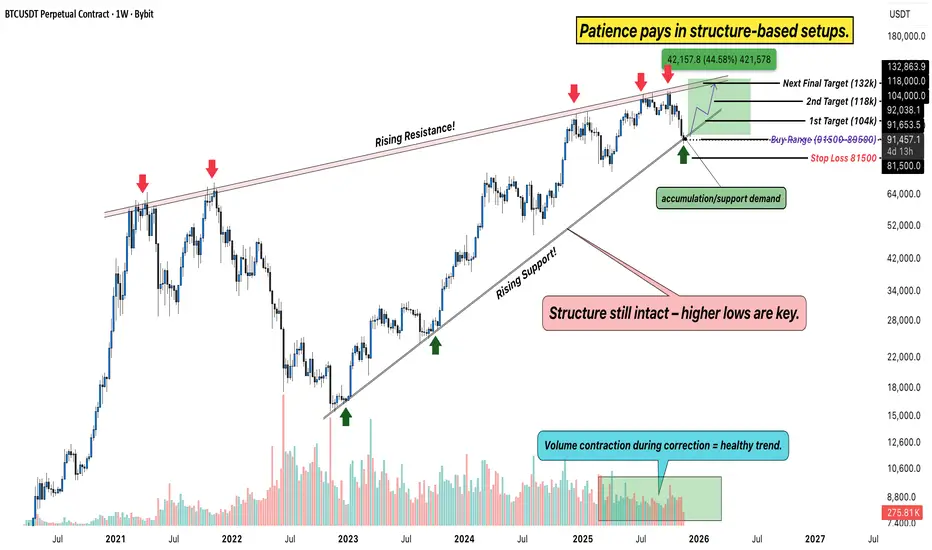
Bitcoin Weekly Chart – Structure Still Intact, Patience is PowerHello Everyone, i hope you all doing good, Lets discuss about bitcoin. After weeks of consolidation and volatility, Bitcoin is back at its rising support zone, where strong hands usually step in. The structure on the weekly chart continues to hold higher lows, a clear sign that the broader trend remains bullish despite short-term pullbacks.
Technical View
Rising Channel: BTC continues to move within a rising channel, with clear reactions from both support and resistance levels. The current price is testing the buy range between 81,600–89,500, an area that has historically acted as a high-probability reversal zone.
Resistance Levels: Key upside levels to watch are 104K, 118K, and the final target zone near 132K, the same rising resistance that rejected price multiple times in past cycles.
Support: As long as BTC stays above 81,500, the structure remains valid. A weekly close below this zone would invalidate the bullish bias.
Volume Behavior: Notice how each correction comes with lower volume, a healthy sign of accumulation, not distribution.
Big Picture
This phase often shakes out emotional traders while rewarding the ones who trust structure and time. If Bitcoin holds this zone and begins to bounce, it could mark the start of the next major wave, potentially aiming for a new cycle high in the coming months.
Rahul’s Insight: Big moves don’t start with hype, they start with quiet structure and strong conviction. The crowd reacts; the disciplined trader prepares.
Analysis By @TraderRahulPal | More analysis & educational content on my profile.
Gold 30-Min Chart: Sellers Active Near Resistance!Gold is once again testing its falling resistance trendline, which has already rejected the price several times in recent sessions. Each time the price touches this trendline, selling pressure increases, showing how strong this resistance zone is.
Currently, the price is near $4070–$4080, where short-term traders should stay alert. If the price fails to break above this resistance, a pullback toward the $4000–$3980 support zone looks likely. This area has previously acted as a strong demand zone, where buyers may re-enter.
However, if Gold breaks and sustains above this trendline resistance, we could see a fresh upside momentum building up toward $4115–$4135 levels. For now, the structure looks weak near resistance, and traders should wait for a clear breakout or rejection confirmation before taking any position.
Disclaimer: This analysis is for educational purposes only and should not be taken as financial advice. Please do your own research or consult your financial advisor before investing.
Analysis By @TraderRahulPal | More analysis & educational content on my profile.
If you found this helpful, don’t forget to like and follow for regular updates.

XAUUSD | Bulls Hold Control Above 4070 - Eyes on 4090–4100 ZoneGold (XAUUSD) continues to show strong bullish structure, and price action above the 4070 key support reinforces buyers’ dominance.
If price sustains above this level, the next upside liquidity area sits at 4090–4100 , a zone where previous reactions have occurred.
Bullish Scenario:
Holding above 4070 keeps momentum pointed toward 4082 and then the 4090 zone.
The bullish outlook remains valid as long as price stays above 4059, which currently acts as intraday invalidation.
What I’m Watching:
A clean intraday consolidation above 4070
Momentum strength into 4082
Whether buyers can break into the 4090–4100 resistance pocket
This setup highlights how the market could behave, not financial advice—just educational analysis.
📌 Disclaimer:
This analysis is for educational purposes only and is not financial advice. Always manage risk and follow your trading plan.
Your feedback drives our content and keeps everyone trading smarter. Let’s make those pips together! 🚀
Happy Trading,
– The InvestPro Team

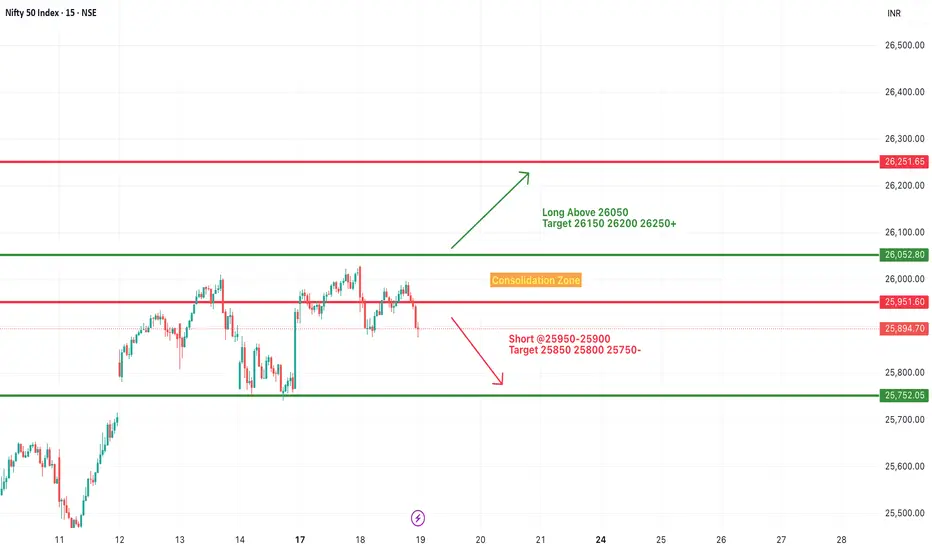
#NIFTY Intraday Support and Resistance Levels - 19/11/2025Nifty is expected to open flat near the 26000 level, keeping price action inside the same tight range as yesterday. The index is currently trading near an important resistance cluster, so early candles may remain choppy and sideways until a clear directional move develops.
If Nifty sustains above 26,050, upside strength can continue toward 26,150, 26,200, and 26,250+. A breakout above 26,050 will act as the primary confirmation for long positions, indicating fresh buyer momentum.
On the downside, if the index slips below 25,950–25,900, a short setup may get activated toward 25,850, 25,800, and 25,750-. This zone has acted as support earlier, so a breakdown may lead to a quick intraday slide.
Overall, with a flat opening and no gap advantage for either side, Nifty remains in a reaction zone. Traders should wait for a decisive move above 26,050 or below 25,950 to catch a clean trend. Use strict SL as volatility may rise around resistance levels.