#NIFTY Intraday Support and Resistance Levels - 06/11/2025Nifty is expected to open with a gap up near the 25,750 zone, showing early signs of recovery after a recent decline. The opening above the immediate resistance area indicates potential buying interest, but sustained momentum will be key to confirming a reversal.
If Nifty holds above 25,750–25,780, it may extend its move toward 25,850, 25,900, and 25,950+. A breakout above 25,950 could trigger further upside toward 26,000–26,050, strengthening the short-term bullish bias.
On the downside, initial support lies near 25,700–25,650. A failure to sustain above this zone could lead to renewed selling pressure toward 25,600, 25,550, and 25,500, which remains a crucial support level for the day.
Overall, with a gap up opening near 25,750, sentiment is expected to remain mildly positive as long as the index sustains above 25,700. Traders should monitor price action near the 25,900 zone for potential resistance and use a trailing stop loss to protect profits in case of volatility.
Technical Analysis

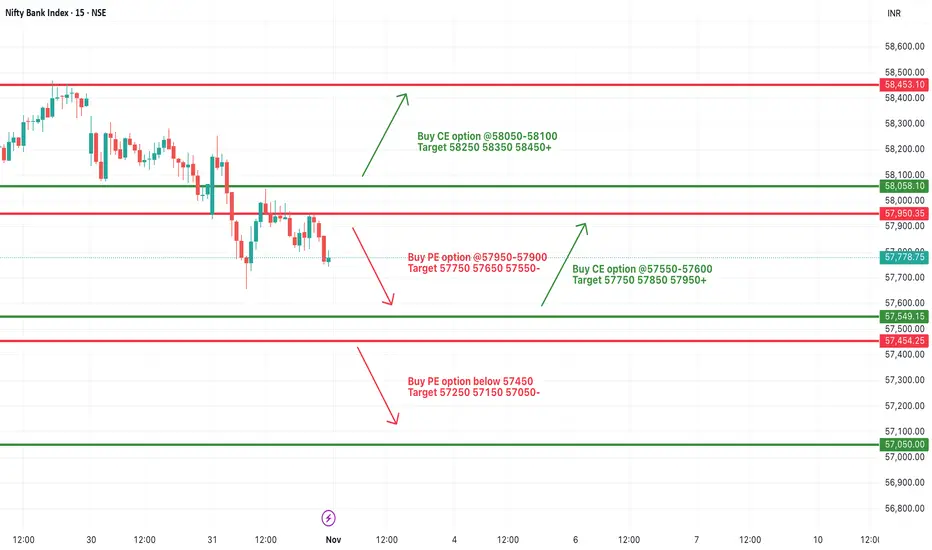
[INTRADAY] #BANKNIFTY PE & CE Levels(06/11/2025)Bank Nifty is expected to open slightly gap up near the 57,850–57,900 zone, indicating mild positive sentiment after a period of consolidation. The index has been trading in a tight range for the past few sessions, and a decisive breakout is likely to set the next short-term trend.
If Bank Nifty sustains above 57,900–58,000, it may attempt a move toward 58,100, 58,250, and 58,350+ levels. A breakout above 58,450 will further strengthen bullish momentum, opening the path toward 58,600–58,750.
On the downside, immediate support is placed at 57,750–57,700. A fall below this zone could invite selling pressure, dragging the index toward 57,550, 57,450, and 57,250, while a further decline below 57,050 may extend the weakness.
Overall, with a slightly gap up opening, the index is expected to stay range-bound between 57,700–58,200 during the early session. Traders should focus on breakout confirmation above 58,000 or breakdown below 57,700 for clear intraday direction, while maintaining strict stop losses due to potential intraday volatility.

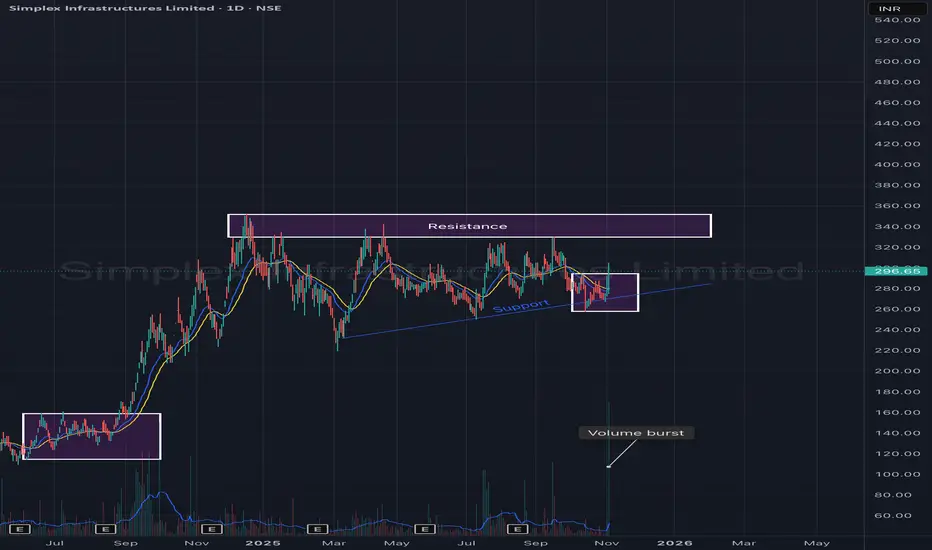
Simplex Infrastructures Ltd – Ascending Triangle Formation with Simplex Infrastructures is showing signs of accumulation and trend continuation within an ascending triangle pattern on the daily chart. The stock has been consistently forming higher lows while facing resistance around the ₹330–₹340 zone.
A recent volume burst near the support trendline indicates strong buying interest from lower levels — hinting at a potential breakout attempt in the coming sessions.
🎯 Key Levels:
CMP: ₹296.65 (+3.20%)
Support Trendline: ₹270 – ₹280
Resistance Zone: ₹330 – ₹340
Breakout Target: ₹370 – ₹390
Stop-Loss: ₹270 (on daily close basis)
📊 Technical View:
Formation of a higher-low structure within an ascending triangle.
Strong volume activity around support confirms accumulation.
Short-term EMAs are flattening, awaiting breakout confirmation.
A close above ₹340 with volume could trigger the next up leg toward ₹380+.
🧠 View:
Simplex Infra is building strength within a bullish ascending triangle pattern. A decisive move above ₹340 may confirm breakout momentum, supported by the recent volume surge, while the rising trendline continues to act as a strong base.
BRITANNIA - Falling Wedge + Bullish Engulfing Combo💹 Britannia Industries Ltd (NSE: BRITANNIA)
Sector: FMCG | CMP: ₹5,892.50 | View: Falling Wedge + Bullish Engulfing Reversal Setup
📊 Price Action:
Britannia is currently displaying a strong confluence setup where both a chart pattern and a candlestick pattern align perfectly to signal a potential trend reversal.
After weeks of consolidation within a downward-sloping structure, the stock has formed a Falling Wedge pattern — a classic bullish reversal formation.
Adding strength to this structure, a Bullish Engulfing Candle on 4 Nov 2025 emerged from the wedge’s lower boundary, confirming buyer dominance and hinting at a near-term trend reversal.
📉 Chart Pattern Analysis – Falling Wedge (Bullish Setup):
The Falling Wedge pattern is marked by two converging downward trendlines, each connecting a series of lower highs and lower lows.
This structure reflects seller exhaustion and early buying interest.
Britannia’s wedge formation is now reaching its apex, where breakout probability is highest.
Volume contraction throughout the wedge also supports the notion that supply is drying up, preparing for a breakout above the upper trendline.
📈 Candlestick Pattern – Bullish Engulfing Confirmation:
The Bullish Engulfing Candle formed on 4 Nov 2025 precisely at the lower support line of the wedge, validating the pattern with strong timing. It represents a shift in control from sellers to buyers, with the green candle completely engulfing the prior red body. Volume expansion on that session further confirmed active participation by institutions ahead of the upcoming news catalysts. This one-day reversal candle acts as the first technical confirmation, while a breakout above the upper trendline will serve as the structural confirmation for the wedge pattern.
📏 Fibonacci Analysis:
From swing low ₹5,298 to swing high ₹5,930:
78.6% retracement @ ₹5,795 → Key reversal level defended.
61.8% retracement @ ₹5,888 → Currently reclaimed zone.
100% extension @ ₹5,930 → Short-term breakout threshold.
The Fibonacci structure aligns beautifully with the wedge’s geometry, implying that the reversal zone is complete and buyers are regaining momentum.
🧭 STWP Support & Resistance:
Resistances: ₹5,940 | ₹5,987 | ₹6,055
Supports: ₹5,825 | ₹5,775 | ₹5,710
The ₹5,775–₹5,825 range is acting as a high-confidence accumulation base, while ₹6,090–₹6,150 represents the key breakout trigger zone.
📊 STWP Volume & Technical Setup:
Volume on 4 Nov surged to 363.4K vs 248.7K average, confirming institutional interest at lower levels. VWAP recovery and improving RSI (47→52+) show that momentum is gradually returning.
MACD is approaching a bullish crossover, while Stochastic and CCI have both turned upward — all aligning with a reversal confirmation setup.
Trend Direction: UPTREND (Transitioning) | Volume Confirmation: Possible Accumulation in Progress
🧩 STWP Summary View:
Final Outlook:
Momentum: Strengthening | Pattern: Falling Wedge + Bullish Engulfing | Risk: Moderate | Volume: Increasing
Britannia’s technical structure now showcases dual confirmation — a chart pattern (Falling Wedge) supported by a candlestick reversal (Bullish Engulfing).
This confluence enhances the reliability of the reversal signal and increases the probability of an upside breakout. As long as the price holds above ₹5,825, the bias remains bullish with potential continuation toward ₹6,150–₹6,250.
⚠️ Disclosure & Disclaimer – Please Read Carefully
This analysis is for educational purposes only and should not be treated as financial or investment advice.
I am not a SEBI-registered investment adviser. All views are based on technical observations and publicly available information.
Trading involves risk; please assess your financial suitability, position size, and stop-loss levels before entering any trade.
Always consult a SEBI-registered financial adviser for personalized guidance.
Position Status: No active position in (BRITANNIA) at the time of this analysis.
Data Source: TradingView & NSE India
💬 Found this useful?
🔼 Give this post a Boost if you value clean technical confluence studies.
💭 Comment your thoughts — does this wedge-breakout setup look convincing to you?
🔁 Share this post to help others understand pattern + candlestick synergy.
👉 Follow for more institutional-style technical breakdowns built on clarity and patience.
🚀 Stay Calm. Stay Clean. Trade With Patience.
Trade Smart | Learn Zones | Be Self-Reliant 📊

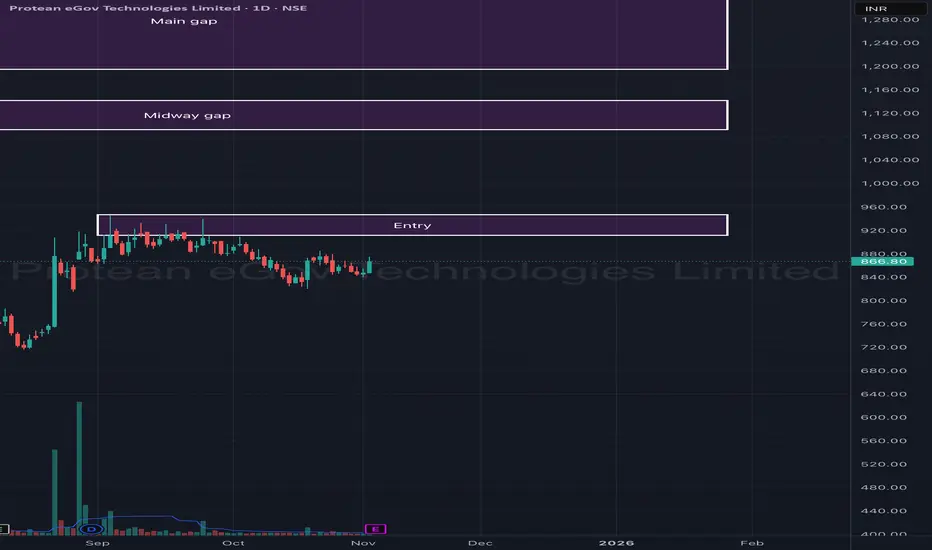
Protean eGov Technologies Ltd – Gap Fill Setup (Daily Chart)Protean eGov Technologies is showing early signs of base formation after a prolonged downtrend. The price is currently consolidating near the ₹850–₹880 zone, forming a potential accumulation structure that could lead to a gap-fill rally in the short to medium term.
The chart highlights two major unfilled gaps — a midway gap and a main gap — both acting as key upside targets once the current range breakout confirms.
🎯 Key Levels:
CMP: ₹866.80 (+2.25%)
Entry Zone: ₹850 – ₹880
Midway Gap Target: ₹1,100 – ₹1,150
Main Gap Target: ₹1,280 – ₹1,350
Stop-Loss: ₹820 (on daily close basis)
📊 Technical View:
Price consolidating after a steep decline — forming a base near support zone.
Volume spikes during accumulation suggest smart buying interest.
Breakout above ₹880–₹900 could trigger a gap-fill move toward ₹1,100+.
Short-term EMAs are flattening, indicating the downtrend might be losing momentum.
🧠 View:
Sustaining above ₹880 could confirm the beginning of a recovery phase. Watch for a breakout with volume to target ₹1,100 first (midway gap), followed by ₹1,300+ (main gap fill).
EUR/JPY Sell Momentum BuildsEUR/JPY has officially transitioned into a sell-side trend following clear exhaustion of its previous bullish cycle. The market structure shows consecutive lower highs and strong downside displacement, confirming that sellers are now in control of short-term momentum.
Recent liquidity sweeps above prior highs were quickly rejected, signaling institutional distribution and profit-taking. Order flow dynamics continue to favor the downside, with bearish impulses showing higher efficiency than any corrective rebounds.
Momentum and sentiment both align with sustained selling pressure. The pair is operating within a redistribution phase, and the market tone remains defensive as participants seek lower value zones.
Overall outlook: Bearish bias remains dominant. The market is expected to extend lower while maintaining controlled volatility until meaningful demand re-enters the market.

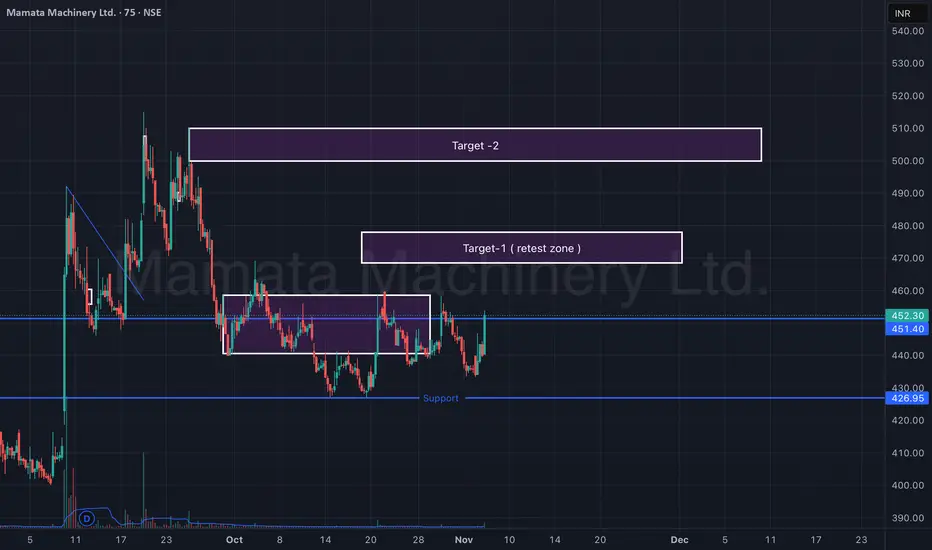
Mamata Machinery Ltd – Support Reversal & Retest Zone (75-min)Mamata Machinery is showing early signs of reversal from a strong support zone around ₹425–₹430. After forming a double-bottom-like structure, the stock has bounced sharply with rising volumes, indicating a possible short-term trend reversal.
Currently, price action is approaching a retest zone (Target-1) near ₹465–₹470. Sustaining above this level can open the path toward the next resistance cluster (Target-2) near ₹505–₹515.
🎯 Key Levels:
CMP: ₹452.30 (+3.81%)
Support Zone: ₹425 – ₹430
Target-1 (Retest Zone): ₹465 – ₹470
Target-2: ₹505 – ₹515
Stop-Loss: ₹425 (on 75-min close basis)
📊 Technical View:
Price rebounded from major support with visible volume spike.
Structure forming higher lows — early indication of momentum shift.
Short-term EMAs turning upward; potential crossover likely soon.
Sustained move above ₹470 can confirm breakout continuation toward ₹510+.
🧠 View:
Mamata Machinery has reversed from key support and is testing its retest zone. A breakout above ₹470 could trigger a short-term rally toward ₹510, while maintaining a stop-loss below ₹425.
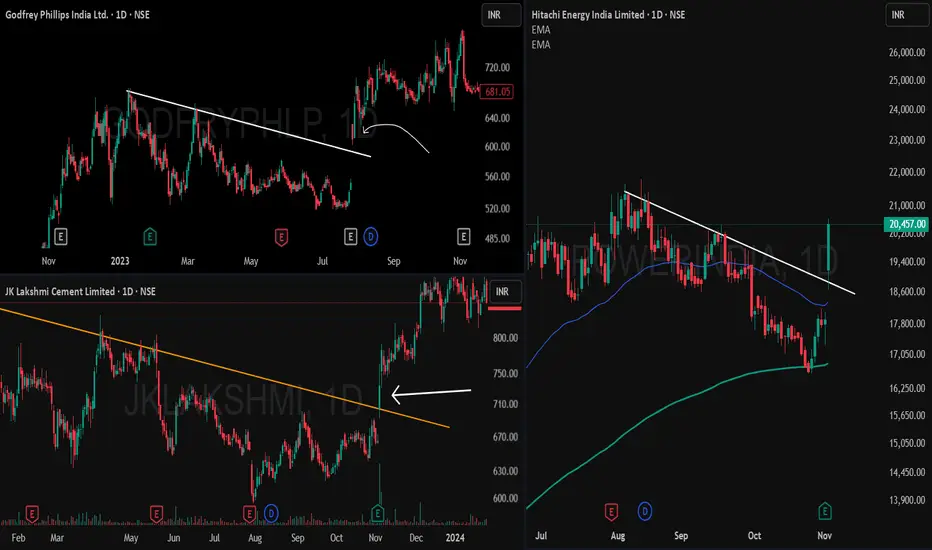
Breakaway Gap Up Breakout — A Powerful StudyThis post analyzes breakaway gap up breakouts with multiple chart examples, illustrating how price leaps above well-tested trendline resistance without a retest, triggering strong upward momentum.
Main Report
What is a Breakaway Gap Up Breakout?
A breakaway gap up breakout occurs when the price gaps above a resistance trendline that has been tested multiple times, but instead of interacting with the resistance, the price opens substantially higher, leaving a noticeable gap. This phenomenon signals strong demand and often marks the beginning of a sustained price rally
Chart Observations
- Left-side examples (Godfrey Phillips & JK Lakshmi Cement):
Both charts show prices repeatedly hitting a descending trendline resistance. Unlike typical breakouts, the price did not touch or retest the resistance before breaking out; instead, it jumped above with a clear gap up. This is the classic signature of a breakaway gap. Following the breakout, continuation moves are observed, confirming the bullish momentum.
- Right-side example (Power Grid Corp):
Here, the price similarly clears a major resistance following several rejection points. The breakout is accompanied by a gap and swift follow-up buying, exemplifying the reliability of the breakaway gap pattern
Key Traits of Breakaway Gap Ups
-Occur after prolonged resistance tests.
-Price gaps above resistance without retesting or shadowing.
-Often lead to strong follow-through and trend continuation.
-Frequently signal institutional participation or a major sentiment shift.
Gold Pauses Below $4,000 as Markets Digest Hawkish Fed Tone🔍 Market Context
Gold struggles to find direction in early Asia, hovering just below the $4,000 psychological level after the Fed’s hawkish remarks dampened bullish momentum.
Chair Jerome Powell reaffirmed that another rate cut this year is “not a given”, keeping yields supported and safe-haven demand balanced.
Meanwhile, ISM Manufacturing PMI fell to 48.7, signalling cooling momentum but not enough to alter the Fed’s cautious stance.
With odds of a December rate cut near 70%, gold remains trapped between policy uncertainty and soft macro sentiment.
📊 Technical Outlook (H1–H4)
Price is consolidating within a tight structure between 3,963$ and 4,024$, showing compression before a potential expansion move.
The 3,984$–3,963$ zone acts as short-term liquidity support, aligning with the rising intraday trendline.
Key Levels
• 💎 Liquidity Support: 3,963$ – 3,984$
• 🎯 Immediate Resistance: 4,024$
• ⚙️ Bullish Target: 4,046$ (liquidity sweep + expansion zone)
• ⚠️ Invalidation: Below 3,923$, bias shifts to neutral
A clean breakout above 4,024$ could trigger a move toward 4,046$, while failure to hold above 3,963$ may invite another liquidity grab before buyers re-enter.
🎯 MMFLOW View
Smart money remains patient.
As long as 3,963$ holds, dips are seen as accumulation rather than weakness.
But conviction only returns when liquidity confirms above 4,024$ — that’s where momentum aligns with intent.
⚜️ MMFLOW Insight:
“Liquidity doesn’t chase price — it creates the path for it.”

#NIFTY Intraday Support and Resistance Levels - 04/11/2025Nifty is expected to open flat near the 25,750–25,780 zone, indicating a neutral start as the market looks for fresh cues after a consolidation phase. The index is currently holding near key support, suggesting that both buyers and sellers are waiting for a breakout from this range to take control.
If Nifty sustains above 25,800, it may trigger a short-covering rally toward 25,850, 25,900, and 25,950+ levels. A move beyond 25,950 could further strengthen momentum toward 26,000–26,050.
On the downside, immediate support lies near 25,700–25,650. A breakdown below 25,700 could lead to weakness toward 25,600, 25,550, and 25,500, where the next major support zone lies.
Overall, with a flat opening, Nifty is likely to remain range-bound between 25,700–25,900 in the early session. Traders should wait for a clear breakout or breakdown before initiating fresh positions and use strict stop losses in this narrow consolidation phase.
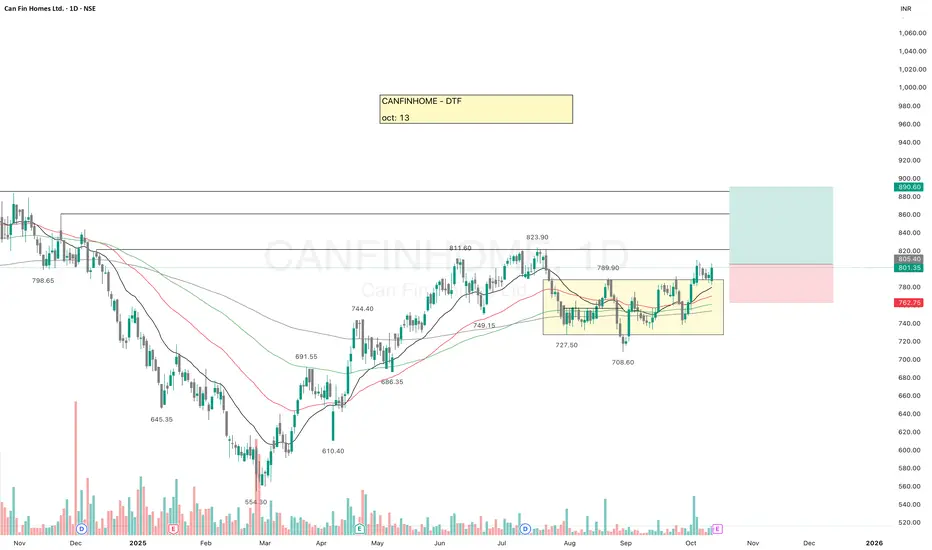
CANFINHOMECANFINHOME has given breakout of the recent resistance.
Looking at a good position, all key EMAs are aligned, if it sustains the move then it may give a good upside move.
There are a couple of resistance points which may become small hurdle in between.
✅ If you like my analysis, please follow me here as a token of appreciation :)
in.tradingview.com/u/SatpalS/
📌 For learning and educational purposes only, not a recommendation. Please consult your financial advisor before investing.
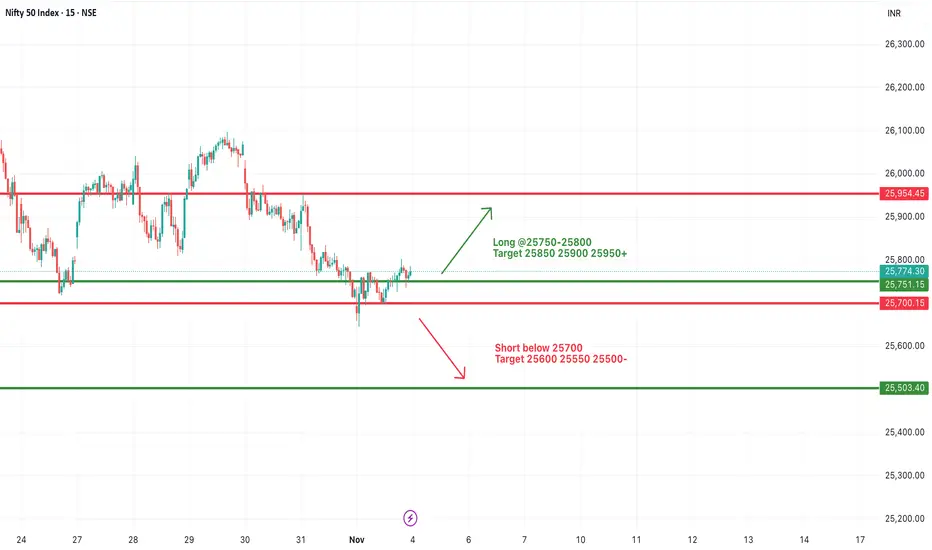
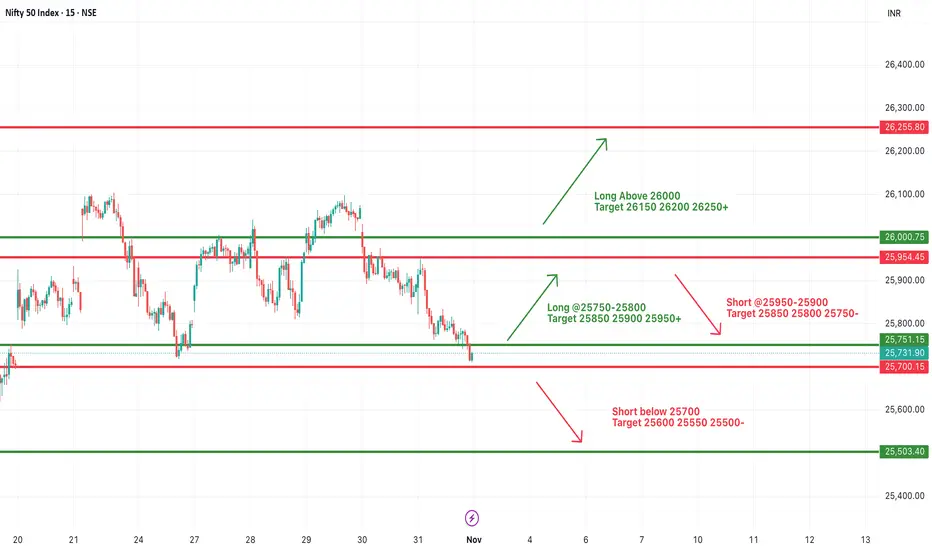
#NIFTY Intraday Support and Resistance Levels - 03/11/2025Nifty is expected to open slightly gap up near the 25,750–25,800 zone, showing a mild recovery attempt after recent selling pressure. However, the index continues to trade near its lower support band, indicating that buyers need to defend this zone to avoid a deeper correction.
If Nifty sustains above 25,800, a short-covering move toward 25,850, 25,900, and 25,950+ levels can be expected. Further strength above 26,000 will open the path toward 26,150–26,250, signaling a reversal from the current downtrend.
On the downside, immediate support lies around 25,700–25,650. A breakdown below 25,700 may lead to extended weakness toward 25,600, 25,550, and 25,500 levels, where fresh buying interest could emerge.
Overall, with a slightly gap up opening, Nifty may witness initial range-bound movement between 25,700–25,900. Traders should stay cautious and focus on price action near the 25,700 and 25,900 zones, as a breakout on either side will likely decide the intraday trend.
[INTRADAY] #BANKNIFTY PE & CE Levels(03/11/2025)Bank Nifty is likely to open flat or with a slight gap up near the 57,750–57,800 zone, reflecting a cautious start to the week as traders await directional clarity. The index is currently oscillating within a narrow range, indicating consolidation before a potential breakout or breakdown.
If Bank Nifty sustains above 57,800–57,850, we may see a short-covering move toward 57,950, 58,050, and 58,350+ levels. A strong breakout above 58,100 could further extend the rally toward 58,450–58,600, signaling bullish momentum.
On the downside, immediate support lies around 57,600–57,550. A fall below 57,550 may invite selling pressure, dragging the index toward 57,450 and 57,250 levels. Sustained trade below 57,250 can extend the decline toward 57,050.
Overall, with a flat to slightly gap up opening, traders should stay alert for a breakout from the 57,550–58,100 range. A disciplined approach with strict stop losses and trailing profits is advised, given the possibility of intraday volatility within this consolidation phase.
Timken India Ltd – Strong Breakout Momentum (Daily Chart)Timken India is showing strong bullish momentum after multiple rejections near ₹3,000 levels. The stock has now given a clean breakout from its short-term resistance zone, supported by rising volumes and bullish candles, indicating renewed buying interest.
The price has reclaimed key moving averages and is now eyeing the next resistance zone near ₹3,500–₹3,520, which acts as the target zone on the chart.
🎯 Key Levels:
CMP: ₹3,144 (+2.89%)
Breakout Zone: ₹3,080 – ₹3,100
Target Zone: ₹3,480 – ₹3,520
Stop-Loss: ₹3,000 (on daily close basis)
📊 Technical View:
Breakout above recent swing highs with volume confirmation.
Price now trading above key EMAs, indicating trend reversal.
Bullish continuation likely if price sustains above ₹3,100.
Volume spike adds strength to the breakout setup.
🧠 View:
The breakout from consolidation backed by volume makes Timken India a strong candidate for short-term momentum trades. Sustaining above ₹3,100 can open room toward ₹3,500+, with a stop-loss below ₹3,000.

HEGDrying volume during the pullback, tight contraction in the stock, EMAs are aligned.
There is probability of an upside move.
✅ If you like my analysis, please follow me as a token of appreciation :)
in.tradingview.com/u/SatpalS/
📌 For learning and educational purposes only, not a recommendation. Please consult your financial advisor before investing.

Emotional Discipline and Risk Control in Trading🧠 1. Why Emotional Discipline Matters
Emotional discipline means sticking to your plan regardless of fear or greed.
Markets are designed to test your patience, confidence, and decision-making. Every losing trade tempts you to change your system — but consistency wins.
✅ Key habits of emotionally disciplined traders:
They accept losses without revenge trading.
They follow rules, not impulses.
They manage expectations — no trade will make them rich overnight.
💰 2. Risk Control — Protect Before You Profit
Your risk management defines your survival. Successful traders think in probabilities, not certainties. They never risk too much on one idea.
📏 Golden Rules of Risk Control:
Risk 1–2% of your capital per trade.
Always use a stop-loss, never a “mental” one.
Define your R:R ratio (minimum 1:2 or better).
Never add to a losing position — only to confirmed winners.
Risk control is not about avoiding losses — it’s about limiting damage and staying consistent over time.
🧩 3. How to Strengthen Emotional Discipline
Like a muscle, discipline grows with routine. Try this daily:
Pre-trade routine – review your plan before every session.
Post-trade journal – log your emotions, not just results.
Take breaks – emotional fatigue leads to poor judgment.
Detach from outcomes – focus on process, not profit.
💡 Tip: When you reduce emotional pressure, your clarity and accuracy both improve.
⚙️ 4. Professional Mindset Shift
Amateurs chase profit; professionals protect capital.
Each trade is just one data point — not a reflection of your worth. Once you start thinking like a risk manager first, your results change naturally.
🗣️ “Discipline is choosing what you want most over what you want now.”
📊 Conclusion
To grow as a trader, focus on controlling yourself before controlling the market.
Emotional stability + strict risk control = long-term success.
Be the trader who executes with logic, not emotion. 🧘♂️

Bullish Momentum Revival Near Key Support | STWP💹 Aurobindo Pharma Ltd (NSE: AUROPHARMA)
Sector: Pharmaceuticals | CMP: ₹1,138.90 | View: Bullish Momentum Setup
📊 Price Action:
Aurobindo Pharma shows strong bullish momentum after reclaiming key support zones near ₹1,100.
The stock has printed a bullish engulfing candle with institutional-grade volume, signaling a potential continuation of the uptrend.
Price action confirms demand absorption at lower levels with buyers defending the ₹1,080–1,100 zone effectively.
💼 HNI Trade Levels (STWP Setup):
Aggressive Entry: ₹1,138.90–₹1,155.80 | Stop Loss: ₹1,087.35
Low-Risk Entry: ₹1,137.12 | Stop Loss: ₹1,080.02
The STWP HNI Setup reflects a well-defined bullish structure supported by EMA 200 crossover and strong candle confirmation.
Smart money activity is visible through expanding volume footprints and VCP contraction signs fading toward breakout.
📉 VCP Analysis:
Aurobindo Pharma has undergone 112 VCP contractions, forming a tight base before breakout attempts.
Although the current candle is yet to confirm a clean VCP breakout, the setup suggests a pre-breakout stage, aligning with institutional interest.
The ongoing contraction phase combined with a bullish RSI breakout supports accumulation by strong hands.
📈 STWP Trading Analysis:
Entry: ₹1,155.80 | Stop Loss: ₹1,098.70 | Risk: ₹57.10
The bullish structure is reinforced by a 5x volume expansion and a strong buyer-dominated candle.
EMA 200 crossover, MACD bullish alignment, and RSI strength above 52 confirm upside bias.
Holding above ₹1,120 keeps the short-term structure firmly bullish toward ₹1,177–₹1,208 levels.
📏 Fibonacci Analysis:
From the swing low of ₹1,016.10 to the recent swing high of ₹1,208.20 — price currently hovers around the 61.8% retracement zone at ₹1,134.82, a critical Fibonacci pivot.
Sustaining above this level indicates strength and supports the ongoing uptrend.
Fibonacci extensions project targets near ₹1,208–₹1,218 on breakout confirmation.
🧭 STWP Support & Resistance:
Resistances: ₹1,163.13 | ₹1,187.37 | ₹1,218.93
Supports: ₹1,107.33 | ₹1,075.77 | ₹1,051.53
The ₹1,075–₹1,107 zone serves as a strong institutional support, aligning with prior demand clusters.
Weak resistance pockets lie between ₹1,163–₹1,208, opening space for a clean momentum push if price sustains above ₹1,155.
📊 STWP Volume & Technical Setup:
Today’s volume surged to 3.56M vs 1.3M average, confirming high institutional participation.
The chart highlights multiple technical confirmations — a strong EMA crossover, momentum breakout, and volatility expansion supported by a bullish candle formation.
Key momentum oscillators are turning upward, reflecting renewed strength and sustained bullish bias across timeframes.
🧩 STWP Summary View:
Final Outlook:
Momentum: Strong | Trend: Uptrend | Risk: High| Volume: High
Aurobindo Pharma is exhibiting robust institutional footprints with trend confirmation across all major indicators.
As long as the price holds above ₹1,107–₹1,120, the structure remains intact with scope for a short-term move toward ₹1,177–₹1,208.
The bias remains bullish with uptrend continuation potential into the next few sessions.
⚠️ Disclosure & Disclaimer – Please Read Carefully
This post is shared only for educational and informational purposes. It is not a buy/sell recommendation or financial advice.
I am not a SEBI-registered investment adviser; all views are based on technical observation and public market data.
Trading involves risk. Market movements can be unpredictable and may result in losses.
Always perform your own research or consult a SEBI-registered financial advisor before trading.
Position Status: No active position in (AUROPHARMA) at the time of this analysis.
Data Source: TradingView & NSE India
💬 Found this useful?
🔼 Give this post a Boost if you value structured, professional breakdowns.
✍️ Share your thoughts or charts below — let’s learn together!
🔁 Spread this post to help more traders adopt data-driven analysis.
👉 Follow for more clean, institutional-style setups with clarity and discipline.
🚀 Stay Calm. Stay Clean. Trade With Patience.
Trade Smart | Learn Zones | Be Self-Reliant 📊

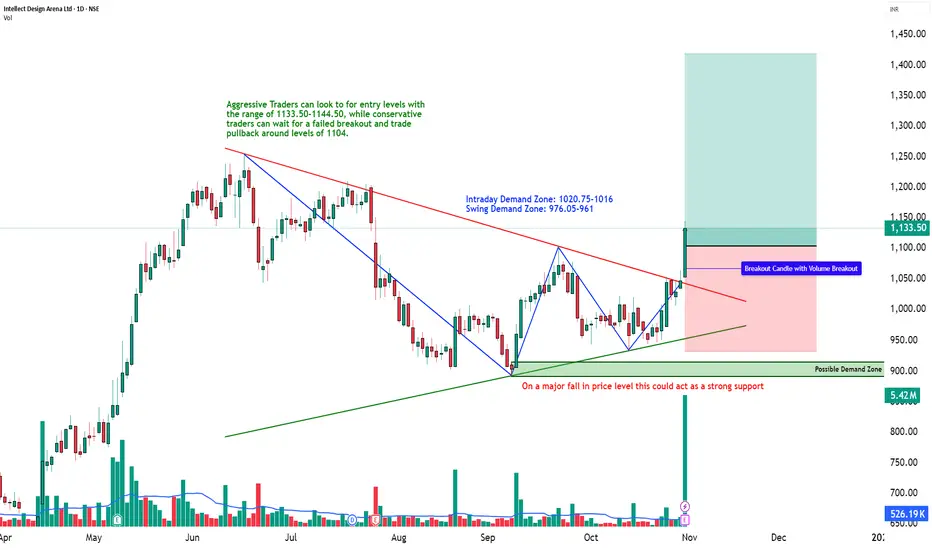
Descending Triangle Breakout with Institutional Volume | STWP💹 Intellect Design Arena Ltd (NSE: INTELLECT)
Sector: IT – FinTech Solutions | CMP: ₹1,133.50 | View: Bullish Momentum Breakout Setup
📊 Price Action:
Intellect Design Arena has delivered a strong bullish breakout from its multi-month descending trendline, marking a structural shift from a consolidation base to a clear uptrend.
The stock reversed sharply from the ₹890 swing low and confirmed momentum above the ₹1,100–₹1,120 zone with an explosive 10x volume expansion.
The wide-range bullish candle and sustained higher close suggest institutional breakout participation and trend continuation toward upper resistance zones.
💼 HNI Trade Levels (STWP Setup):
Aggressive Entry: ₹1,114.50 | Stop Loss: ₹1,044.35
Low-Risk Entry: ₹1,076.5 | Stop Loss: ₹1,019.5
HNI and institutional activity is visible through heavy delivery-based volume and strong follow-up momentum.
The bullish structure remains intact as long as price sustains above ₹1,075–₹1,080, where short-term demand has been confirmed.
📉 VCP Analysis:
Intellect displays a multi-stage Volatility Contraction Pattern (VCP) — 8 visible contractions as per the VCP dashboard.
Each contraction narrowed with decreasing volume before the final 20-day breakout candle confirmed a volatility expansion phase.
This marks the beginning of a trend acceleration stage, aligning perfectly with RSI, MACD, and Supertrend confirmations.
📈 STWP Trading Analysis:
Entry: ₹1,114.50 | Stop Loss: ₹1,044.35
The breakout candle exhibits strong momentum with 5.42M volume vs an average of 0.52M, indicating institutional footprints.
The price is now sustaining above short- and medium-term EMAs, with all major timeframes (Daily–Weekly–Monthly) confirming an uptrend alignment.
Holding above ₹1,095–₹1,075 will maintain the bullish bias, keeping momentum setups active toward ₹1,175–₹1,255 zones.
📏 Fibonacci Analysis:
From swing low ₹890.25 to swing high ₹1,255.0:
61.8% @ ₹1,115.7 → Confirmed breakout level.
78.6% @ ₹1,176.9 → Next momentum target.
100% @ ₹1,255.0 → Swing resistance.
A daily close above ₹1,116 validates the Fibonacci continuation path toward ₹1,255–₹1,285, with an extended potential to ₹1,354 (Fibo 127.2% projection).
🧭 STWP Support & Resistance:
Resistances: ₹1,167.5 | ₹1,201.5 | ₹1,255.0
Supports: ₹1,076.5 | ₹1,019.5 | ₹985.5
The ₹1,076–₹1,020 zone acts as a key accumulation pocket, while the ₹1,255 area marks a significant swing barrier.
Structure indicates strong base support with progressive higher demand, suggesting buyers remain dominant on dips.
📊 STWP Volume & Technical Setup:
Today’s session recorded 5.42M shares vs 0.52M average, a 10x volume surge, confirming institutional breakout participation.
Indicators show bullish MACD crossover, RSI momentum above 70, and Stochastic strength across all timeframes.
The breakout is also validated by Bollinger Band expansion, signaling volatility release.
Trend Direction: UPTREND | Volume Confirmation: Strong Institutional Activity
🧩 STWP Summary View:
Final Outlook:
Momentum: Strong | Trend: Bullish | Risk: High | Volume: High
Intellect Design Arena has transitioned into a confirmed bullish continuation phase with institutional footprints and multi-indicator confirmation.
Holding above ₹1,075 keeps the pattern valid for a potential rally toward ₹1,175–₹1,255 levels.
The setup remains technically clean, high-volume backed, and trend-aligned — favoring bullish bias continuation in the near term.
⚠️ Disclosure & Disclaimer – Please Read Carefully
The information shared here is meant purely for learning and awareness. It is not a buy or sell recommendation and should not be construed as investment advice.
I am not a SEBI-registered investment adviser, and this analysis is based on chart observations, technical patterns, and public data.
Trading involves risk; market movements can be sudden, and losses may exceed invested capital.
Past performance or setups do not guarantee future results.
Please evaluate your risk management and suitability before taking any trading decision.
Consult a SEBI-registered financial adviser before acting on any trade idea.
Position Status: No active position in (INTELLECT) at the time of analysis.
Data Source: TradingView & NSE India (Past Chart Reference).
💬 Found this useful?
🔼 Give this post a Boost to help more traders discover structured learning.
✍️ Drop your thoughts, queries, or setups in the comments — let’s grow together!
🔁 Share this with fellow traders and learners to promote structured analysis.
👉 “If you liked this breakdown, follow for more clean, disciplined setups with patience at the core.”
🚀 Stay Calm. Stay Clean. Trade With Patience.
Trade Smart | Learn Zones | Be Self-Reliant 📊
Daily Analysis Nifty: 31/10/25Too much volatility in the prices of Nifty.
Right now, the greed zone is active in the market. 25770 is a subtle support level, but the bearish market is still not around the corner unless it is trading above 25400. 300 points of consolidation are evident. Any clear trend will be on the break of either side.

#NIFTY Intraday Support and Resistance Levels - 31/10/2025Nifty is likely to open slightly gap up near the 25,900–25,950 zone, remaining within the ongoing consolidation range seen over the past few sessions. The index continues to trade between key support and resistance zones, reflecting indecision among traders as the market awaits a clear breakout in either direction.
If Nifty sustains above 25,950–26,000, we may see a gradual upside move toward 26,050, 26,150, and 26,250+ levels. A breakout above 26,250 will confirm renewed bullish momentum, opening the path for a short-term rally toward 26,400–26,450.
On the downside, immediate support lies near 25,850–25,800. A breakdown below 25,800 could drag the index toward 25,750 and 25,650 levels, indicating short-term weakness.
Overall, with a slightly gap up opening inside the consolidation zone, traders should remain cautious and focus on trading only after a breakout from the 25,800–26,050 range. Until then, range-bound movement with limited momentum can be expected, so quick entries and exits with strict stop losses are advisable.

[INTRADAY] #BANKNIFTY PE & CE Levels(31/10/2025)Bank Nifty is expected to open flat near the 58,000–58,100 zone, indicating a balanced sentiment between buyers and sellers after recent sessions of consolidation. The index is trading around a crucial support area, and the next move will likely depend on how it behaves around this level.
If Bank Nifty sustains above 58,100, a minor recovery toward 58,250, 58,350, and 58,450+ levels can be expected. A breakout above 58,450 will strengthen bullish momentum and open the path toward 58,600–58,850 levels.
On the downside, immediate support is placed at 57,950. A breakdown below 57,950 could trigger selling pressure, leading to a slide toward 57,750, 57,650, and 57,550–57,500 zones.
Overall, with a flat opening, Bank Nifty is likely to remain range-bound initially. Traders should wait for a decisive breakout above 58,100 or a breakdown below 57,950 for clear intraday direction, keeping a strict stop loss to manage volatility ahead of weekend sessions.

CANARA BANK BREAKOUTCANARA BANK
ADD ON YOUR WATCHLIST
If you see in the chart, the rounding pattern has broken out and it is in the weekly time frame
You can buy at Rs 125 and go up to the target of 146 and 163. The Stop-loss can be kept at 117.50
Note: Our posts are posted for learning purposes. You are responsible for any profit or loss you make from the advice given in the channel. Before investing in the stock market, you must consult your financial advisor.
WE ARE NOT A SEBI REGISTERED

HUDCO - Keep in Radar!Pattern: Continuation Diamond (Bullish)
The stock has been consolidating in a long pattern after an extended uptrend.
This setup signals long-term upside momentum — suitable for investors or position traders rather than short-term trades.
This analysis is for educational and informational purposes only and should not be considered investment advice. Market investments are subject to risks. Please consult your financial advisor before making any investment decisions.
