HUDCO - Keep in Radar!Pattern: Continuation Diamond (Bullish)
The stock has been consolidating in a long pattern after an extended uptrend.
This setup signals long-term upside momentum — suitable for investors or position traders rather than short-term trades.
This analysis is for educational and informational purposes only and should not be considered investment advice. Market investments are subject to risks. Please consult your financial advisor before making any investment decisions.
Technical Analysis

Indraprastha Medical Ltd | Bullish Flag Breakout | Swing SetupCompany Overview (Fundamental)
Indraprastha Medical Corporation Ltd (IMCL) operates under the Apollo Hospitals Group and manages the Indraprastha Apollo Hospital, New Delhi — one of India’s largest multi-specialty hospitals. Company financially strong, consistent profitability, improving margins, and low debt.
Fundamentally stable company with consistent earnings and a defensive sector (Healthcare).
Strong base for technical breakout follow-through.
💰 Market Cap: ~₹5,400 Cr
📈 Revenue Growth (YoY): +16% (Strong Growth)
💸 Net Profit Margin: ~10–12% (steady)
💵 Debt-to-Equity: 0.05 (virtually debt-free)
📊 ROE (Return on Equity): ~20%
Technical Overview
The setup represents a bullish continuation phase, with EMAs stacked positively and volume confirming accumulation.
Price trades above all 3 key EMAs (9, 20, 50) — strong bullish alignment.
Formation of a textbook Bullish Flag Pattern after a sharp pole rally from ₹460 to ₹610.
Recent candle closed bullish with +3.4% gain and high volume (2.48M) — indicating renewed buying interest.
RSI ~60 → Momentum healthy and not overbought.
MACD positive crossover developing, confirming bullish trend strength.
Price Action Analysis
Clean, bullish, momentum-driven move with volume confirmation.
Buy on dip near breakout retest at ₹580-583
Book Partial profit at ₹625–630
target 2: ₹655–660 this will be Flag breakout projection.
A perfect risk to reward ratio following.
Disclaimer
This analysis is for educational and research purposes only — not investment advice.
Always do your own due diligence and manage risk before trading.

Major Counter Trendline Structure, Strong Channel & Demand FlipThe weekly chart for Chennai Petroleum Corporation Ltd (CPCL) presents a robust technical development without classic breakout language.
-Price action has respected a prominent red counter trendline, with the latest move representing a shift in momentum against the prior trend.
-A clean parallel channel with dotted lines has formed, indicating sustained price progression and orderly accumulation over several months.
-There's a key supply-demand conversion zone, now acting as a pivotal support area after functioning as resistance. This is where previous selling interest is replaced by renewed buying activity.
-Notably, volumes are surging in alignment with this move, confirming broad participation and strong conviction among buyers.

Aditya Birla Capital | Bullish Momentum with Exceptional Volume 💹 Aditya Birla Capital Ltd (NSE: ABCAPITAL)
Sector: Financial Services | CMP: ₹326.80 | View: Bullish Continuation Setup
📊 Price Action:
Aditya Birla Capital witnessed a bullish breakout from a tight consolidation range, confirming renewed buying interest.
Price action shows strong momentum as the stock reclaimed short-term resistance with conviction.
Sustaining above 325 can open the path toward 340–347 in the short term, supported by high-volume expansion.
💼 HNI Trade Levels (STWP Setup):
Aggressive Entry: 326.80–328.81 | Stop Loss: 310.58
Low-Risk Entry: 323.14 | Stop Loss: 305.51
HNI and institutional traders have shown clear accumulation interest backed by strong volumes.
The bullish structure with expanding range candles indicates smart money positioning early into the trend.
Momentum continuation is likely as long as price sustains above 314–316 support.
📉 VCP Analysis:
Aditya Birla Capital displays a classic Volatility Contraction Pattern, tightening across the last few weeks before the breakout.
Today’s 20-day volume breakout confirms the end of contraction and the beginning of a volatility expansion phase.
The setup indicates strong institutional intent aligning with the final stage of the VCP breakout.
📈 STWP Trading Analysis:
Entry: 328.80 | Stop Loss: 310.58
Strong bullish candle supported by a 5x surge in volume highlights aggressive participation.
The trend structure remains positive with a series of higher highs and higher lows.
Holding above 320 will keep the bias firmly bullish and validate the ongoing uptrend.
📏 Fibonacci Analysis:
The Fibonacci retracement from the recent swing low at 269.84 to swing high at 350.50 places the price near the 38.2% zone, maintaining a healthy correction within trend.
Holding above 314–316 (23.6%) keeps the pattern intact and supports trend continuation.
A breakout above 333.87 (resistance 1) could drive a move toward 347–353, aligning with the Fibonacci extension projections.
🧭 STWP Support & Resistance:
Resistances: 333.87 | 340.93 | 353.07
Supports: 314.67 | 302.53 | 295.47
While resistance zones near 333–353 may face mild supply, supports between 302–314 appear strong with institutional defense.
Major demand zones are visible near 283–295, confirming deep accumulation pockets.
The setup structure remains bullish with strong support and relatively weak resistance above 333.
📊 STWP Volume & Technical Setup:
Today’s session recorded exceptional volume at 27.94M vs 5.43M average, a 5.14x surge, confirming institutional activity.
The yellow label highlights multiple confirmations — bullish engulfing candle, RSI breakout, and Bollinger Band expansion, signaling volatility release from compression.
Indicators like MACD and Stochastic remain bullish across daily to weekly timeframes, strengthening the continuation outlook.
🧩 STWP Summary View:
Final Outlook:
Momentum: Strong | Trend: Bullish | Risk: Moderate | Volume: High
Aditya Birla Capital is showing a strong technical structure with institutional footprints, rising volumes, and momentum confirmation.
Sustaining above 320 keeps risk controlled, while a decisive move above 333 could accelerate momentum toward higher resistance zones.
The bias remains bullish with trend continuation potential in the near term.
⚠️ Disclosure & Disclaimer – Please Read Carefully
The information shared here is meant purely for learning and awareness. It is not a buy or sell recommendation and should not be taken as investment advice.
I am not a SEBI-registered investment adviser, and all views expressed are based on personal study, chart patterns, and publicly available market data.
Trading—whether in stocks or options—carries risk. Markets can move unexpectedly, and losses can sometimes exceed the money you have invested.
Past performance or past setups do not guarantee future results. Always assess your risk, position sizing, and strategy suitability before entering trades.
Consult a SEBI-registered financial adviser before making any real trading decision.
Position Status: No active position in (ABCAPITAL) at the time of analysis.
Data Source: TradingView & NSE India (Past Chart Reference)
💬 Found this useful?
🔼 Give this post a Boost to help more traders discover structured learning.
✍️ Drop your thoughts, questions, or setups in the comments — let’s grow together!
🔁 Share with fellow traders and beginners to spread awareness.
👉 “If you liked this breakdown, follow for more clean, structured setups with discipline at the core.”
🚀 Stay Calm. Stay Clean. Trade With Patience.
Trade Smart | Learn Zones | Be Self-Reliant 📊

🇺🇸 IMPACT OF FED AFTER FOMC DECISION🇺🇸 IMPACT OF FED AFTER FOMC DECISION
Hello traders,
The latest Federal Reserve rate decision shook global markets — pushing Gold (XAUUSD) and Bitcoin lower while the US Dollar strengthened sharply.
The Fed cut interest rates for the second time this year, bringing them down to 3.75%–4%, but the announcement to end Quantitative Tightening (QT) by 1st Dec 2025 was the real game changer.
This is the moment to stay calm, read the market structure, and act according to your plan.
📰 MACRO ANALYSIS – THE FED’S DOUBLE IMPACT
Rate Cut (Normally Bullish for Gold):
The second rate cut should, in theory, support Gold prices. However, much of this was already priced in before the announcement.
QT Ending (USD Strength Booster):
Ending QT signals that the Fed is trying to rebalance its monetary stance. This boosted the US Dollar Index (DXY), putting heavy selling pressure on both Gold and BTC.
Market Reaction:
Gold saw a sharp drop right after the announcement, then moved sideways in a wide range. During today’s Asian session, Gold fluctuated nearly $70 before retracing slightly.
📊 TECHNICAL OUTLOOK – WIDE RANGE, BUILDING BULLISH STRUCTURE
Looking at the current XAUUSD market structure:
Structure: Gold is currently consolidating in a wide range. However, a bullish structure seems to be forming with higher lows — a sustainable Dow-style uptrend pattern.
Trading Plan: Stay flexible and trade both sides —
🔴 Sell (Short) near liquidity resistance zones.
🟢 Buy (Long) from deep liquidity supports.
🎯 TRADING ACTION PLAN
🔴 SELL CONTINUATION – Short from Resistance
Entry Zone: 4005
Stop Loss: 4013
Targets:
TP1: 3990
TP2: 3975
TP3: 3960
TP4: 3943
🟢 BUY RECOVERY – Long from Support
Entry Zone: 3907–3909
Stop Loss: 3902
Targets:
TP1: 3933
TP2: 3954
TP3: 3970
TP4: 3999
⚖️ FINAL THOUGHTS
The Fed’s decision has reshaped the short-term outlook.
A $70 volatility range shows Gold’s high liquidity — but also high risk.
📌 LiamTrading’s Note:
A strong bullish structure is building up on the lower timeframes. Patience is key — wait for the ideal Buy zone near 3907 to catch the next recovery leg.
Always maintain strict risk and capital management, especially during post-FOMC volatility.
Are you ready to ride this 70-dollar range?
👉 Tap LIKE 👍 and COMMENT your setup!

Oil India | Bullish Breakout with Institutional Volume Surge💹 Oil India Ltd (NSE: OIL)
Sector: Energy | CMP: ₹438.05 | View: Bullish Breakout Setup
📊 Price Action:
Oil India has shown a strong bullish candle breakout after weeks of consolidation between 410–420. Buyers stepped in aggressively with volume confirmation, pushing price above the short-term resistance. A sustained close above 435 could trigger a fresh up-move toward the 450–455 zone.
HNI Trade Levels (STWP Setup):
Aggressive Entry: 434.75–436.20 | Stop Loss: 416.08
Low-Risk Entry: 432.57 | Stop Loss: 411.75
HNI and institutional buyers are showing strong accumulation interest with rising volumes. The breakout candle indicates smart money entering early into the trend. Sustained buying momentum suggests continued institutional participation ahead.
VCP Analysis:
Oil India is forming a smooth Volatility Contraction Pattern with clear price tightening in recent weeks. Volume contraction followed by today’s strong expansion indicates a potential VCP breakout stage. The surge in volume confirms institutional activity aligning with the final contraction phase breakout.
STWP Trading Analysis:
Entry: 436.20 | Stop Loss: 410.30
Strong bullish momentum with a wide-range candle backed by heavy institutional volumes. The breakout structure signals renewed trend strength with clear directional intent. Sustaining above 430 will keep the momentum in favor of buyers.
Fibonacci Analysis:
Oil India’s Fibonacci structure is plotted from the Swing Low at 384.6 to the Swing High at 491.5, capturing the recent trend wave. The stock is currently trading near the 50% retracement level at 438.05, showing a strong recovery within the ongoing uptrend. Holding above the 38.2% zone at 425.44 will keep momentum intact, while a breakout above the 61.8% level at 450.66 could extend the move toward 468–491, confirming trend continuation.
STWP Support & Resistance:
Resistances: 440.53 | 446.32 | 456.43
Supports: 424.63 | 414.52 | 408.73
While we note the above technical levels, the chart displays resistance zones at 448–456 and 478–491 as relatively weak, indicating limited selling pressure. However, supports near 392–384 and 325–350 appear strong, reflecting firm institutional demand and accumulation interest. This structure suggests a bullish bias, where sustained buying above 440 could trigger continuation momentum toward higher levels.
STWP Volume & Technical Setup:
Oil India delivered a power-packed bullish session today, marked by a strong Marubozu candle that reflected uninterrupted buying momentum from open to close. The chart’s yellow label captures a perfect storm of bullish confirmations — from exceptional volume (6.03M vs 2.48M avg, ratio 2.43x) to a Bollinger Band breakout emerging right after a compression phase, signaling fresh volatility expansion. The RSI breakout, 200 EMA crossover, and BB Squeeze trigger all align to validate institutional accumulation and trend strength. With buyer dominance clearly visible, Oil India stands poised for a momentum-driven continuation in the sessions ahead.
STWP Summary View:
Final Outlook:
Momentum: Strong | Trend: Bullish | Risk: Low | Volume: High
Oil India displays a textbook bullish setup with strong price action, expanding volume, and visible institutional activity.
A high-volume breakout from a tight base confirms trend strength and upside potential. Holding above key supports keeps risk low and the bullish momentum intact.
________________________________________
________________________________________
⚠️ Disclosure & Disclaimer – Please Read Carefully
The information shared here is meant purely for learning and awareness. It is not a buy or sell recommendation and should not be taken as investment advice. I am not a SEBI-registered investment adviser, and all views expressed are based on personal study, chart patterns, and publicly available market data.
Trading—whether in stocks or options—carries risk. Markets can move unexpectedly, and losses can sometimes exceed the money you have invested. Past performance or past setups do not guarantee future results.
If you are a beginner, treat this as a guide to understand how the market works and practice on paper trades before risking real money. If you are experienced, always assess your own risk, position sizing, and strategy suitability before entering trades.
Consult a SEBI-registered financial adviser before making any real trading decision. By engaging with this content, you acknowledge full responsibility for your trades and investments.
Position Status: No active position in (OIL) at the time of analysis.
Data Source: TradingView & NSE India (Past Chart Reference) (Historical levels)
💬 Found this useful?
🔼 Give this post a Boost to help more traders discover clean, structured learning.
✍️ Drop your thoughts, questions, or setups in the comments — let’s grow together!
🔁 Share with fellow traders and beginners to spread awareness.
👉 “If you liked this breakdown, follow for more clean, structured setups with discipline at the core.”
🚀 Stay Calm. Stay Clean. Trade With Patience.
Trade Smart | Learn Zones | Be Self-Reliant 📊

#NIFTY Intraday Support and Resistance Levels - 30/10/2025Nifty is expected to open slightly gap up near the 26,050–26,100 zone, indicating a continuation of positive sentiment seen in the previous sessions. The index has moved out of its recent consolidation phase and is now trading near a key breakout level, suggesting that buyers are gradually regaining control.
If Nifty sustains above 26,100, we could see an upward move toward 26,150, 26,250, and 26,450+ levels. A breakout above 26,250 will confirm strong bullish momentum and could trigger a rally toward 26,450–26,600 in the short term.
On the downside, immediate support lies near 25,950–25,900. A dip below 25,900 might lead to mild profit booking, pulling the index back toward 25,800 and 25,750 levels.
Overall, with a slightly gap up opening, the market sentiment remains positive. Traders should watch for sustained trade above 26,050 for long opportunities while maintaining a trailing stop loss below 25,900 to safeguard gains in case of a pullback.

[INTRADAY] #BANKNIFTY PE & CE Levels(30/10/2025)Bank Nifty is expected to open with a gap up near the 58,400–58,450 zone, continuing the positive sentiment seen in the previous session. The index is showing signs of strength as it trades above crucial support zones, indicating a possible continuation toward higher levels if momentum sustains after the opening.
If Bank Nifty holds above 58,450–58,500, it can extend gains toward 58,650, 58,850, and 58,950+ levels. A breakout above 58,950 will further confirm bullish momentum and could lead to a strong rally toward 59,100–59,250 in the short term.
On the downside, immediate support lies near 58,150–58,050. A fall below 58,050 may lead to a short-term pullback toward 57,850 and 57,650 zones.
Overall, the sentiment remains bullish with a gap up opening, and as long as Bank Nifty sustains above 58,150, traders should focus on buying on dips with a trailing stop loss below 58,000 to protect profits during volatility.

DAILY TRADING PLAN — GOLD (XAU/USD) | Pullback Buy Zones 🧭 DAILY TRADING PLAN – GOLD (XAU/USD)
Date: Oct 29, 2025
Main timeframe: M15 – M30
Strategy: SMC + Trendline + Fibo confluence
🧩 MARKET CONTEXT
Price created a BOS at 3983, indicating short-term bullish momentum within an ascending channel. The current structure supports pullback buys from demand / OB zones before targeting key resistance levels 4018 → 4085–4102 (Fibo reaction zone).
🎯 TRADE SETUPS
1️⃣ BUY #1 (Preferred – Retest Trendline / CP)
Entry: 3961
SL: 3955 (6 pts)
TP1: 3983
TP2: 4018
Structure-based retest at 50% trendline + CP zone
2️⃣ BUY #2 (OBS / OB Zone)
Entry: 3934 – 3932
SL: 3928 (6 pts)
TP1: 3983
TP2: 4018
TP3: 4085 – 4102 (extension target)
3️⃣ SELL (Counter-trend only)
Entry: 3992 – 3994
SL: 4000 (6 pts)
TP1: 3934
TP2: 3910
Use only if there is a clear rejection candle around the 3990s zone.
📈 BIAS
Short-term bullish while above 3930–3910.
Watch 3961 / 3932 zones for buy reactions.
Shorts valid only if strong rejection occurs at 3990s.

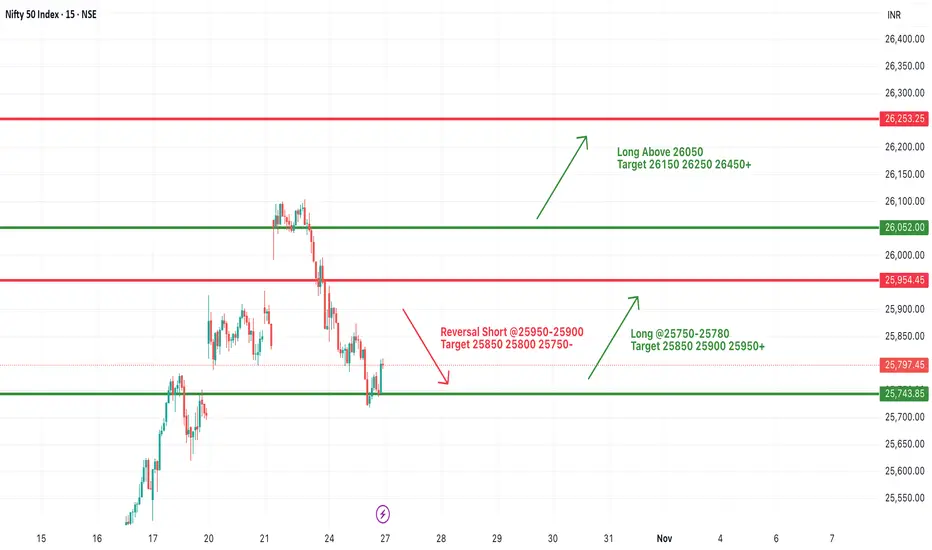
#NIFTY Intraday Support and Resistance Levels - 29/10/2025Nifty is expected to open with a gap up near the 26,000–26,050 zone, indicating strong buying interest after the recent consolidation phase. The index has been oscillating within a range, and today’s opening above the consolidation zone may trigger a directional move if sustained.
If Nifty holds above 26,050–26,100, it could extend gains toward 26,150, 26,250, and 26,450+ levels. A breakout above 26,250 will confirm bullish momentum and may lead to further upside toward 26,450–26,600 in the short term.
On the downside, immediate support lies near 25,950–25,900. A fall below 25,900 could invite minor profit booking, pushing the index toward 25,800 and 25,750 zones.
Overall, with a gap up opening above the consolidation zone, the market sentiment remains positive. Traders should focus on long positions above 26,050, while maintaining a trailing stop loss below 25,900 to safeguard profits.

[INTRADAY] #BANKNIFTY PE & CE Levels(29/10/2025)Bank Nifty is likely to open with a gap up near the 58,250–58,300 zone, indicating continued strength from the previous session’s close. The index has broken out of a short-term consolidation zone, showing signs of bullish momentum building up once again.
If Bank Nifty sustains above 58,300, we can expect a move toward 58,450, 58,550, and 58,750+ levels. A breakout above 58,850–58,950 will further strengthen the trend and open the path toward the 59,100–59,250 zone.
On the downside, immediate support lies near 58,050–57,950. A fall below 57,950 may trigger mild profit booking, dragging the index toward 57,750 and 57,600 zones.
Overall, with a gap up opening, the sentiment remains positive and bullish. Traders should look for buying opportunities on dips above 58,100 while keeping a trailing stop loss near 57,950 to protect profits in case of volatility.

GRAPHITE - Near 18months old ResistanceGRAPHITE - The market structure looks strongly bullish, and EMAs are perfectly aligned, confirming trend strength.
The stock is now approaching an 18-month-old resistance zone. A breakout above this level could open the door for a solid upside move.
However, it’s important to wait for a retest and proper confirmation before entering, even during paper trading.
Keep it on your watchlist for paper trading.
✅ If you like my analysis, please follow me here as a token of appreciation :)
in.tradingview.com/u/SatpalS/
📌 For learning and educational purposes only, not a recommendation. Please consult your financial advisor before investing.

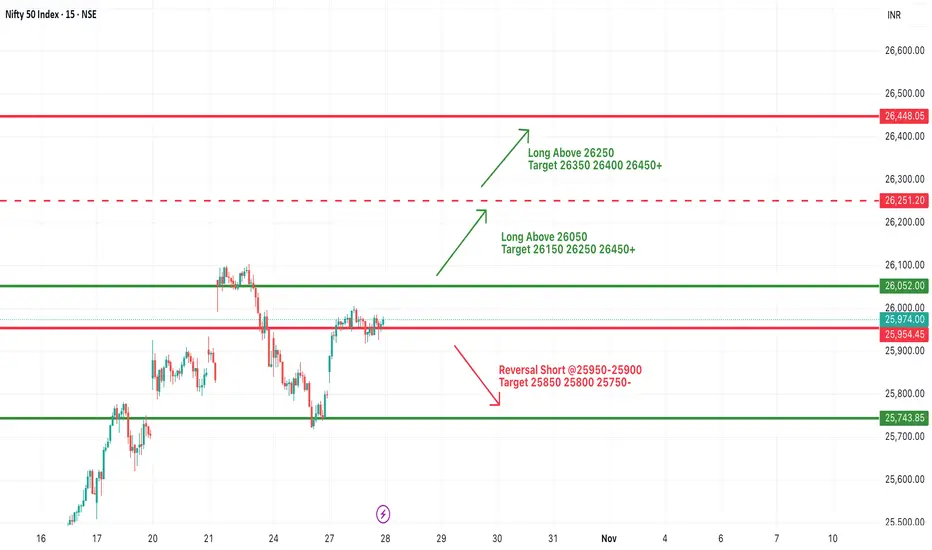
#NIFTY Intraday Support and Resistance Levels - 28/10/2025Nifty is expected to open with a gap up above the 26,050 level, indicating bullish momentum carried over from the previous session. The index has reclaimed a crucial resistance zone and now stands poised for a potential breakout continuation if buying pressure sustains after the opening bell.
If Nifty holds above 26,050, we could see further upside toward 26,150, 26,250, and 26,450+ levels. A breakout above 26,250 may accelerate momentum and push the index toward 26,450–26,600, confirming short-term bullish strength.
On the downside, immediate support lies around 25,950–25,900. A fall below 25,900 may trigger a minor pullback toward 25,800 and 25,750 zones.
Overall, the gap up opening above 26,050 reflects positive sentiment, and as long as Nifty sustains above this level, the trend remains bullish. Traders should focus on trend-following entries on dips and maintain a trailing stop loss below 25,900 to protect profits in case of volatility.
[INTRADAY] #BANKNIFTY PE & CE Levels(28/10/2025)Bank Nifty is expected to open flat to slightly gap up near the 58,100–58,200 zone, reflecting positive momentum from the previous session’s recovery. The index has managed to hold above key short-term supports, showing signs of a gradual bullish reversal after a corrective phase.
If Bank Nifty sustains above 58,100–58,150, we may see continued strength toward 58,250, 58,350, and 58,450+ levels. A decisive breakout above 58,550 could accelerate momentum, opening the path for 58,750–58,950 in the coming sessions.
On the downside, immediate support lies near 57,950–57,900. A fall below 57,900 could trigger mild profit booking, dragging the index toward 57,750 and 57,600 zones.
Overall, with a flat to slightly gap up opening, the sentiment remains cautiously bullish. Traders should look for sustained moves above 58,100 for intraday longs, while maintaining a strict stop loss below 57,900 to manage risk effectively.

Bank Of India will make Cup ShapeNSE:BANKINDIA expected to make cup shape in coming days.
This analysis is for educational and informational purposes only and should not be considered investment advice. Market investments are subject to risks. Please consult your financial advisor before making any investment decisions.

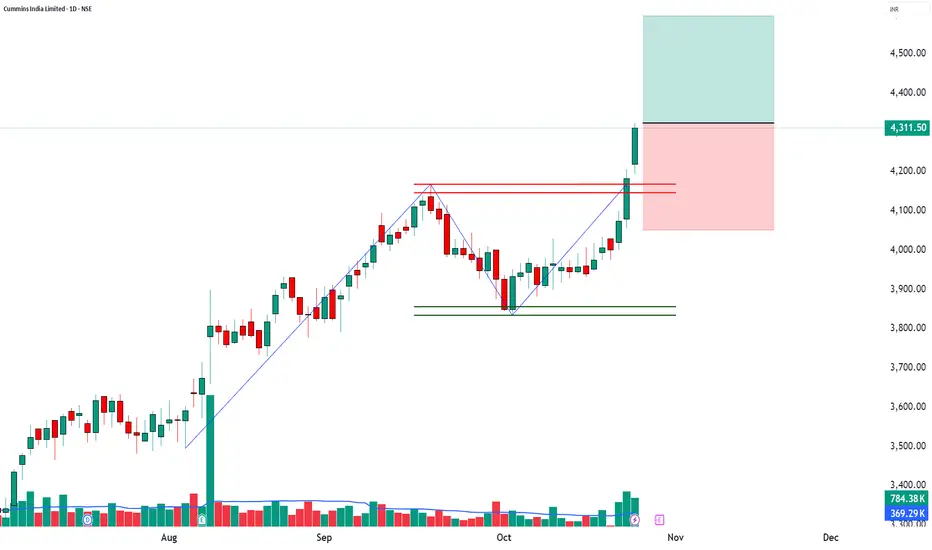
CUMMINSIND | 52-Week Breakout + Volume Expansion📈 CUMMINSIND | 52-Week Breakout + Volume Expansion + Institutional Momentum 🚀
🔹 Entry Zone: ₹4,311.50 – ₹4,324.00
🔹 Stop Loss: ₹4,051.05 (Risk ~273 pts)
🔹 Supports: 4,230 / 4,148.5 / 4,101.5
🔹 Resistances: 4,358.5 / 4,405.5 / 4,487
🔹 Swing Demand Zone: ₹4,096.70 – ₹4,060.10
🔹 Intraday Demand Zone: ₹4,086.20 – ₹4,065.00
🔑 Key Highlights
✅ 52-Week Breakout – strong bullish sentiment and trend expansion
✅ Exceptional Volume (2.12x avg) – clear institutional participation
✅ Bollinger Band Expansion – rising volatility supporting fresh rally
✅ Buy Today, Sell Tomorrow Setup – high momentum carryover expected
✅ VWAP Alignment – buyers maintaining upper hand
🎯 STWP Trade View
📊 Stock has shown powerful bullish momentum with record volume; however, post-breakout consolidation may occur near ₹4,358–₹4,405.
⚠️ The ₹4,086–₹4,065 intraday zone and ₹4,096–₹4,060 swing zone act as crucial support for momentum traders to plan re-entries.
💡 Learning Note
A 52-week breakout supported by heavy volume and VWAP strength signals potential institutional accumulation. Traders should trail profits gradually and watch for sustained volume to confirm continuation.
Final Outlook: Momentum: Moderate | Trend: Neutral | Risk: Low | Volume: High
________________________________________
________________________________________
⚠️ Disclosure & Disclaimer – Please Read Carefully
The information shared here is meant purely for learning and awareness. It is not a buy or sell recommendation and should not be taken as investment advice. I am not a SEBI-registered investment adviser, and all views expressed are based on personal study, chart patterns, and publicly available market data.
Trading—whether in stocks or options—carries risk. Markets can move unexpectedly, and losses can sometimes exceed the money you have invested. Past performance or past setups do not guarantee future results.
If you are a beginner, treat this as a guide to understand how the market works and practice on paper trades before risking real money. If you are experienced, always assess your own risk, position sizing, and strategy suitability before entering trades.
Consult a SEBI-registered financial adviser before making any real trading decision. By engaging with this content, you acknowledge full responsibility for your trades and investments.
Position Status: No active position in CUMMINSIND at the time of analysis.
Data Source: TradingView & NSE India (Past Chart Reference) (Historical levels)
💬 Found this useful?
🔼 Give this post a Boost to help more traders discover clean, structured learning.
✍️ Drop your thoughts, questions, or setups in the comments — let’s grow together!
🔁 Share with fellow traders and beginners to spread awareness.
👉 “If you liked this breakdown, follow for more clean, structured setups with discipline at the core.”
🚀 Stay Calm. Stay Clean. Trade With Patience.
Trade Smart | Learn Zones | Be Self-Reliant 📊
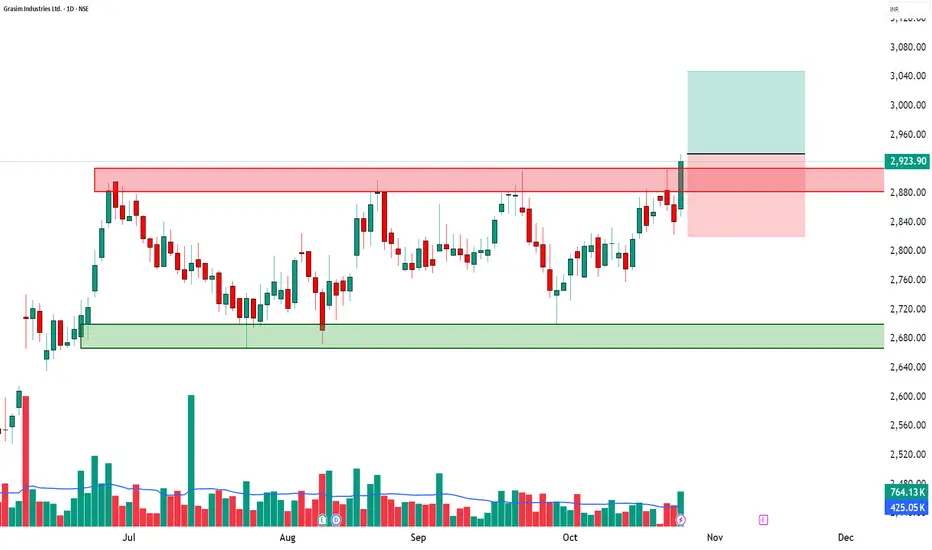
GRASIM | 52-Week Breakout + RSI Surge + High Volume📈 GRASIM | 52-Week Breakout + RSI Surge + High Volume Confirmation 🚀
🔹 Entry Zone: ₹2,923.90 – ₹2,934.00
🔹 Stop Loss: ₹2,820.45 (Risk ~113 pts)
🔹 Supports: 2,869.67 / 2,815.43 / 2,783.27
🔹 Resistances: 2,956.07 / 2,988.23 / 3,042.47
🔹 Swing Demand Zone: ₹2,787 – ₹2,764.50
🔑 Key Highlights
✅ 52-Week Breakout – strong confirmation of bullish momentum continuation
✅ RSI Breakout – trend acceleration backed by strength
✅ Bollinger Band Expansion – volatility breakout indicates fresh momentum
✅ VWAP Alignment – buyers maintaining control across sessions
✅ Volume Spike (1.8x avg) – institutional buying and strong follow-up interest
🎯 STWP Trade View
📊 Momentum favors continued bullish strength. Sustaining above ₹2,956 could extend the move toward ₹2,988–₹3,042 levels.
⚠️ The ₹2,787–₹2,764 zone acts as a key swing base where accumulation is likely to continue if prices retest.
💡 Learning Note
This setup demonstrates how a 52-week breakout with RSI and VWAP confirmation can mark a major trend continuation point. Volume expansion adds conviction, making such setups ideal for momentum-based swing trades.
Final Outlook: Momentum: Strong | Trend: Bullish | Risk: Low | Volume: High
________________________________________
________________________________________
⚠️ Disclosure & Disclaimer – Please Read Carefully
The information shared here is meant purely for learning and awareness. It is not a buy or sell recommendation and should not be taken as investment advice. I am not a SEBI-registered investment adviser, and all views expressed are based on personal study, chart patterns, and publicly available market data.
Trading—whether in stocks or options—carries risk. Markets can move unexpectedly, and losses can sometimes exceed the money you have invested. Past performance or past setups do not guarantee future results.
If you are a beginner, treat this as a guide to understand how the market works and practice on paper trades before risking real money. If you are experienced, always assess your own risk, position sizing, and strategy suitability before entering trades.
Consult a SEBI-registered financial adviser before making any real trading decision. By engaging with this content, you acknowledge full responsibility for your trades and investments.
Position Status: No active position in GRASIM at the time of analysis.
Data Source: TradingView & NSE India (Past Chart Reference) (Historical levels)
💬 Found this useful?
🔼 Give this post a Boost to help more traders discover clean, structured learning.
✍️ Drop your thoughts, questions, or setups in the comments — let’s grow together!
🔁 Share with fellow traders and beginners to spread awareness.
👉 “If you liked this breakdown, follow for more clean, structured setups with discipline at the core.”
🚀 Stay Calm. Stay Clean. Trade With Patience.
Trade Smart | Learn Zones | Be Self-Reliant 📊
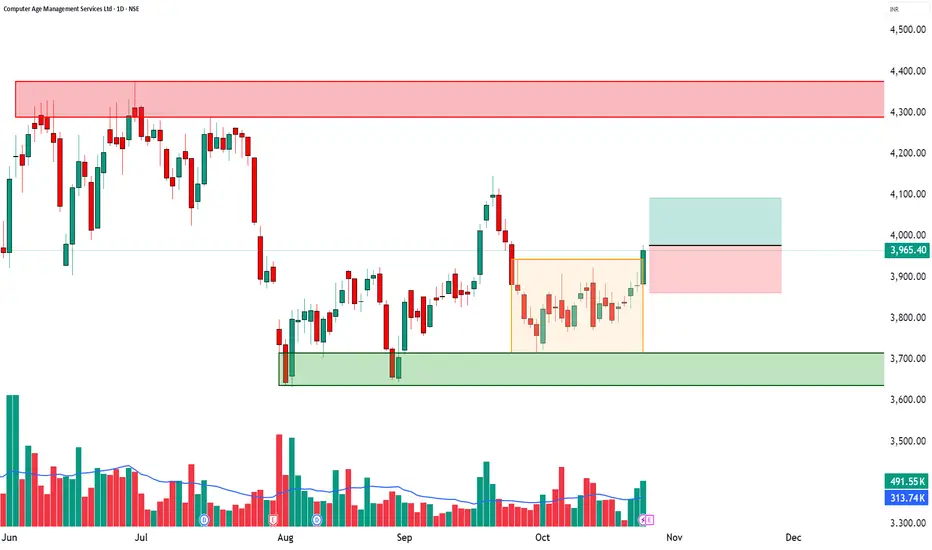
CAMS | Bullish Breakout + RSI Surge + High Volume📈 CAMS | Bullish Breakout + RSI Surge + High Volume Confirmation 🚀
🔹 Entry Zone: ₹3,965.40 – ₹3,977.80
🔹 Stop Loss: ₹3,862.45 (Risk ~115 pts)
🔹 Supports: 3,905.67 / 3,845.93 / 3,809.87
🔹 Resistances: 4,001.47 / 4,037.53 / 4,097.27
🔹 Swing Demand Zone: ₹3,815.50 – ₹3,789.90
🔹 Intraday Demand Zone: ₹3,885.70 – ₹3,877.00 | ₹3,875.90 – ₹3,868.10
🔑 Key Highlights
✅ Strong Bullish Candle – powerful continuation signal backed by strong volume
✅ RSI Breakout – confirms renewed buying momentum
✅ Bollinger Band Expansion – volatility breakout underway
✅ VWAP Alignment – sustained buyer dominance across sessions
✅ Volume Surge (1.57x avg) – active institutional participation
🎯 STWP Trade View
📊 Momentum favors a short-term bullish continuation. A close above ₹4,001 could extend the rally toward ₹4,037–₹4,097 zones.
⚠️ The ₹3,885–₹3,868 range offers intraday demand, while ₹3,815–₹3,789 serves as the swing demand base for positional traders.
💡 Learning Note
This setup combines RSI breakout + VWAP alignment + high volume — a potent trio for identifying momentum-backed bullish reversals. Traders can use intraday zones for tactical entries with clear stop placement.
Final Outlook: Momentum: Strong | Trend: Bullish | Risk: Low | Volume: High
________________________________________
________________________________________
⚠️ Disclosure & Disclaimer – Please Read Carefully
The information shared here is meant purely for learning and awareness. It is not a buy or sell recommendation and should not be taken as investment advice. I am not a SEBI-registered investment adviser, and all views expressed are based on personal study, chart patterns, and publicly available market data.
Trading—whether in stocks or options—carries risk. Markets can move unexpectedly, and losses can sometimes exceed the money you have invested. Past performance or past setups do not guarantee future results.
If you are a beginner, treat this as a guide to understand how the market works and practice on paper trades before risking real money. If you are experienced, always assess your own risk, position sizing, and strategy suitability before entering trades.
Consult a SEBI-registered financial adviser before making any real trading decision. By engaging with this content, you acknowledge full responsibility for your trades and investments.
Position Status: No active position in CAMS at the time of analysis.
Data Source: TradingView & NSE India (Past Chart Reference) (Historical levels)
💬 Found this useful?
🔼 Give this post a Boost to help more traders discover clean, structured learning.
✍️ Drop your thoughts, questions, or setups in the comments — let’s grow together!
🔁 Share with fellow traders and beginners to spread awareness.
👉 “If you liked this breakdown, follow for more clean, structured setups with discipline at the core.”
🚀 Stay Calm. Stay Clean. Trade With Patience.
Trade Smart | Learn Zones | Be Self-Reliant 📊
NUVAMA | Bullish Engulfing + VWAP Alignment📈 NUVAMA | Bullish Engulfing + VWAP Alignment + Strong Momentum Reversal 🚀
🔹 Entry Zone: ₹7,420.50 – ₹7,436.00
🔹 Stop Loss: ₹7,151.90 (Risk ~284 pts)
🔹 Supports: 7,244.33 / 7,068.17 / 6,972.33
🔹 Resistances: 7,516.33 / 7,612.17 / 7,788.33
🔹 Swing Demand Zone: ₹7,086 – ₹6,998.50
🔹 Intraday Demand Zone: ₹7,253.50 – ₹7,223
🔑 Key Highlights
✅ Bullish Engulfing Candle – powerful reversal confirmation
✅ VWAP Alignment – institutional bias turning bullish
✅ Momentum Strength – bullish follow-up after base formation
✅ Bollinger Squeeze-Off – volatility expansion expected
✅ Volume near average – healthy buyer participation, stable accumulation
🎯 STWP Trade View
📊 Strong bullish momentum supports a near-term rally toward ₹7,516–₹7,612. Sustaining above ₹7,612 could open upside potential to ₹7,788.
⚠️ The ₹7,253–₹7,223 zone provides intraday support, while ₹7,190–₹7,165 acts as a swing base for positional buyers to watch.
💡 Learning Note
This setup demonstrates how a Bullish Engulfing pattern with VWAP confirmation offers a reliable multi-signal entry. When aligned with tight demand zones, it allows traders to manage risk effectively while capitalizing on short-term breakouts.
Final Outlook: Momentum: Strong, Trend: Bullish, Risk: Low, Volume: High
________________________________________
________________________________________
⚠️ Disclosure & Disclaimer – Please Read Carefully
The information shared here is meant purely for learning and awareness. It is not a buy or sell recommendation and should not be taken as investment advice. I am not a SEBI-registered investment adviser, and all views expressed are based on personal study, chart patterns, and publicly available market data.
Trading—whether in stocks or options—carries risk. Markets can move unexpectedly, and losses can sometimes exceed the money you have invested. Past performance or past setups do not guarantee future results.
If you are a beginner, treat this as a guide to understand how the market works and practice on paper trades before risking real money. If you are experienced, always assess your own risk, position sizing, and strategy suitability before entering trades.
Consult a SEBI-registered financial adviser before making any real trading decision. By engaging with this content, you acknowledge full responsibility for your trades and investments.
Position Status: No active position in NUVAMA at the time of analysis.
Data Source: TradingView & NSE India (Past Chart Reference) (Historical levels)
💬 Found this useful?
🔼 Give this post a Boost to help more traders discover clean, structured learning.
✍️ Drop your thoughts, questions, or setups in the comments — let’s grow together!
🔁 Share with fellow traders and beginners to spread awareness.
👉 “If you liked this breakdown, follow for more clean, structured setups with discipline at the core.”
🚀 Stay Calm. Stay Clean. Trade With Patience.
Trade Smart | Learn Zones | Be Self-Reliant 📊

MCX | Strong Bullish Candle + VWAP Alignment + Swing Reversal Se📈 MCX | Strong Bullish Candle + VWAP Alignment + Swing Reversal Setup 🚀
🔹 Entry Zone: ₹9,305.50 – ₹9,335.00
🔹 Stop Loss: ₹8,962.50 (Risk ~343 pts)
🔹 Supports: 9,081 / 8,856.50 / 8,729.50
🔹 Resistances: 9,432.50 / 9,559.50 / 9,784.00
🔹 Swing Demand Zone: ₹7,880 – ₹7,725.50
🔹 Intraday Demand Zone: ₹9,052 – ₹8,975.50
🔑 Key Highlights
✅ Strong Bullish Candle signaling buyer dominance and swing reversal
✅ Bullish VWAP Alignment confirming upward control by buyers
✅ RSI improving from oversold region, supporting reversal momentum
✅ Bollinger Squeeze-Off indicating volatility expansion likely
✅ Volume near average levels – potential for fresh accumulation on breakout
🎯 STWP Trade View
📊 Momentum supports a bullish continuation if price sustains above ₹9,432. A breakout beyond ₹9,560 can extend the rally toward ₹9,784.
⚠️ The ₹9,052–₹8,975 zone offers intraday support, while ₹7,880–₹7,725 remains the long-term swing accumulation area for positional traders.
💡 Learning Note
This setup highlights how VWAP alignment with a strong bullish candle near demand zones acts as a multi-layer confirmation of trend reversal. Watching for volume pickup near resistances helps validate institutional buying strength.
Final Outlook: Momentum: Strong, Trend: Bullish, Risk: Low, Volume: High
________________________________________
________________________________________
⚠️ Disclosure & Disclaimer – Please Read Carefully
The information shared here is meant purely for learning and awareness. It is not a buy or sell recommendation and should not be taken as investment advice. I am not a SEBI-registered investment adviser, and all views expressed are based on personal study, chart patterns, and publicly available market data.
Trading—whether in stocks or options—carries risk. Markets can move unexpectedly, and losses can sometimes exceed the money you have invested. Past performance or past setups do not guarantee future results.
If you are a beginner, treat this as a guide to understand how the market works and practice on paper trades before risking real money. If you are experienced, always assess your own risk, position sizing, and strategy suitability before entering trades.
Consult a SEBI-registered financial adviser before making any real trading decision. By engaging with this content, you acknowledge full responsibility for your trades and investments.
Position Status: No active position in MCX at the time of analysis.
Data Source: TradingView & NSE India (Past Chart Reference) (Historical levels)
💬 Found this useful?
🔼 Give this post a Boost to help more traders discover clean, structured learning.
✍️ Drop your thoughts, questions, or setups in the comments — let’s grow together!
🔁 Share with fellow traders and beginners to spread awareness.
👉 “If you liked this breakdown, follow for more clean, structured setups with discipline at the core.”
🚀 Stay Calm. Stay Clean. Trade With Patience.
Trade Smart | Learn Zones | Be Self-Reliant 📊

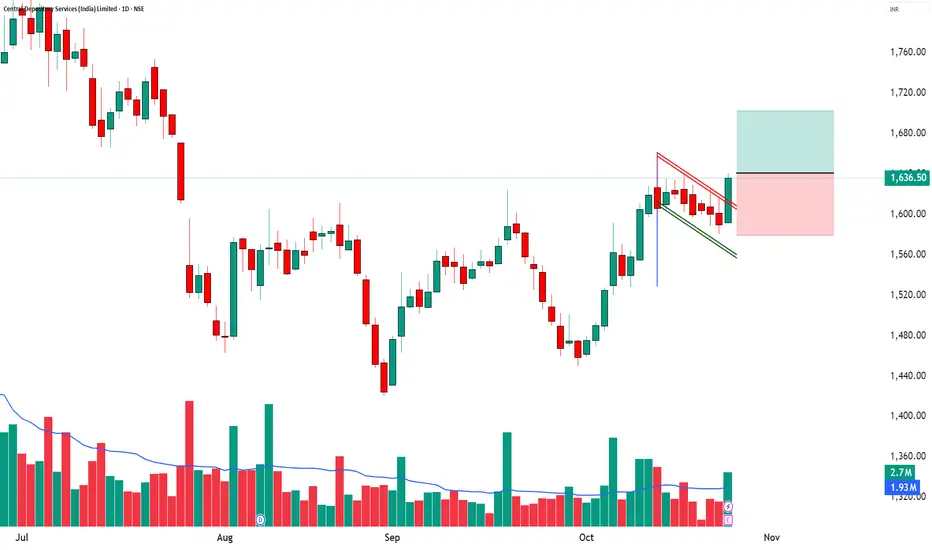
CDSL | Bullish Marubozu + RSI Breakout + Volume Expansion📈 CDSL | Bullish Marubozu + RSI Breakout + Volume Expansion 🚀
🔹 Entry Zone: ₹1,636.50 – ₹1,641.00
🔹 Stop Loss: ₹1,579.25 (Risk ~61 pts)
🔹 Supports: 1,605.33 / 1,574.17 / 1,556.33
🔹 Resistances: 1,654.33 / 1,672.17 / 1,703.33
🔹 Swing Demand Zone: ₹1,593.40 – ₹1,581.00
🔹 Intraday Demand Zone: ₹1,593.40 – ₹1,588.00
🔑 Key Highlights
✅ Bullish Marubozu Candle – clear sign of buyer dominance
✅ RSI Breakout – momentum strength confirmation
✅ Volume Surge (1.4x avg) – strong institutional participation
✅ Bollinger Squeeze-Off – breakout + volatility expansion expected
✅ VWAP Alignment – price sustaining above average buyer level
🎯 STWP Trade View
📊 Momentum supports a short-term bullish continuation. A decisive close above ₹1,654 may open the path toward ₹1,672–₹1,703.
⚠️ The ₹1,605–₹1,574 zone offers positional strength, while ₹1,593–₹1,588 acts as an intraday demand pocket for re-entry or dip-buying opportunities.
💡 Learning Note
This setup shows how combining price action (Marubozu) with RSI breakout and volume confirmation enhances conviction. Identifying multi-timeframe demand zones allows traders to plan entries with better precision and controlled risk.
Final Outlook: Momentum: Strong, Trend: Bullish, Risk: Low, Volume: High
________________________________________
________________________________________
⚠️ Disclosure & Disclaimer – Please Read Carefully
The information shared here is meant purely for learning and awareness. It is not a buy or sell recommendation and should not be taken as investment advice. I am not a SEBI-registered investment adviser, and all views expressed are based on personal study, chart patterns, and publicly available market data.
Trading—whether in stocks or options—carries risk. Markets can move unexpectedly, and losses can sometimes exceed the money you have invested. Past performance or past setups do not guarantee future results.
If you are a beginner, treat this as a guide to understand how the market works and practice on paper trades before risking real money. If you are experienced, always assess your own risk, position sizing, and strategy suitability before entering trades.
Consult a SEBI-registered financial adviser before making any real trading decision. By engaging with this content, you acknowledge full responsibility for your trades and investments.
Position Status: No active position in CDSL at the time of analysis.
Data Source: TradingView & NSE India (Past Chart Reference) (Historical levels)
💬 Found this useful?
🔼 Give this post a Boost to help more traders discover clean, structured learning.
✍️ Drop your thoughts, questions, or setups in the comments — let’s grow together!
🔁 Share with fellow traders and beginners to spread awareness.
👉 “If you liked this breakdown, follow for more clean, structured setups with discipline at the core.”
🚀 Stay Calm. Stay Clean. Trade With Patience.
Trade Smart | Learn Zones | Be Self-Reliant 📊
#NIFTY Intraday Support and Resistance Levels - 27/10/2025Nifty is expected to open flat near the 25,780–25,800 zone, showing signs of early stabilization after the recent decline. The market continues to trade within a consolidation range, and today’s session will be crucial to determine if a short-term reversal or continuation of the downtrend unfolds.
If Nifty holds above 25,780–25,800, we could see an upward move toward 25,850, 25,900, and 25,950+ levels. Sustaining above 25,950 may attract buying interest and extend the rally toward 26,050 and 26,150 zones.
On the downside, immediate support lies near 25,750–25,700. A breakdown below this zone could invite fresh selling pressure, dragging the index toward 25,600 and 25,500 levels.
Overall, a flat opening suggests a neutral start with balanced sentiment. Traders should focus on 25,780 as the pivot level, waiting for a clear breakout or breakdown before entering. Maintaining tight stop losses and booking partial profits near key resistance levels is advisable in this range-bound market.
[INTRADAY] #BANKNIFTY PE & CE Levels(27/10/2025)Bank Nifty is likely to open flat to slightly positive near the 57,700–57,750 zone, showing early signs of recovery after a sharp decline in recent sessions. The index is attempting to stabilize around a crucial support zone, with intraday direction likely to be decided by the 57,750–57,800 range.
If Bank Nifty sustains above 57,750–57,800, it may extend the upside move toward 57,950, 58,050, and 58,350+ levels. A breakout above 58,050 could further strengthen the short-term bullish momentum and invite follow-up buying.
On the downside, immediate support lies near 57,600–57,550. A breakdown below 57,450 may trigger renewed selling pressure, dragging the index toward 57,250, 57,150, and 57,050–57,000 zones.
Overall, with a flat opening, the market may witness initial consolidation before a directional move. Traders are advised to watch 57,750 as the key pivot level, follow breakout confirmation for intraday entries, and maintain a strict stop loss to manage volatility effectively.
