[INTRADAY] #BANKNIFTY PE & CE Levels(20/10/2025)Bank Nifty is likely to open with a gap up above the 58,000 zone, indicating continued bullish sentiment and follow-through momentum from last week’s rally. The index is consolidating near a breakout area, suggesting that buyers are still in control, but a decisive move above resistance is needed for further strength.
If Bank Nifty sustains above 58,050–58,100, it may trigger an upside rally toward 58,250, 58,350, and 58,450+ levels. A breakout above 58,550–58,600 will add fresh momentum, opening the path toward 58,750, 58,850, and 58,950+ zones.
On the downside, immediate support is placed near 57,750–57,700. A fall below this level could invite short-term profit booking, dragging the index toward 57,650, 57,550, and 57,450 levels.
Overall, the sentiment remains positive with a gap up opening expected above 58,000, but traders should watch for sustained buying above 58,100 to confirm bullish continuation. Maintaining a trailing stop loss and booking partial profits at key resistance levels is advised to protect gains in case of intraday reversals.
Technical Analysis

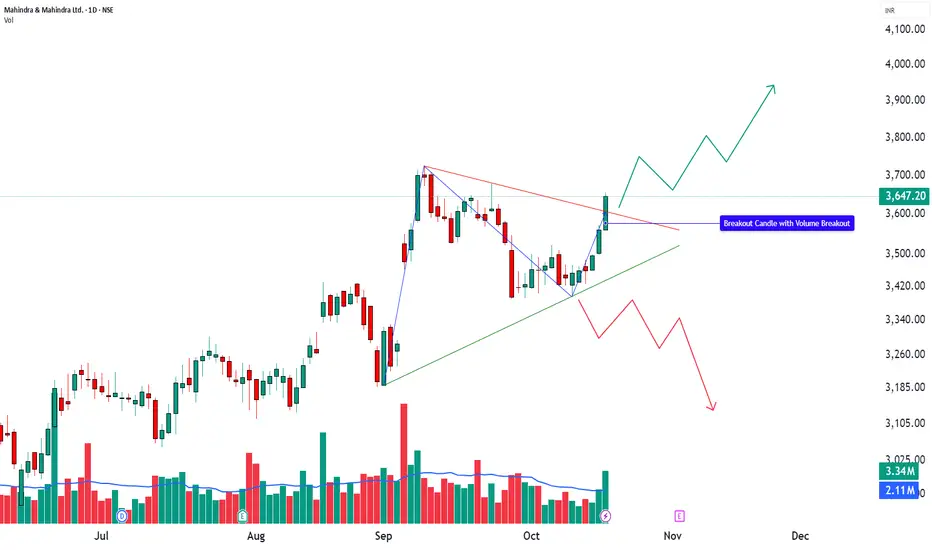
M&M Breaks Out with Volume Support | Structure Meets Momentum________________________________________
🚙 MAHINDRA & MAHINDRA LTD (NSE: M&M) | CMP ₹3,647.20 (+2.43%)
Sector: Auto | Date: 19 Oct 2025
________________________________________
🔹 Price Action:
M&M posted a strong bullish candle, closing near day’s high at ₹3,647.20 with gains of +2.43%.
Volume surged to 3.34M shares, nearly 2.2× the 20-day average volume (2.10M) — a clear sign of institutional and HNI participation.
The stock confirmed a bullish breakout above ₹3,656, marking a shift from a phase of consolidation to one of expansion.
________________________________________
🔹 Technical Analysis:
Momentum indicators are clearly aligned in favour of the bulls, confirming strength across multiple parameters. RSI (65.55) has broken above its midline, signalling momentum expansion, while MACD (9) shows a positive crossover that reinforces directional conviction. CCI (129.03) reflects sustained trend acceleration, and though Stochastic (96.65) remains in overbought territory, it supports ongoing breakout momentum. The VWAP at ₹3,629.84 acts as an immediate dynamic support, maintaining short-term control with buyers. Additionally, a Bollinger Band breakout accompanied by a BBSqueeze-Off indicates expanding volatility — often a precursor to a strong continuation phase when combined with rising volume and structural breakout confirmation.
________________________________________
🔹 Chart Analysis:
M&M broke out from a symmetrical triangle structure, ending a multi-week consolidation phase.
The breakout candle formed with a wide body and heavy volume, closing near the high — a typical sign of breakout conviction.
Price structure shows higher lows and rising volume, confirming trend continuation rather than exhaustion.
________________________________________
🔹 Key Levels:
Resistance: 3,682 / 3,717 / 3,778
Support: 3,586 / 3,525 / 3,490
VWAP: 3,629.84
A short-term pullback toward VWAP or ₹3,586 could act as a healthy retest before continuation.
Holding above ₹3,525 will keep the structure intact, maintaining bullish control.
________________________________________
🔹 STWP Trade Analysis:
Bias: Bullish
Breakout Level: ₹3,656
Intraday Support: ₹3,619
Swing Support: ₹3,456
Intermediate Support: ₹3,421
Momentum: Strong
Trend: Bullish
Risk: Low
Volume: High
📌 Observation: The breakout candle supported by rising volume and MACD confirmation signals a trend continuation setup with clearly defined risk zones.
________________________________________
🔹 HNI Trade Setup:
Fresh HNI accumulation seen around ₹3,647–₹3,656, supported at ₹3,501, and additional buying interest visible near ₹3,639 with support at ₹3,475.
This structure indicates layered accumulation, suggesting that larger players are positioning within the consolidation rather than chasing price above resistance.
________________________________________
🔹 Final Outlook:
Momentum: Strong | Trend: Bullish | Risk: Low | Volume: High
M&M’s structure indicates a breakout-driven continuation phase backed by volume and indicator alignment.
As long as price holds above ₹3,525, the trend bias remains bullish, with scope for upside toward ₹3,717–₹3,778 in the near term.
A dip toward VWAP or EMA supports would represent healthy price normalization, not weakness.
________________________________________
🔹 Learning Note (Educational Purpose):
This setup showcases how volume + structure + indicator confluence confirms a genuine breakout.
It also demonstrates how smart money accumulates during compression, not after expansion — a crucial lesson for breakout traders.
M&M provides a textbook example of how post-consolidation breakouts evolve into expansion phases.
________________________________________
🔹 STWP Mentor Note:
“Momentum isn’t about chasing; it’s about recognizing conviction early.
M&M’s breakout is a fine example of structure, participation, and patience working in perfect rhythm — where price doesn’t just move, it evolves with purpose.”
________________________________________
───────────────────────────────────────────────
⚠️ **DISCLOSURE & DISCLAIMER (SEBI-Compliant)**
───────────────────────────────────────────────
📘 **Purpose:**
This content is created **solely for educational and informational purposes** to help readers understand market structure, price action, and technical analysis.
It does **not constitute investment advice**, research recommendation, or a solicitation to buy or sell any security.
👤 **Author Disclosure:**
The author is **not a SEBI-registered investment adviser or research analyst.**
All chart studies, price levels, and observations are based on publicly available data (e.g., **NSE India**, **TradingView**) and are presented purely for **learning illustration**.
📊 **Position Status:**
No active position in * * at the time of publication.
“The author may sometimes trade in the securities discussed, but such trades are independent and shared here only for educational understanding.”
⚠️ **Risk Disclosure:**
Trading and investing involve financial risk. Market movements can be unpredictable, and losses may exceed invested capital.
Readers are strongly advised to consult a **SEBI-registered investment adviser** before making any trading or investment decisions.
🧠 **Responsibility Clause:**
By engaging with this post, you acknowledge that you are **solely responsible for your own trading or investment decisions**, and that this content is intended only for **market education and awareness**.
───────────────────────────────────────────────
💬 **Did You Find This Useful?**
If this analysis helped you understand price structure or market psychology better:
🔼 **Boost** to support transparent & structured financial education.
✍️ **Comment** your insights, observations, or questions — let’s learn together.
🔁 **Share** this post with learners and aspiring traders who value discipline.
📚 **Follow @STWP** for more structured, educational breakdowns on stocks & setups.
🚀 *Stay Calm. Stay Clean. Trade With Patience.*
💡 *Trade Smart | Learn Zones | Be Self-Reliant.*
───────────────────────────────────────────────
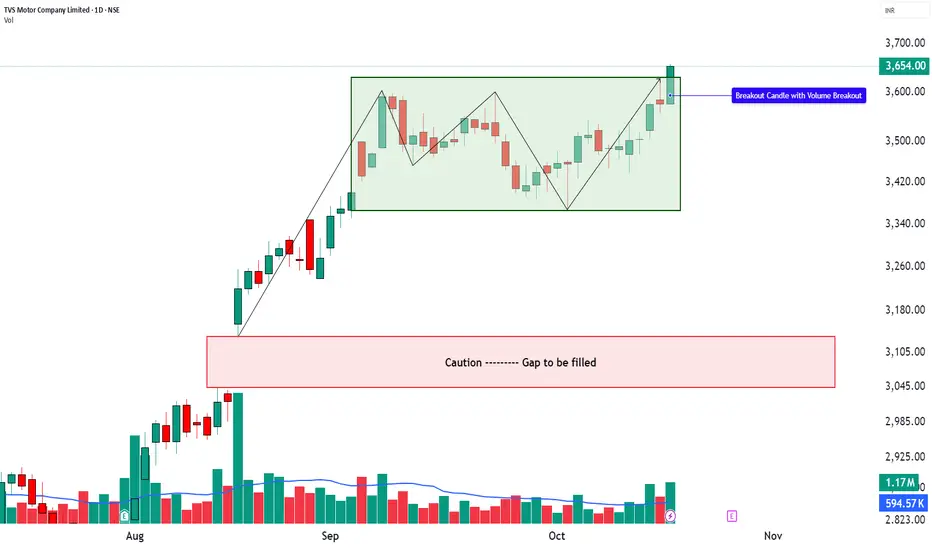
TVS Motor | 52-Week Breakout Case Study________________________________________
🏍️ TVS MOTOR (NSE: TVSMOTOR) | CMP 3,658.00
Sector: Auto & 2-Wheeler | Date: 19 Oct 2025
________________________________________
📊 Chart Summary
TVS Motor has delivered a 52-week breakout with a strong bullish Marubozu candle, signalling aggressive buying momentum.
The stock closed firmly near day’s high, reinforcing confidence among participants.
This move comes after a sustained consolidation phase, with volumes spiking well above the short-term average — confirming institutional and HNI participation around the 3,650 zone.
Structurally, the stock is transitioning from a Consolidation Phase into an Expansion Phase, marking the possible beginning of a fresh markup leg.
________________________________________
🟡 Technical Indicators Summary
The chart highlights Bullish Momentum supported by a Strong Bullish Marubozu, indicating conviction among buyers.
A clear RSI breakout (76) confirms strengthening momentum, while the Bollinger Band breakout and BBSqueeze-Off suggest volatility expansion — often preceding strong directional moves.
MACD at 5.54 shows a positive crossover, CCI 205.96 signals extended strength, and Stochastic 98.62 confirms short-term over-extension yet strong momentum.
VWAP support at 3,639.46 keeps intraday trend structure intact.
This confluence reflects multi-indicator alignment — the kind of structure often seen in sustained breakout phases.
________________________________________
📈 Price Action & Key Levels
Resistance: 3683 / 3712 / 3765
Support: 3600 / 3547 / 3518
VWAP: 3639.46
The breakout occurred above 3,658, which now acts as a pivot zone.
Sustaining above this level could keep momentum active, whereas any dip toward VWAP or ₹3,600 may offer short-term retest potential.
________________________________________
🧭 STWP Trade Analysis
Bias: Bullish
Breakout Level: Above 3658
Intraday Support: 3626
Swing Support: 3501
Intermediate Support: 3274
Momentum: Moderate
Trend: Neutral (Turning Bullish)
Risk: Low
Volume: High
📌 Observation: The strong candle structure backed by volume and RSI expansion suggests continued bullish sentiment.
A possible HNI setup was visible near 3654–3658 with support at 3518, while a lower build-up setup is also seen near 3647 with support at 3493 — confirming tiered accumulation.
________________________________________
🧭 STWP Note – Gap-Up Retest Zone
If TVS Motor opens gap-up above ₹3,658, key pullback levels to watch are ₹3,639 (VWAP), ₹3,547 (EMA support), and ₹3,443 (0.786 Fibonacci level). A mild, low-volume pullback toward these zones would represent a healthy retest within the ongoing expansion phase. The breakout remains valid and momentum bullish as long as price holds above ₹3,443.
________________________________________
📘 Learning Perspective (Educational Insight)
TVS Motor’s setup illustrates how multiple bullish confirmations (RSI breakout, MACD crossover, BB expansion, and VWAP strength) can align during a 52-week breakout phase.
The pattern teaches traders to spot volume-backed momentum near higher-timeframe resistance zones — a sign that larger players may be entering.
________________________________________
🧩 Final Outlook
TVS Motor currently displays:
Momentum: Moderate
Trend: Neutral turning Bullish
Risk: Low
Volume: High
While KST remains mildly bearish (34.45), the overall setup hints at a momentum continuation phase, provided the stock sustains above 3626–3600 levels.
Traders should watch price action around 3,683–3,712 for confirmation of follow-through strength.
________________________________________
💬 STWP Mentor Note
When multiple indicators speak in one direction — price, volume, and structure often follow. Watch how VWAP and RSI behave in the next few sessions; that’s where breakout traders can learn the art of patience and precision.
________________________________________
⚠️ Disclosure & Disclaimer (SEBI-Compliant)
This content is created solely for educational and informational purposes to help readers understand technical analysis and market structure.
It does not constitute investment advice, research recommendation, or a solicitation to buy or sell any security.
The author is not a SEBI-registered investment adviser or research analyst.
All charts, patterns, and levels are based on personal study and historical data available from public sources such as TradingView and NSE India.
Position Status: No active position in TVSMOTOR at the time of publication.
Trading and investing involve risk. Market movements can be unpredictable, and losses may exceed invested capital.
Readers are strongly advised to consult a SEBI-registered investment adviser before making any trading or investment decisions.
By engaging with this post, you acknowledge that you take full responsibility for your own trades, decisions, and outcomes.
________________________________________
💬 Found this useful?
🔼 Boost this post to support structured learning content.
✍️ Share your thoughts, questions, or observations — let’s grow together!
🔁 Share with learners and traders to promote responsible market education.
👉 “If you liked this breakdown, follow for more disciplined, educational trade setups.”
🚀 Stay Calm. Stay Clean. Trade With Patience.
Trade Smart | Learn Zones | Be Self-Reliant 📊
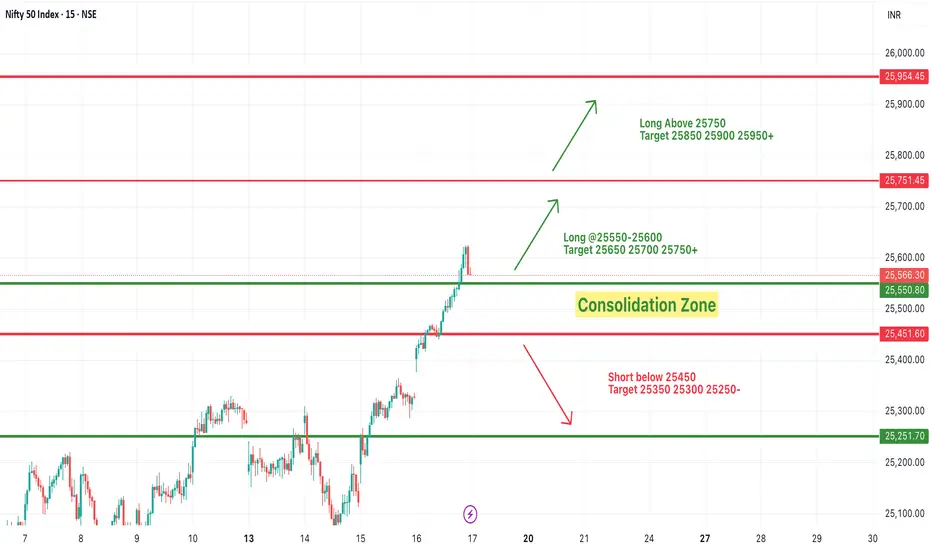
#NIFTY Intraday Support and Resistance Levels - 17/10/2025Nifty is likely to open with a gap up near the 25,550–25,600 zone, continuing the strong bullish momentum from the previous session. The index has broken out of its recent consolidation zone, indicating buyer strength and potential continuation toward higher levels.
If Nifty sustains above 25,600–25,650, we may witness a further rally toward 25,700, 25,750, and 25,850+ levels. A breakout above 25,750 will further strengthen the bullish trend, opening the path toward 25,900–25,950+.
On the downside, immediate support lies near 25,450–25,400. A drop below this zone could lead to a mild retracement toward 25,350, 25,300, and 25,250 levels.
Overall, the sentiment remains strongly bullish with a gap up opening, but traders should stay alert near upper resistance zones as short-term profit booking may occur. Maintaining a trailing stop loss and booking partial profits at key targets is advisable to safeguard gains.
[INTRADAY] #BANKNIFTY PE & CE Levels(17/10/2025)Bank Nifty is likely to open with a gap up near the 57,400–57,450 zone, indicating continued bullish momentum from the previous session. The index is approaching a crucial resistance area, and today’s price action will determine whether bulls can extend control or if a short-term pullback emerges.
If Bank Nifty sustains above 57,550–57,600, we may witness a further rally toward 57,750, 57,850, and 57,950+. A breakout above 58,000 will confirm strong bullish momentum, opening the path for higher upside levels.
On the downside, immediate support lies near 57,400–57,350. A fall below this zone could lead to a mild correction toward 57,250, 57,150, and 57,050 levels.
Overall, the sentiment remains positive with a gap up opening, but traders should stay cautious around the 57,550–57,600 resistance zone, where some profit booking may occur. Maintaining a trailing stop loss and booking partial profits at key levels is recommended to safeguard gains in case of intraday reversals.

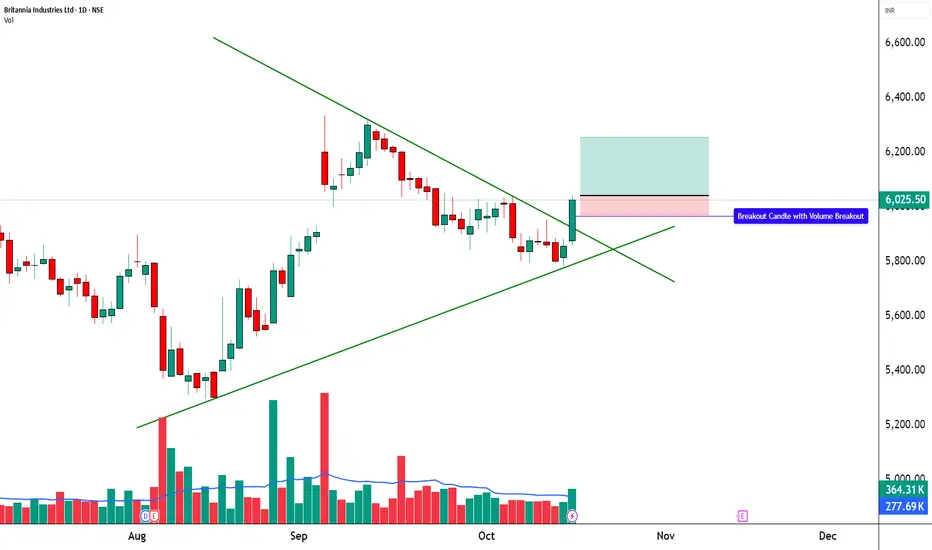
Britannia - Smart Money Accumulation | Falling Channel Breakout________________________________________
🍪 BRITANNIA INDUSTRIES LTD
Ticker: NSE: BRITANNIA | Sector: FMCG | CMP: 6,025.50 | Rating: ⚡️ Bullish Bias Emerging
________________________________________
🧭 Chart Summary
This chart of Britannia Industries Ltd (NSE) highlights a bullish breakout from a falling channel pattern after a prolonged period of controlled decline and consolidation.
The stock closed near 6,025.50, up +2.87%, forming a strong green candle backed by solid volume, signalling renewed buying strength.
The breakout above the channel’s upper trendline suggests a potential reversal of the short-term downtrend and the beginning of a new upward leg.
________________________________________
🟡 Technical Indicators Summary
The chart highlights bullish momentum supported by a strong bullish candle, indicating renewed buying interest.
A clear RSI breakout confirms strengthening momentum, while the Bollinger Band Squeeze-On Compression suggests volatility had tightened — often a precursor to a sharp directional move.
The recent liquidity sweep below key support appears to have trapped weak hands, fuelling this sharp rebound. Altogether, this setup reflects a bullish breakout zone where multiple indicators align in favour of buyers.
________________________________________
📊 Multi-Timeframe Trend View
The trend matrix shows 5m, 15m, 1H, 1W, and 1M all turning green (uptrend).
The daily is the only timeframe yet to flip, suggesting momentum is building and a daily trend alignment could soon confirm a broader upmove.
________________________________________
📈 Indicator Overview
RSI (56.9): Indicates moderate bullish strength — momentum is picking up.
MACD (-11.07): Still slightly negative but flattening, hinting at an upcoming bullish crossover.
CCI (27.3): Recovering from oversold territory, confirming a trend shift attempt.
Stochastic (94.2): Overbought zone — reflects strong short-term momentum, though minor pauses may occur.
________________________________________
🧩 Market Context
This pattern represents accumulation under resistance, commonly seen before strong breakouts in large-cap defensive stocks.
Given Britannia’s FMCG positioning, the move may also tie into a sector rotation play, as investors gravitate toward defensive sectors amid volatility in the broader markets.
________________________________________
💹 STWP Trade Analysis
Bullish Breakout Level: 6,041
Support Structure:
Intraday Support: 5,970 → Minor retest zone
Swing Support: 5,852 → Major trend-defining level
Intermediate Support: 5,776 → Key positional base
Key Levels (Subject to Daily Change):
Support: 5,909 / 5,792 / 5,726
Resistance: 6,091 / 6,157 / 6,274
________________________________________
🎓 STWP Learning
A falling channel breakout often signals that selling pressure has gradually weakened and smart money has started accumulating at lower levels.
When this pattern combines with rising volume and momentum indicators turning positive, it reflects a shift from distribution to accumulation.
Traders should note that confirmation above the breakout zone — ideally supported by volume — adds conviction to the move and reduces the risk of a false breakout.
________________________________________
⚠️ Disclosure & Disclaimer (SEBI-Compliant)
This content is created solely for educational and informational purposes to help readers understand technical analysis and market structure.
It does not constitute investment advice, research recommendation, or a solicitation to buy or sell any security.
The author is not a SEBI-registered investment adviser or research analyst.
All charts, patterns, and levels are based on personal study and historical data available from public sources such as TradingView and NSE India.
Position Status: No active position in BRITANNIA at the time of publication.
Trading and investing involve risk. Market movements can be unpredictable, and losses may exceed invested capital.
Readers are strongly advised to consult a SEBI-registered investment adviser before making any trading or investment decisions.
By engaging with this post, you acknowledge that you take full responsibility for your own trades, decisions, and outcomes.
________________________________________
💬 Found this useful?
🔼 Boost this post to support structured learning content.
✍️ Share your thoughts, questions, or observations — let’s grow together!
🔁 Share with learners and traders to promote responsible market education.
👉 “If you liked this breakdown, follow for more disciplined, educational trade setups.”
🚀 Stay Calm. Stay Clean. Trade With Patience.
Trade Smart | Learn Zones | Be Self-Reliant 📊
#NIFTY Intraday Support and Resistance Levels - 16/10/2025Nifty is expected to open with a gap up near the 25,320–25,350 zone, reflecting bullish sentiment and continuation of positive momentum. The index is currently trading within a consolidation zone between 25,200 and 25,550, indicating accumulation before a possible breakout.
If Nifty sustains above 25,350 and crosses 25,550 decisively, a breakout move could trigger a rally toward 25,650, 25,700, and 25,750+.
On the downside, immediate support lies near 25,250–25,200. A breakdown below 25,200 may bring weakness toward 25,100, 25,050, and 25,000-.
Overall, the sentiment is mildly bullish with a gap up opening, but traders should be cautious near 25,550 — the upper band of the consolidation. Breakout confirmation above this zone will likely lead to fresh long opportunities, while failure could result in a range-bound session.

XAUUSD // Liquidity Grab // ATH# Gold Spot / U.S. Dollar - Liquidity Analysis
Market Structure Analysis
Key Liquidity Zones Identified
The chart highlights two critical liquidity zones where significant price action is anticipated:
**Upper Liquidity Zone: $4,212 - $4,219**
This zone represents an area of accumulated buy-side liquidity, typically formed by stop-losses from short positions and buy-stop orders. The red shaded area indicates where institutional players may target for liquidity capture before potential reversals.
**Lower Liquidity Zone: $4,157 - $4,162**
This zone marks the sell-side liquidity area, where stop-losses from long positions and sell-stop orders cluster. This level serves as a potential magnet for price action seeking to capture liquidity before any significant directional move.
Technical Setup
**Channel Pattern**
Gold is currently trading within a well-defined ascending channel on the intraday timeframe. The parallel trend lines show:
- Consistent higher highs and higher lows
- Price currently positioned in the mid-range of the channel
- Recent bounce from the lower channel boundary
**Demand Zone**
A marked demand zone is visible at lower levels, indicating previous buying interest and potential support.
Price Action Scenarios
Bullish Scenario (Green Path):
If price maintains support at current levels or the lower demand zone, we could see:
1. Continuation toward the upper liquidity zone ($4,219)
2. Potential liquidity sweep above this zone
3. Possible rejection after capturing buy-side liquidity
Bearish Scenario (Red Path):
If price fails to hold current structure:
1. Drop toward the lower liquidity zone ($4,162)
2. Liquidity grab below this level
3. Potential reversal after capturing sell-side liquidity
#Liquidity Concept
The annotation "Liquidity !!!!!!" emphasizes the importance of these zones. In institutional trading theory, price often moves to areas of high liquidity (where stop-losses cluster) before making significant directional moves. This is commonly referred to as a "liquidity sweep" or "stop hunt."
Trading Considerations
When price approaches either liquidity zone, traders should watch for:
- Rejection wicks suggesting liquidity capture completion
- Break and retest patterns for confirmation
- Changes in momentum indicators
Risk Management Notes
- The 5-minute timeframe requires precise execution and tight risk management
- Liquidity zones can be quickly swept through in volatile conditions
- Always use appropriate position sizing relative to account risk tolerance
- Consider wider timeframe context for overall trend direction
Disclaimer
This analysis is provided for educational purposes only and represents a technical perspective on price structure and liquidity zones.
It is not financial advice or a recommendation to buy or sell. Gold trading involves substantial risk of loss. Always conduct your own research, use proper risk management, and consider consulting with a qualified financial advisor before making trading decisions.

Don’t Miss This Rare MCX Setup Breakout + Retest= Big Move AheadHello Traders!
Today’s analysis is on MCX Ltd., where we just spotted a powerful Descending Triangle Breakout . After weeks of consolidation, the price has finally broken the falling resistance and even retested the breakout zone. This setup often leads to a strong trending move.
Why this setup is special?
Price respected support multiple times, showing heavy demand from lower levels.
Breakout + Retest makes it one of the most reliable continuation patterns.
Risk–Reward is highly favorable for both short-term and positional traders.
Levels to Track:
Currently, the best accumulation zone lies between 8000–8155 , which gives a low-risk entry point. On the upside, the immediate short-term target is around 8446 , while the medium-term level aligns with the previous ATH near 9115 . If momentum sustains, the stock even has potential to reach the positional target of 9774 . For risk management, traders can keep a short to medium-term stop loss at 7788 , while positional traders may consider a wider SL at 7522 .
Rahul’s Tip:
Such breakouts don’t come often. Once the retest is done, the real rally usually begins. Traders who wait too long often end up chasing the move at much higher prices.
If you want to catch these setups before they take off, make sure you follow closely — (Analysis By @TraderRahulPal, TradingView Moderator). More analysis & educational content is shared regularly on my profile. Sometimes one breakout can change your trading month completely. If this helped you, don’t forget to like and follow for regular updates.
Disclaimer:
This analysis is for educational purposes only and should not be taken as financial advice. Please do your own research or consult your financial advisor before investing.

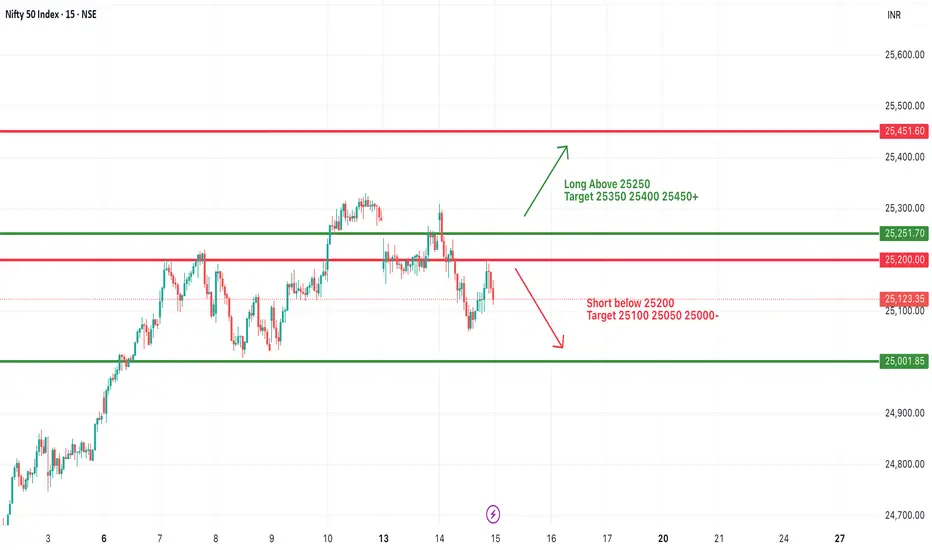
#NIFTY Intraday Support and Resistance Levels - 15/10/2025Nifty is likely to open slightly gap up near the 25,150–25,200 zone, indicating a cautious positive sentiment in the market. After recent consolidation, the index continues to trade between well-defined support and resistance levels, suggesting indecision among traders.
If Nifty sustains above 25,250, it may trigger a bullish momentum toward 25,350, 25,400, and 25,450+. A breakout above 25,450 could further strengthen the uptrend.
On the downside, a fall below 25,200 may invite selling pressure, leading the index toward 25,100, 25,050, and 25,000-.
Overall, the trend remains range-bound with a slight bullish bias. Traders should focus on breakout or breakdown confirmation before taking positions, keeping a strict stop loss and booking partial profits at each target level.
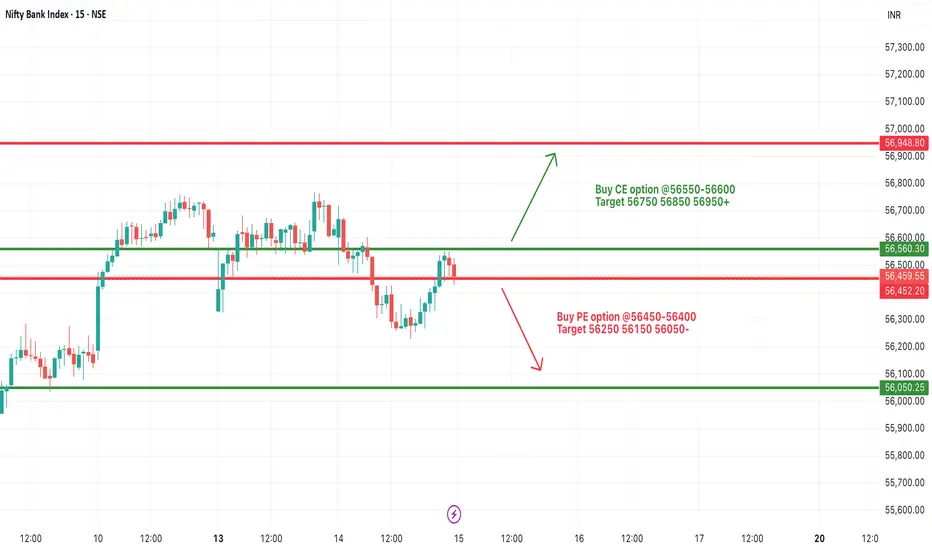
[INTRADAY] #BANKNIFTY PE & CE Levels(15/10/2025)Bank Nifty is expected to open flat near the 56,450–56,500 zone, reflecting indecision after recent range-bound sessions. The index has been oscillating within a narrow band, indicating consolidation between key support and resistance levels.
If Bank Nifty sustains above 56,550–56,600, a breakout may push the index toward 56,750, 56,850, and 56,950+. A close above 56,950 will strengthen the bullish sentiment and open the path toward 57,200+.
On the downside, support lies near 56,450–56,400. A breakdown below this zone could trigger mild selling pressure, dragging the index toward 56,250, 56,150, and 56,050-.
Overall, the trend remains neutral with slight bullish bias. Traders should wait for confirmation beyond 56,600 or below 56,400 before taking directional trades. Maintaining a strict stop loss and partial profit booking at each target is advisable due to intraday volatility.
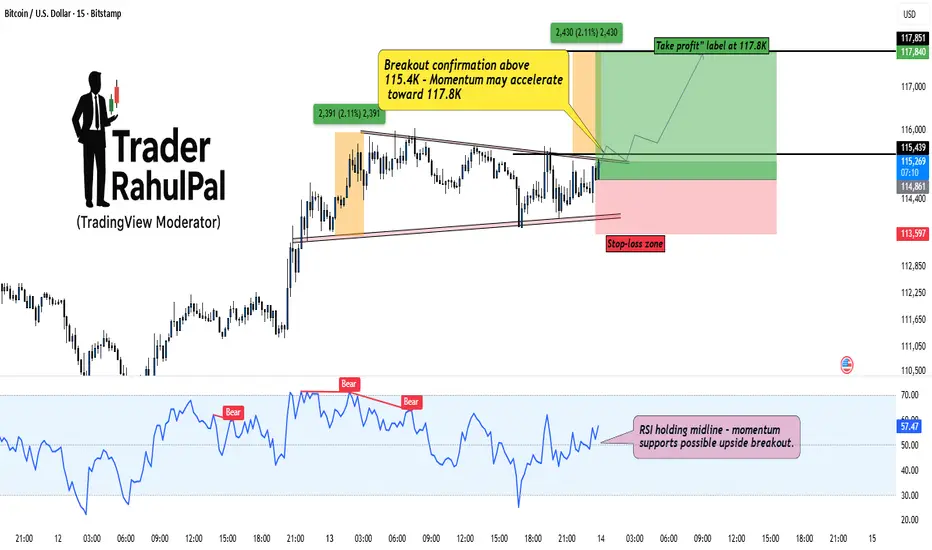
BTC – Building Discounted Longs Before the Breakout?Bitcoin (BTCUSD) is currently consolidating within a tight compression zone, showing signs of accumulation near 114.8K–115.4K . The market is coiling up right under resistance, hinting that a potential breakout could be around the corner.
As seen on the chart, structure remains bullish with a well-defined base and higher low formation. The key breakout confirmation lies above 115.4K , which could trigger a momentum push toward 117.8K , aligning with previous swing projections.
However, I’m personally building a small discounted entry position even before the confirmed breakout. The reason? When momentum starts expanding, it rarely gives clean entries, so catching early positioning near support provides better R:R potential.
RSI is holding above the midline, reflecting sustained buyer strength, while volume compression suggests a volatility expansion phase ahead. If price manages to sustain above the upper trendline, expect quick upside continuation.
Stop-loss remains below 113.6K to stay protected against fakeouts.
Rahul’s Tip:
Smart money often positions early when the crowd hesitates — timing matters, but conviction matters more.
Analysis By @TraderRahulPal (TradingView Moderator)
If this helped you spot the setup early, like and follow for more real-market insights.
Disclaimer: This analysis is for educational purposes only and should not be taken as financial advice. Please do your own research or consult your financial advisor before investing.
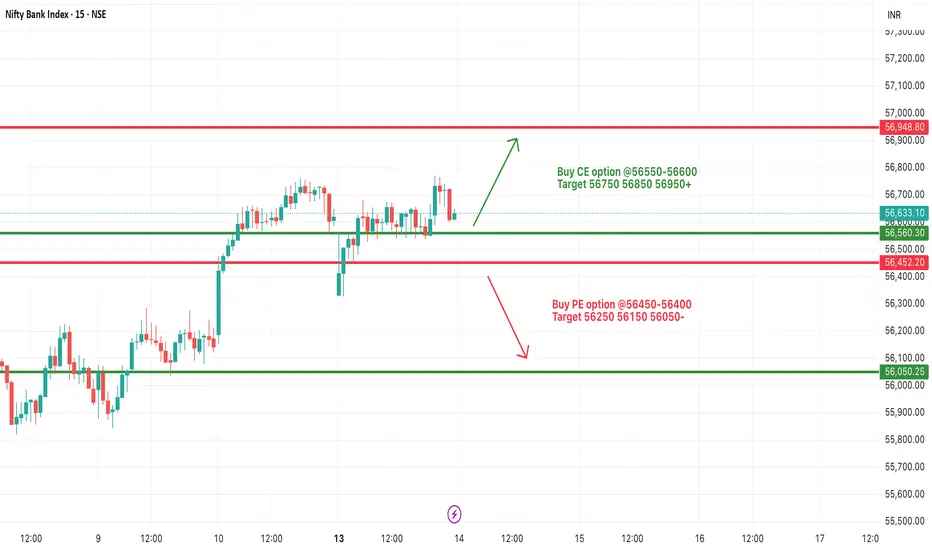
[INTRADAY] #BANKNIFTY PE & CE Levels(14/10/2025)Bank Nifty is expected to open flat around the 56,600 level, indicating a balanced start after yesterday’s range-bound movement. The index is currently consolidating within a narrow band, reflecting indecision among traders as it approaches key resistance and support zones.
If Bank Nifty sustains above 56,550–56,600, a bullish breakout may trigger a move toward 56,750, 56,850, and 56,950+. A strong close above 56,950 will confirm a continuation of the uptrend toward 57,200+.
On the downside, immediate support lies near 56,450–56,400. A breakdown below this zone could lead to mild profit-booking, taking the index lower toward 56,250, 56,150, and 56,050-.
Overall, the market sentiment remains cautiously positive with a focus on consolidation. Traders should wait for a breakout beyond 56,600 or a breakdown below 56,400 for clear intraday direction, keeping strict stop-losses in place.
Sniping the Next BUY Zone for Maximum Gains.The sentiment is clear: Bulls are running the show, preparing for potentially an eighth consecutive weekly gain. Our strategy is simple—wait for the intelligent retest to join the momentum.
🎯 THE TARGET ZONES (M30/H1)
We're focusing on the two most crucial zones derived from Fibo React Logic:
1. PRIME BUY ENTRY (The Sweet Spot):
Zone: 4018 - 4014 (Our key Fibo Retest Zone).
Action: Wait for Gold to pull back to this area. Execute a BUY (Long) only upon confirmed M30/H1 candle rejection (e.g., Bullish Engulfing/Pin Bar).
2. TAKE PROFIT TARGET (The Next Peak):
Zone: 4094 - 4098 (Fibo Extension/SELL React Zone).
Action: This is the primary TP for our Long entries, representing the next major target for the buyers.
📈 TRADING SCENARIO
Strategy: Patience is key. Let the market retrace to 4018 - 4014. Once confirmation hits, ride the wave up to 4094 - 4098.
🚨 Risk Alert:
Be disciplined with your Stop Loss. Maintain strict risk management, especially if the price fails to hold the 4018 - 4014 zone.
Let's trade with precision today!

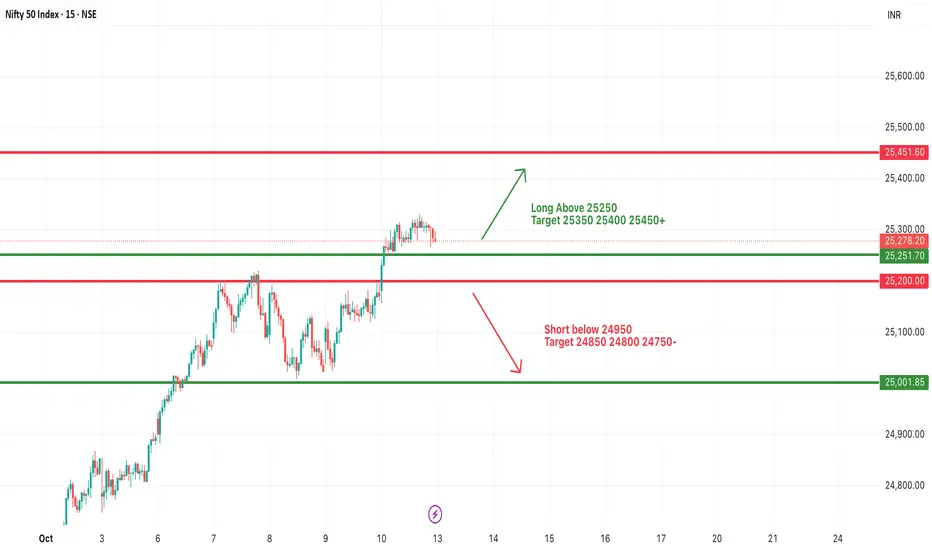
#NIFTY Intraday Support and Resistance Levels - 13/10/2025Nifty is expected to open flat around the 25,250–25,280 zone, indicating a cautious start to the session after last week’s steady uptrend. The index is currently hovering near a critical resistance area, which may determine the next directional move.
If Nifty sustains above 25,250, it could extend its bullish momentum toward 25,350, 25,400, and 25,450+. A breakout above 25,450 will likely strengthen the trend further and invite fresh buying interest.
On the downside, immediate support lies near 25,200. A breakdown below this zone could lead to mild profit booking, taking Nifty toward 25,050 and 24,950-.
Overall, the structure remains positive but slightly overextended, suggesting a possible consolidation before any strong directional move. Traders should watch for a clear breakout above 25,250 or a breakdown below 25,200 for intraday opportunities.
GOLD: The Dollar Blinks! Time to 'Pay' at the 0.618 Fibo (4018) The Macro Play: USD Retreat Sets the Stage for Gold's Counter-Attack
The precious metal is catching a bid as the US Dollar softens after hitting its recent highs. The fundamental backdrop is keeping Gold buoyant:
Fed Pivot Narrative: Despite the hawkish undertones in the last FOMC meeting minutes, the market's conviction in two potential Fed rate cuts by year-end remains a powerful tailwind, making non-yielding Gold more attractive.
Geopolitical Fog: While the short-term truce news caused a minor retreat, the overarching safe-haven demand driven by global tensions and the looming US government funding crisis provides critical floor support.
Bottom Line: Gold is navigating a choppy consolidation phase. Short-term pressure exists, but the Long-Term Macro Thesis favors a cautious recovery.
📊 The MatrixFibo PTKT: SCALP Zones Are Active!
Price action shows clear reaction points within the recent sharp move lower. Our plan is to Trade the Reactions at these high-probability confluence zones.
1️⃣ The Aggressive SELL Zone (SELL SCALP Setup)
We are looking for the market to exhaust its short-term recovery rally at major resistance levels.
Primary SELL ZONE: 3997 - 4000 (0.5 Fibo Level):
This area is critical psychological resistance and the 50% retracement of the latest impulse down.
PLAN: Await a failed breakout or clear bearish rejection signal (Pinbar, Bearish Engulfing) at 3997 - 4000.
TARGET: The move should aim to clear the lows, heading straight for 3915 - 3910.
The Ultimate SELL Reversal: 4014 - 4018 (0.618 Fibo Downtrend Zone):
This is the REACTION FIBO 0.618 DOWNTREND H1 ZONE. This level is our strongest strategic SELL point if the bounce extends deeper.
2️⃣ The Key BUY Zone (BUY SCALP Setup)
We treat this area as the final line of defense for the current uptrend structure.
Key Support & BUY SCALP REACT ZONE: 3915 - 3910:
This zone is a Major Confluence point: Key Support, the 0.786 Fibo, and the Uptrend Channel Bottom.
PLAN: Look for strong buying pressure to emerge as price tests 3915 - 3910. Requires a solid Bullish Price Action Confirmation.
TARGET: A successful bounce targets the liquidity back at 3997 - 4000.
🛑 FranCis MatrixFibo Risk Policy
Volatility Alert: Expect large swings around US data and Fed commentary. NEVER TRADE WITHOUT A HARD STOP LOSS (SL) on SCALPS.
Strategy Focus: The market is range-bound. Stick to a Two-Sided Scalping Plan defined by the identified price levels.
Discipline: Only enter trades at or with clear confirmation from the React Zones.

Bitcoin Correction = Smart Money Opportunity, ready for 3% move!Bitcoin (BTCUSDT) has been consolidating inside a well-defined descending channel , reflecting a healthy correction phase after the recent rally. While many traders panic in these phases, experienced players know that corrections are temporary, structures define direction.
Notice how price is approaching a key zone between 117K–116K, which aligns perfectly with both the lower channel boundary and the prior breakout retest zone. This area acts as a high-probability reversal zone , where strong hands are likely waiting for confirmation candles to re-enter the trend.
Psychologically, the 120K round level remains crucial. Expect volatility near this zone, as retail traders get trapped while smart money positions itself quietly before the breakout.
Once the breakout sustains above 121K, short-term traders could target levels around 122.5K–123K , while positional traders may aim for much higher structural targets.
Rahul’s Tip:
Never fear a pullback when structure stays intact, institutions use these dips to accumulate while the public exits too early. Stay patient, let the structure play out.
Analysis By @TraderRahulPal (TradingView Moderator)
If this breakdown and re-entry logic helped you, don’t forget to like and follow for regular updates.
Disclaimer: This analysis is for educational purposes only and should not be taken as financial advice. Please do your own research or consult your financial advisor before investing.

SOL | Network Strength Meets Market MomentumSolana (SOLUSDT) continues to show resilience as both technical and fundamental factors align for potential upside. On the technical side, the market has completed a controlled correction phase, suggesting liquidity buildup below recent lows. The structure remains bullish, with increasing volume and price stability hinting that buyers are regaining control. Fundamentally, Solana’s network growth and strong developer activity have reinforced investor confidence, supported by rising on-chain activity and ecosystem expansion in DeFi and NFTs. This combination of solid fundamentals and technical structure indicates the possibility of another bullish leg, with SOL positioning itself for a gradual climb toward the $240–$250 range in the near term.

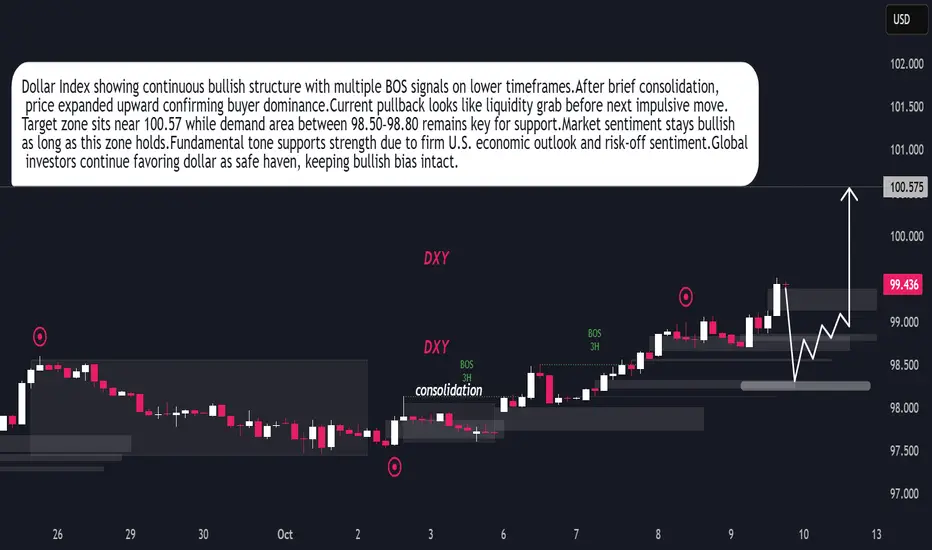
DXY Ready for Next Bullish Leg After Liquidity SweepDollar Index maintaining bullish structure after recent BOS on 3H timeframe.Market formed consolidation phase early October before expansion.Buyers showing control pushing price towards 100.57 objective.Current retracement indicates liquidity grab before next bullish impulse.Demand zone 98.50–98.80 remains key area for continuation.Technical sentiment stays positive as long as price holds above 98.50.Fundamentally, dollar supported by strong U.S. data and cautious global tone favoring safe-haven demand.Momentum outlook remains bullish with potential continuation toward 100.50+ zone.
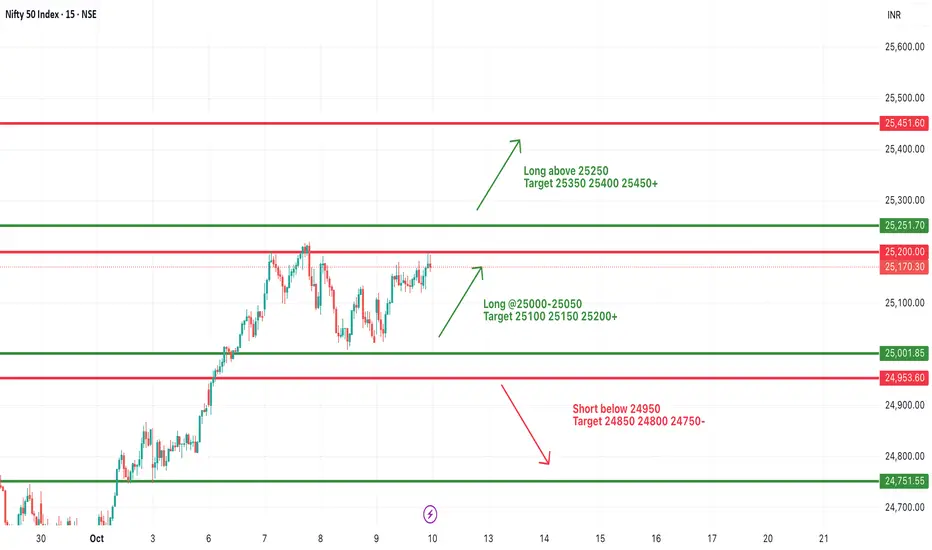
#NIFTY Intraday Support and Resistance Levels - 10/10/2025Nifty is expected to open flat around the 25,150–25,200 zone, indicating a neutral start after recent sessions of consolidation. The index is trading near a crucial resistance area, suggesting that traders may wait for a breakout before committing to fresh positions.
If Nifty sustains above 25,000–25,050, it can gradually move higher toward 25,100, 25,150, and 25,200 levels. A breakout above 25,250 will further strengthen the bullish momentum, paving the way for an extended rally toward 25,350–25,450+.
On the downside, immediate support lies near 24,950. A breakdown below this level may invite short-term selling pressure, pushing the index toward 24,850, 24,800, and 24,750-.
Overall, the sentiment remains range-bound with a slight bullish bias. Traders should wait for a confirmed move beyond 25,250 or below 24,950 for directional clarity, keeping strict stop-loss levels in place for intraday trades.
[INTRADAY] #BANKNIFTY PE & CE Levels(10/10/2025)Bank Nifty is expected to open flat to slightly positive near the 56,150 level. The index has been consolidating within a tight range between 55,950 and 56,450 over the past few sessions, indicating indecision among traders ahead of a potential breakout.
A sustained move above 56,050–56,100 could lead to further upside momentum toward 56,250, 56,350, and 56,450+. If Bank Nifty manages to break and hold above 56,550, it can open the door for a strong rally toward 56,750–56,950+.
On the downside, a slip below 55,950–55,900 may trigger selling pressure, dragging the index toward 55,750, 55,650, and 55,550-.
Overall, the short-term trend remains sideways with a slight bullish bias. A breakout above 56,450 or a breakdown below 55,950 will likely decide the next directional move. Traders should stay patient and trade only on confirmation beyond these key levels.

Bitcoin – Rising Higher, But the Real Battle Is Yet to Begin!Bitcoin continues to trade inside a rising structure , respecting both its long-term support and resistance channels. The trend remains healthy as long as price holds above the 116,000–116,500 support zone , which has been tested multiple times with strong buying reactions.
Currently, BTC is approaching a major resistance confluence zone . The chart clearly shows that every previous rejection near this zone has led to profit-booking, but this time the structure looks different, buyers are more confident, and momentum is building from the base levels .
If Bitcoin manages to sustain above the minor resistance area , the road opens towards 131,500 levels and beyond . However, traders should remember, such breakouts demand patience, not prediction. The stronger hands will always think in cycles, not candles .
The psychology of the market here is simple: every pullback to the rising support attracts accumulation by smart money , while emotional traders exit too early. This phase often separates investors from speculators.
Rahul’s Tip : Don’t fear the dips. Fear missing the structure that defines the entire bull leg. If the support holds, this could be the foundation of the next major BTC wave.
Disclaimer: This analysis is for educational purposes only and should not be taken as financial advice. Please do your own research or consult your financial advisor before investing.
Analysis By @TraderRahulPal (TradingView Moderator) | More analysis & educational content on my profile
👉 If you found this helpful, don’t forget to like and follow for regular updates.

Waree Renewable Technologies Ltd: Chart ObservationThe daily chart for Waree Renewable Technologies Ltd (NSE) highlights a period of price consolidation over 59 trading sessions (86 days), during which approximately 55.75 million shares were traded. The stock has displayed movement within a defined range, bounded by a long-term trendline resistance and an ascending support line, forming a narrowing price channel.
Trendlines: A descending resistance line has guided price limitations, while an ascending support line maintained the base
Volatility: Periods of expansion and contraction in daily price bars reflect shifting volatility and trading sentiment
Volume Analysis: The consolidation phase saw steady volume with periodic surges
This setup provides a useful illustration of how price compressions and trends appear on technical charts, helping learners recognize phases of accumulation, resistance, and support.
Disclaimer: This post is intended for educational purposes only and does not constitute investment advice. Markets are subject to risk and unpredictable movements; investors should consult financial advisors and perform their own research before making any investing decisions.
