GMR Airports Ltd – Bullish Bounce from Support ZoneThe chart of GMR Airports Ltd (Daily timeframe) is showcasing a well-respected ascending channel pattern, where price is currently bouncing off the lower support trendline, indicating a continuation of the bullish structure. This setup provides a compelling long opportunity if confirmed with price action.
• Uptrend Channel Structure Remains Intact
GMR Airports has been moving within a clearly defined uptrend channel with multiple touches at both resistance and support zones. The current bounce is happening near the support line, which has previously acted as a strong reversal point — suggesting that buyers are stepping in again.
• Twizzer Bottom Candlestick at Support
A key bullish candlestick pattern, the Twizzer Bottom, has formed right at the trendline support. This candlestick combo is known for reversal potential, especially at critical zones like this. The confluence of support + reversal pattern adds strong conviction to the bullish setup.
• EMA Support Alignment
The price also aligns closely with the 50-day EMA (blue line) and is above the 200-day EMA (red line) — a typical bullish sign in trend-following strategies. This alignment reinforces the uptrend bias and increases the odds of an upside continuation.
• Upside Targets Clearly Marked
- The initial target is placed at ₹93+, which corresponds to the last swing high.
- Target 2 is marked at ₹97+, aligning with the 52-week high.
- If price breaks through the upper resistance channel with momentum, the final target may extend higher, potentially entering price discovery mode.
• Risk Management is Well Defined
- The stop-loss is marked below ₹85, just under the previous swing low and trendline support.
- A close below this level will indicate a long setup failure, and the structure will need re-evaluation.
- This gives a favorable risk-reward ratio for swing traders entering at current levels.
• Conclusion – Watch for Momentum Confirmation
If follow-through buying occurs in the coming sessions, this could lead to a sharp upward move back toward the upper channel resistance. Traders should wait for volume expansion and strong candle closure above ₹88 for further confirmation. The overall bias remains bullish until the lower channel is broken convincingly.
Technical Analysis

Bitcoin – Let’s Play the Resistance Game at 114,500Bitcoin on the 1-hour chart has entered a critical resistance zone around 114,200–114,500. Price has rallied strongly from the recent lows near 113,000, but now faces a major supply area. The structure suggests that BTC could face rejection here and move back toward the support zone near 112,600 if sellers step in.
As long as price stays below 114,500, this resistance remains valid. A clean breakout above this level with strong momentum would invalidate the bearish view and open the path for higher levels. On the downside, holding support near 112,600 will be key for buyers to maintain control.
Disclaimer: This analysis is for educational purposes only and should not be taken as financial advice. Please do your own research or consult your financial advisor before investing.
Analysis By @TraderRahulPal (TradingView Moderator) | More analysis & educational content on my profile
👉 If you found this helpful, don’t forget to like and follow for regular updates.

Gold Bulls in Control: Buy Zones Lined Up for the Breakout!📊 Market Context
Gold is trading near record highs around $3,850, heading toward its best month in 14 years. With Q3 2025 and September closing, gold has surged nearly 12% this month, driven by rising safe-haven demand amid the looming U.S. government shutdown and weaker USD sentiment.
The bullish structure remains intact, and dips continue to attract aggressive buyers.
📍 Key Trading Levels
🟢 BUY Zones
3846 – 3843 → Intraday BUY scalp zone
SL: 3836
TP: 1R → 2R → 3R → 4R (hold longer if above 389x)
3818 – 3816 → Deeper reaction BUY zone
SL: 3810
TP: 1R → 2R → 3R → 4R (limit orders can be set for extended swing positions)
🔴 SELL Reaction Zone
Around 387x → Expect heavy profit-taking and short-term pullbacks.
🎯 Trade Plan
Prioritize BUY setups only; gold remains in strong bullish momentum.
Use the 384x zone for scalps and 381x zone for deeper limit buys.
Trail stops once price breaks 389x, opening room for 3920+ targets.
⚡ Trading Notes
Volatility may spike with U.S. political risks – manage positions carefully.
Avoid chasing highs; wait for structured retracements to BUY zones.
Stick to R/R discipline; market rewards patience in strong trends.
💬 Community Insight
Do you think gold will smash through 3920+ this week, or will we get another retracement first? Drop your setups and let’s compare strategies 👇

#NIFTY Intraday Support and Resistance Levels - 30/09/2025Nifty is likely to see a flat opening around the 24,700 zone, indicating indecision after the recent downtrend. The index is trading near a crucial support and resistance zone, suggesting that today’s session could remain range-bound with opportunities for both intraday buyers and sellers.
On the upside, a move above 24,750–24,800 can trigger a bounce toward 24,850, 24,900, and 24,950+. Sustaining above these levels may bring short-covering and provide momentum to bulls.
On the downside, a breakdown below 24,700 followed by weakness under 24,650–24,600 can drag the index lower toward 24,550 and 24,500-. If selling pressure increases, further downside cannot be ruled out.
Overall, Nifty is consolidating in a narrow range with sellers holding dominance. Traders should stay cautious, follow breakout levels, and manage risk with strict stop-losses.

[INTRADAY] #BANKNIFTY PE & CE Levels(30/09/2025)Bank Nifty is likely to witness a flat opening near the 54,500 levels. The index is currently trading around a critical zone where both support and resistance levels are closely placed, suggesting that the market may remain range-bound initially before a clear breakout direction emerges.
On the upside, if Bank Nifty manages to sustain above 54,550–54,600, it can trigger a bullish move toward 54,750, 54,850, and 54,950+. A strong close above these levels will further strengthen the positive momentum.
On the downside, immediate support is seen around 54,450–54,400. A breakdown below this zone may open the gates for further weakness toward 54,250, 54,150, and 54,050-.
Overall, Bank Nifty is consolidating in a tight range, and traders should wait for a breakout on either side to confirm the next trend. Following strict stop-losses and trailing profits is advised, as false breakouts are also possible in such flat openings.

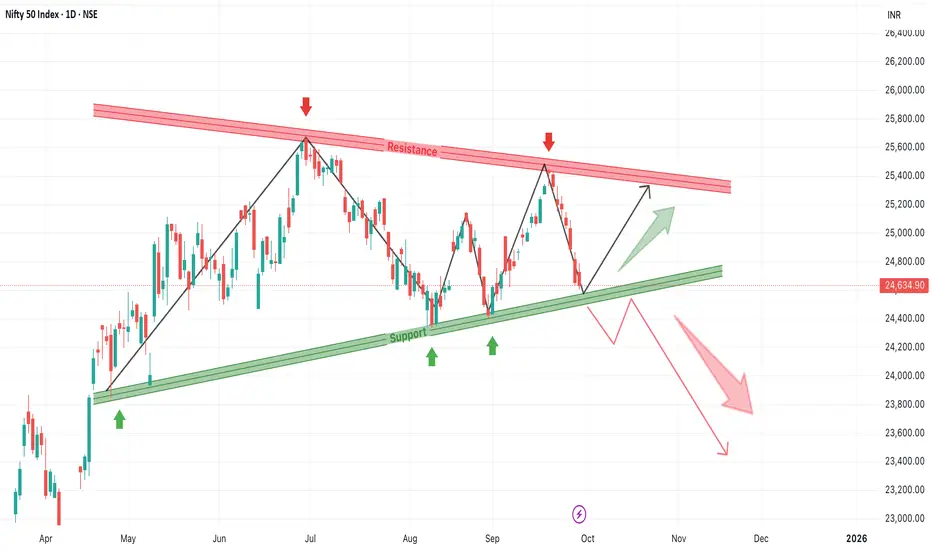
Nifty 50 – Triangle Structure Holding Critical Support ZoneThe daily chart of Nifty 50 shows a well-formed symmetrical triangle pattern. Price is currently hovering around the lower ascending trendline, which has acted as a strong support multiple times in the past. Market participants should closely monitor this zone as the next move will set the tone for October.
1. Symmetrical Triangle with Tightening Range
Nifty has been forming lower highs and higher lows since May, leading to the development of a large symmetrical triangle pattern. The converging trendlines indicate that volatility compression is taking place, often a precursor to a big breakout or breakdown move.
2. Support Zone Holding Around 24,600
Currently, the index is testing the crucial ascending support line, which has been respected at least 4 times in recent months (as shown by green arrows). A bounce from here would indicate continued buyer interest and maintain the bullish structure intact.
3. Upside Scenario – Reversal from Support
If Nifty manages to hold above this support zone and begins a reversal, we can expect a relief rally toward the falling resistance trendline. This could lead to a price retest near 25,300–25,400, which is also the previous swing high. A clean breakout above this zone could trigger a new upward trend.
4. Downside Scenario – Breakdown Below Support
On the contrary, if price breaks and closes below the 24,600 support zone, it may trigger panic selling. The chart indicates a large red arrow projection in this case, suggesting a move toward the 23,800–23,400 zone initially. A breakdown from symmetrical triangles often results in sharp directional moves.
5. Risk Management Is Critical
At this stage, traders must stay non-directional and reactive rather than anticipatory. Wait for either a confirmation bounce from support or a clear breakdown. False moves are common near the apex of a triangle. Risk should be tightly managed with stop-losses below support for long positions, and above resistance for short positions.
6. Pattern Psychology – Buyers vs Sellers at War
This pattern is a classic indecision structure, where neither bulls nor bears are in full control. The resolution from this zone will reflect market sentiment for Q4 2025. Keep an eye on macro triggers, earnings season, or global cues, which could act as catalysts for the next breakout or breakdown.
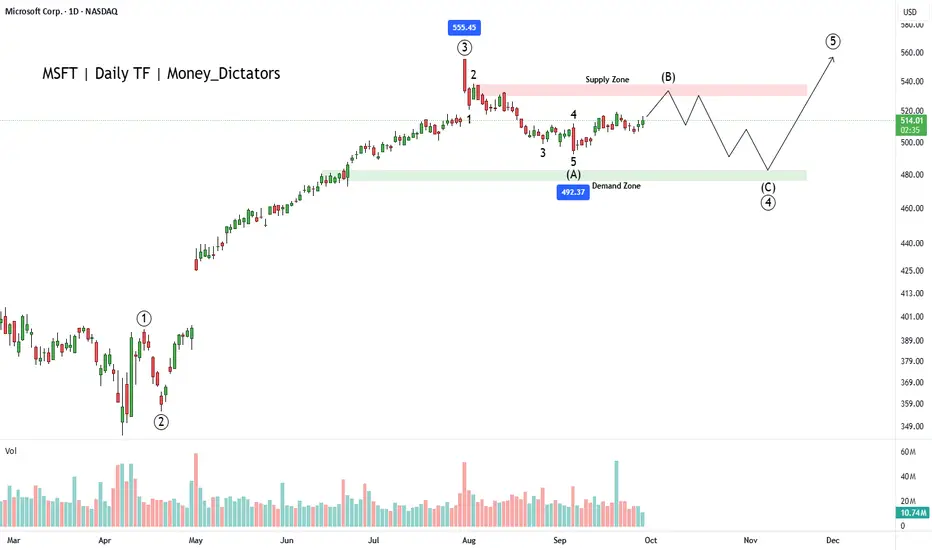
Why MSFT Could Be a Smart Pick in 2025?MSFT has bullish signals from the multiple moving averages, RSI and volume analysis. However, wave principle asks evidence from the buyers. The wave count suggests that the corrective wave (B) is ongoing, and bears will control the final wave of the primary wave 3.
Wave C will start falling nearby the supply zone and high of the 2nd wave of wave intermediate wave A. Wave C can fall up to 476 which will be the strength for wave primary wave 5. As per the chart, breakout above 540 will be a good signal for bulls to take charge back.
Zones:
Supply zone: 538 - 528
Demand zone: 482 - 476
I will update the chart and details shortly.
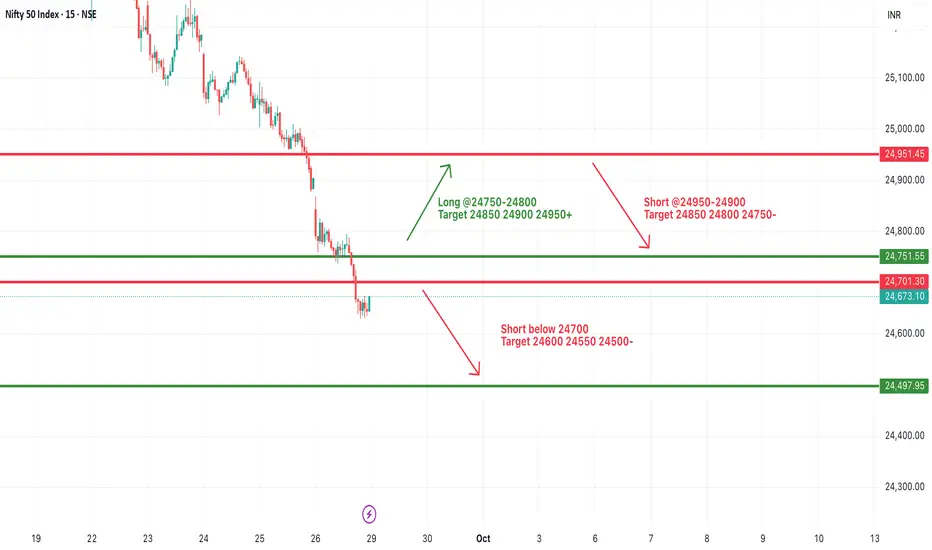
#NIFTY Intraday Support and Resistance Levels - 29/09/2025Nifty is expected to open around the 24,750 zone today, which is a crucial resistance area after the recent downtrend. If the index sustains above 24,750–24,800, then a small relief rally could be seen toward 24,850, 24,900, and 24,950+. However, this upside may remain limited as the broader structure is still weak.
On the downside, if Nifty slips below 24,700, selling pressure may resume, dragging the index toward 24,600, 24,550, and 24,500-. This indicates that the index is still in a corrective phase, and unless a strong breakout is seen, rallies could face selling at higher levels. Traders should be cautious near 24,750 resistance and manage trades with strict stop-losses, favoring short setups on breakdowns for safer opportunities.
How to Spot Trend Changes Using Simple Market StructureMastering Market Structure: Where to Find the Best Trading Setups in line with simple observation done using Price action .

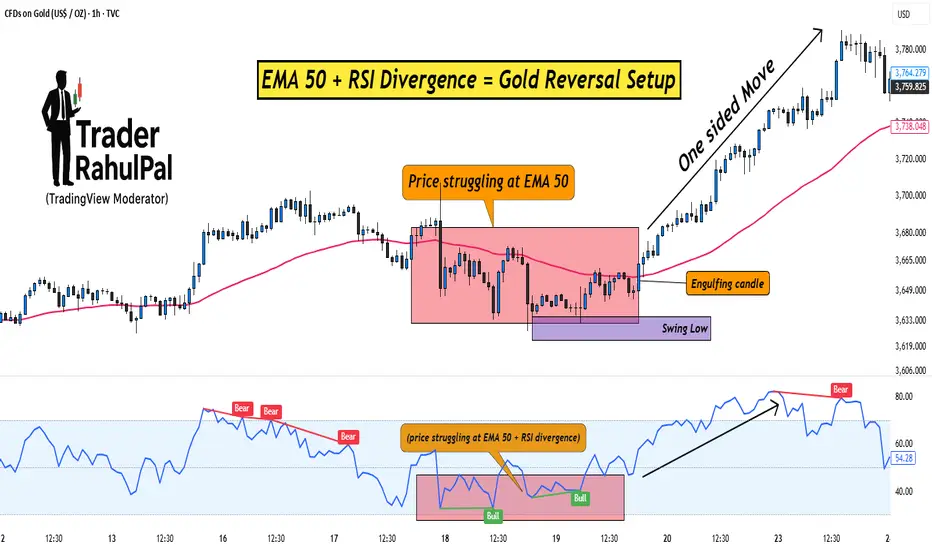
EMA 50 + RSI Divergence = Gold Reversal Setup!Hello Traders!
Gold often makes sharp one-sided moves, trapping traders who enter too late. But if you know how to combine a simple moving average with a momentum indicator, you can spot high-probability reversal setups.
One such method is using the EMA 50 together with RSI Divergence . Let’s break down how it works.
1. Why EMA 50?
The 50-period EMA acts as a dynamic trend filter.
When gold trades above it, the short-term trend is bullish; below it, bearish.
Price often retests the EMA 50 during pullbacks, making it a key level to watch for reversals.
2. What is RSI Divergence?
Divergence happens when price makes a new high/low, but RSI doesn’t confirm it.
Example: Price makes a higher high, but RSI makes a lower high → bearish divergence.
This signals that momentum is weakening, even if price is still moving strongly.
3. Combining EMA 50 with RSI Divergence
First, check where price is relative to EMA 50.
Next, look for divergence on RSI near that zone.
If both align (price struggling at EMA 50 + RSI divergence), chances of a reversal increase sharply.
4. Entry & Risk Management
Wait for a confirmation candle near EMA 50 (like engulfing or pin bar).
Place stop loss just above recent swing high/low.
Target the next support/resistance zone for exits.
Rahul’s Tip:
Don’t use divergence alone, combine it with EMA 50 for structure and you’ll filter out most false signals. This setup works best on higher timeframes like 1H or 4H for gold.
Conclusion:
EMA 50 gives you the trend filter, and RSI divergence reveals momentum weakness.
Together, they form a reliable reversal setup that helps you enter gold trades at the right time instead of chasing moves.
This Educational Idea By @TraderRahulPal (TradingView Moderator) | More analysis & educational content on my profile
If this post gave you a new setup idea, like it, share your thoughts in comments, and follow for more practical trading strategies!
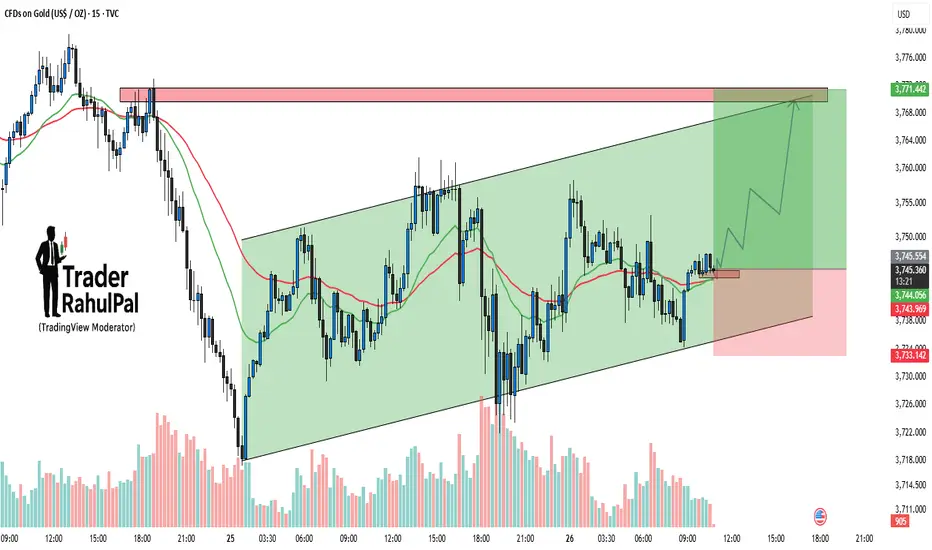
Gold – Channel Support Holding, Upside Target Towards 3770Gold is trading within a well-defined ascending channel on the 15-min chart. Price action has repeatedly respected both support and resistance lines, which makes this pattern highly reliable in the short term. Currently, the price is bouncing from the lower channel support and holding firmly above the 3740–3743 zone. As long as this support area is protected, the bullish momentum remains intact and the next upside target comes in around 3770, aligning with the channel resistance. A breakout above 3770 could trigger an even stronger rally, while a failure to hold below 3733 would invalidate the setup and shift the bias to the downside.
Disclaimer: This analysis is for educational purposes only and should not be taken as financial advice. Please do your own research or consult your financial advisor before investing.
Analysis By @TraderRahulPal (TradingView Moderator) | More analysis & educational content on my profile
👉 If you found this helpful, don’t forget to like and follow for regular updates.
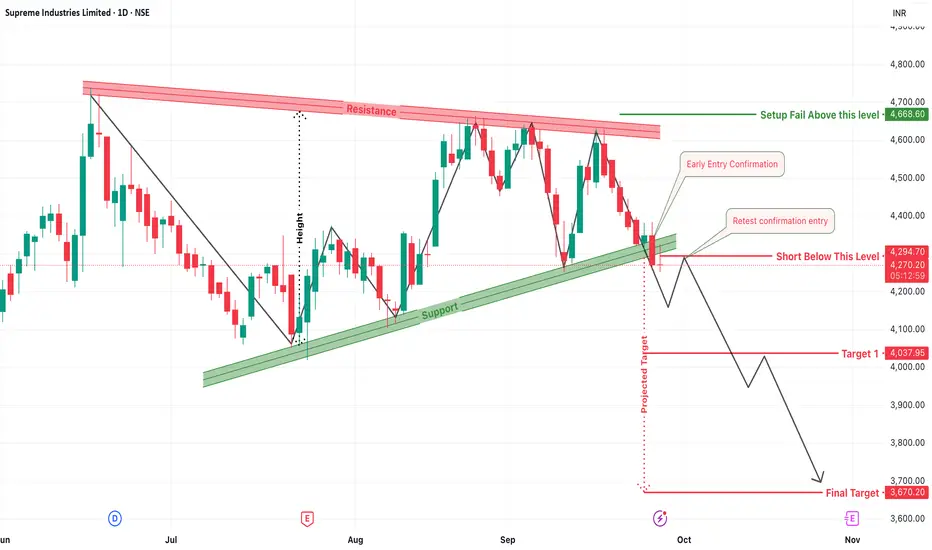
Supreme Industries: Breakdown Below Ascending SupportThe daily chart of Supreme Industries is showcasing a strong bearish signal with a breakdown below a long-held ascending trendline. The structure clearly resembles a descending triangle pattern, and the breakdown confirms growing weakness in price action, favoring sellers in the near term.
1. Bearish Structure Breakdown
The chart shows a clear descending resistance line with a rising support trendline, forming a tight triangle pattern. This kind of setup often indicates building pressure for a breakout, and in this case, it has resulted in a sharp breakdown below ₹4294, signaling the start of a fresh bearish leg.
2. Short Entry Below ₹4294.70
A confirmed breakdown is seen once the price breached below ₹4294.70. This is the ideal short entry trigger zone. Traders looking to enter early may have taken a position right at breakdown, while others may wait for a retest of the broken trendline as confirmation before entering.
3. Early Entry & Retest Entry Zones
For aggressive traders, an early entry just as the price approached the lower trendline was possible. However, confirmation entry after a retest offers better risk-reward and lower false breakdown probability. In this case, a small pullback to retest the broken support would be the sweet spot to enter with tight stop-losses.
4. Target 1: ₹4037.95 – First Downside Milestone
Once the breakdown is confirmed, the first logical price target based on previous swing lows and pattern measurement comes to around ₹4037.95. Traders can consider booking partial profits at this zone to lock in gains while letting the rest of the position ride.
5. Final Target: ₹3670.20 – Projected Measured Move
Based on the height of the triangle structure, the projected final bearish target lies near ₹3670.20. This level aligns with previous consolidation zones and serves as a strong psychological and technical support. If price action remains weak, this target has a high probability of being achieved in the coming weeks.
6. Stop Loss: Setup Invalid Above ₹4668.60
To protect against a failed breakdown or reversal, a stop-loss should be strictly placed above ₹4668.60. This level invalidates the bearish structure and signals that buyers may have regained control.
7. Trading Psychology and Risk Note
Breakdowns from such ascending supports after long consolidations often result in impulsive price moves. However, risk management is critical. Stick to position sizing and trail your stop-losses once Target 1 is achieved. Avoid holding full-size positions near earnings or event-based volatility.
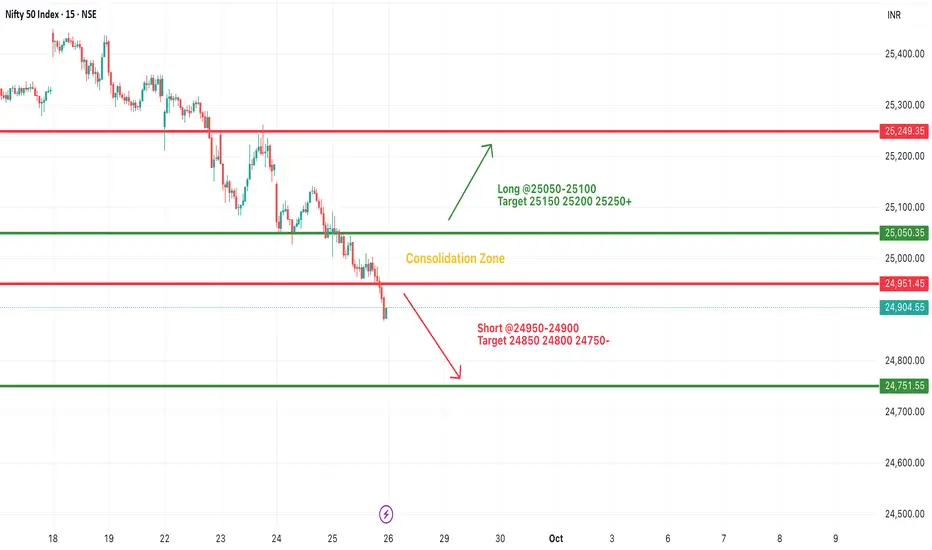
#NIFTY Intraday Support and Resistance Levels - 26/09/2025Nifty is expected to open on a flat note near the 24,900 zone, showing signs of consolidation. On the upside, a move above 25,050–25,100 will be crucial for bulls to regain strength, which can open the path toward 25,150, 25,200, and 25,250+. Sustaining above these levels may extend the rally further. On the downside, immediate support lies at 24,950, and a breakdown below 24,900 could trigger selling pressure, dragging Nifty lower toward 24,850, 24,800, and 24,750-.
Overall, the index is currently trading in a consolidation zone, where both upside and downside moves are possible. Traders should closely monitor the breakout and breakdown levels for directional confirmation. With a flat opening expected, it’s important to follow strict stop-loss rules and trail profits as targets are achieved.
XAUUSD Facing Downward PressureHello traders, XAUUSD is currently facing downward pressure following recent economic news. The lower-than-expected unemployment claims data suggests economic stability, reducing the demand for gold. The higher-than-expected PCE core index increases the likelihood that the Fed will maintain high interest rates, putting pressure on gold prices. While the US GDP remains stable , there is no strong breakthrough.
Technically, XAUUSD is in an uptrend but has encountered resistance at $3,790 . The price of gold is currently testing support at $3,700. If this level is broken, gold could fall to the $3,635 region.
Given the current fundamental and technical factors , the likelihood of XAUUSD continuing to decline is high. If support doesn't hold, gold could continue to drop.
Wishing you successful trading!

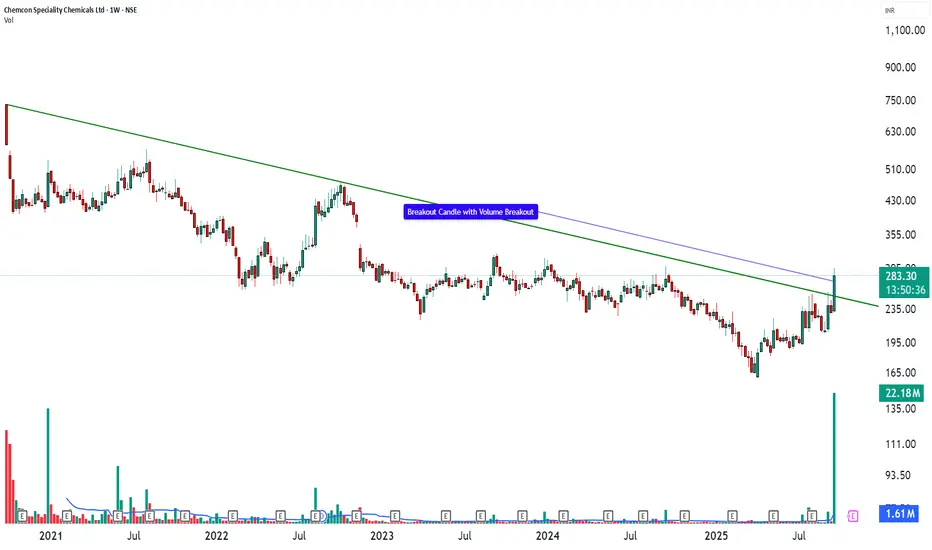
CHEMCON - Possible Breakout on Chart🧪 Chemcon Speciality Chemicals – Niche Player With a Big Opportunity
Chemcon Speciality Chemicals (CMP ~₹283) operates in a high-value niche of specialty chemicals, producing critical pharma intermediates such as HMDS and CMIC, along with bromide solutions for the oilfield sector. Being among the few Indian makers of these products, Chemcon enjoys a technical edge and import-substitution advantage.
📈 Fundamentals
Market Cap: ~₹1,038 Cr
P/E: ~40×
Book Value: ~₹137
Debt: Practically debt-free
ROE / ROCE: ~5% / ~7%
Recent Trend: Q1 FY26 revenue up ~18% YoY; net profit ~₹6.4 Cr.
🏭 Business View
Chemcon’s specialty products cater to global pharma and oilfield customers, giving it a wide demand base. A revival in pharma capex and rising domestic production of intermediates could drive steady orders. The company has announced capacity expansion plans and continues to broaden its export relationships.
💡 Technical Snapshot
Price action has been consolidating between ₹260–₹300, forming a base after earlier volatility. Sustained closes above ₹300 could open the path toward ₹340–₹360 as the next resistance zone, while ₹250 remains an important support.
🎯 Educational Trade Idea (for learning only)
A case-study plan could observe a hypothetical entry on a daily close above ₹300 with an illustrative stop around ₹265 and a learning target of ₹340–360.
This is not a recommendation, just an example of how one might structure a breakout setup.
🌟 Long-Term View
For Chemcon to become a serious compounder, management must deliver:
15–20%+ annual revenue growth,
stronger cash generation, and
ROE moving toward the mid-teens.
If those pieces fall into place, this niche specialty-chemicals player could create significant value.
⚠️ Disclosure & Disclaimer – Please Read Carefully
I/we have no financial interest or position in Hindustan Copper at the time of writing.
The information shared here is meant purely for learning and awareness. It is not a buy or sell recommendation and should not be taken as investment advice. I am not a SEBI-registered investment adviser, and all views expressed are based on personal study, chart patterns, and publicly available market data.
Trading—whether in stocks or options—carries risk. Markets can move unexpectedly, and losses can sometimes exceed the money you have invested. Past performance or past setups do not guarantee future results.
If you are a beginner, treat this as a guide to understand how the market works and practice on paper trades before risking real money. If you are experienced, always assess your own risk, position sizing, and strategy suitability before entering trades.
Consult a SEBI-registered financial adviser before making any real trading decision. By engaging with this content, you acknowledge full responsibility for your trades and investments.
💬 Found this useful?
🔼 Give this post a Boost to help more traders discover clean, structured learning.
✍️ Drop your thoughts, questions, or setups in the comments — let’s grow together!
🔁 Share with fellow traders and beginners to spread awareness.
👉 “If you liked this breakdown, follow for more clean, structured setups with discipline at the core.”
🚀 Stay Calm. Stay Clean. Trade With Patience.
Trade Smart | Learn Zones | Be Self-Reliant 📊
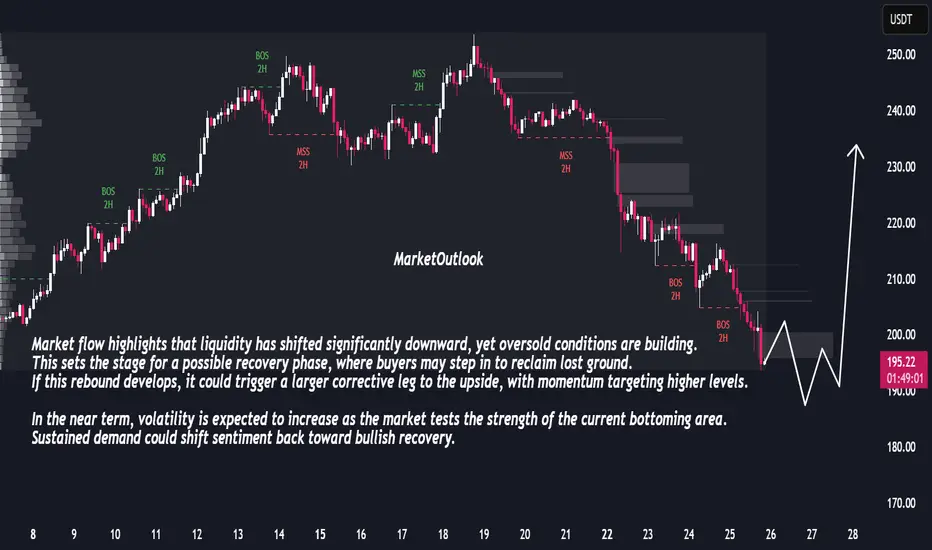
Bullish Reversal Ahead: Market Prepares for Sharp RecoveryThe market has been under consistent selling pressure, with a clear sequence of bearish breaks in structure confirming downside control. Price has now entered a zone where momentum shows signs of slowing, suggesting potential exhaustion in the recent decline. The sharp extension lower indicates that sellers may be reaching a short-term limit, creating conditions for a corrective rebound.
Market flow highlights that liquidity has shifted significantly downward, yet oversold conditions are building. This sets the stage for a possible recovery phase, where buyers may step in to reclaim lost ground. If this rebound develops, it could trigger a larger corrective leg to the upside, with momentum targeting higher levels.
In the near term, volatility is expected to increase as the market tests the strength of the current bottoming area. Sustained demand could shift sentiment back toward bullish recovery.
Gold shakes violently | Priority Buy on dip to support🟡 XAU/USD – 24/09 | Captain Vincent ⚓
🔎 Captain’s Log – Context & News
Geopolitics : Trump unexpectedly supported Ukraine reclaiming full territory and called on NATO to be tougher on Russia → defensive sentiment returned, supporting Gold.
US Economy : Housing data due today, no FED speeches.
Earlier: Weak US PMI + dovish FED tone → no momentum for a prolonged downtrend.
Price Action : Gold dropped more than 20 points overnight, then quickly rebounded to 3,76x → likely profit-taking pressure at higher levels.
⏩ Captain’s Summary : Main trend stays bullish, but the voyage will remain choppy as Gold absorbs profit-taking near resistance.
📈 Captain’s Chart – Technical Analysis (H45)
Golden Harbor (Support / Buy Zone)
Buy Scalp OB: 3,754 – 3,757
OB Harbor: 3,741 – 3,744
Storm Breaker (Resistance / Sell Zone)
Sell Scalp Zone: 3,797 – 3,800
Higher Sell Zone: 3,813 – 3,815
Market Structure
After the deep drop, Gold rebounded and held above 3,76x.
Bullish trend remains intact, but waves of volatility may occur near higher resistance zones.
🎯 Captain’s Map – Trade Plan
✅ Buy (priority)
Buy Scalp OB
Entry: 3,754 – 3,757
SL: 3,747
TP: 3,762 – 3,767 – 3,772 – 3,777 – 3,782
Buy Zone OB
Entry: 3,741 – 3,744
SL: 3,732
TP: 3,749 – 3,754 – 3,759 – 3,764 – 3,769
⚡ Sell (short scalp – lower RR)
Sell Scalp Zone
Entry: 3,797 – 3,800
SL: 3,806
TP: 3,795 – 3,790 – 3,785 – 3,780 – 3,775
Higher Sell Zone
Entry: 3,813 – 3,815
SL: 3,823
TP: 3,810 – 3,805 – 3,800 – 3,795 – 3,790
⚓ Captain’s Note
“The Golden ship rocked violently overnight but still anchored firmly at Golden Harbor 🏝️ (3,754 – 3,741) . Profit-taking waves may still rise at Storm Breaker 🌊 (3,797 – 3,815) , suitable for short Quick Boarding 🚤 scalps. Yet the main voyage continues north – Buy the Dip remains the compass to follow the strong winds.”
📢 If you find the Captain’s Log useful, don’t forget to Follow for the latest signals.
💬 Got your own view on Gold? Share it in the comments and join the crew discussion!

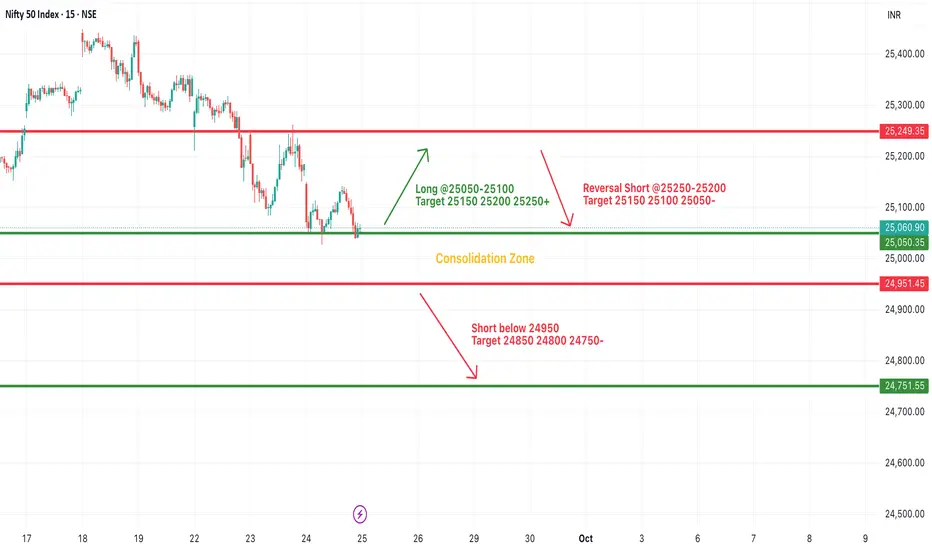
#NIFTY Intraday Support and Resistance Levels - 25/09/2025Nifty is expected to open with a gap down near the 25,050 zone, which lies within the current consolidation range. On the upside, if the index sustains above 25,050–25,100, it can trigger buying momentum toward 25,150, 25,200, and 25,250+.
A breakout above 25,250 will further strengthen the bullish sentiment and open the path for higher levels. On the downside, immediate support is placed around 25,000–24,950, and a breakdown below this zone may invite fresh selling pressure, dragging the index lower toward 24,850, 24,800, and 24,750-.
Additionally, a reversal short near the 25,200–25,250 resistance band cannot be ruled out, which may push prices back toward the lower range. Overall, Nifty remains in a consolidation phase, and traders should wait for a clear breakout or breakdown before taking directional positions.
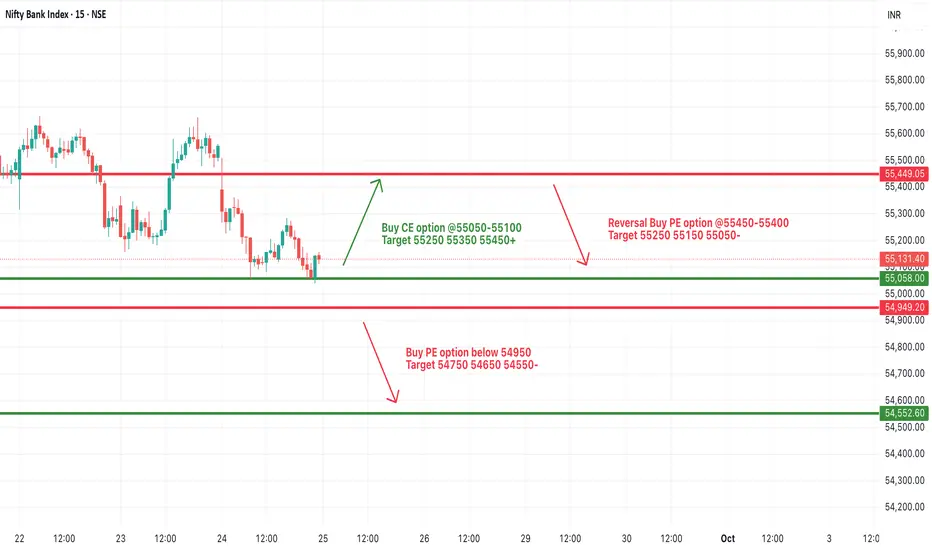
[INTRADAY] #BANKNIFTY PE & CE Levels(25/09/2025)Bank Nifty, a slightly gap-down opening is expected near the 55,100 levels. On the upside, strength will come only if the index sustains above 55,050–55,100, which can trigger a move toward 55,250, 55,350, and 55,450+. A further breakout above 55,450 will open the path toward 55,750–55,950+.
On the downside, immediate support lies at 55,050–55,000. A reversal from this zone or a breakdown below 54,950 may invite selling pressure, dragging the index lower toward 54,750, 54,650, and 54,550-.
Overall, Bank Nifty is hovering around a key support zone. A decisive move on either side of 55,100–55,000 will likely decide the intraday trend. Traders should keep strict stop-losses and trail positions as per the breakout or breakdown levels.
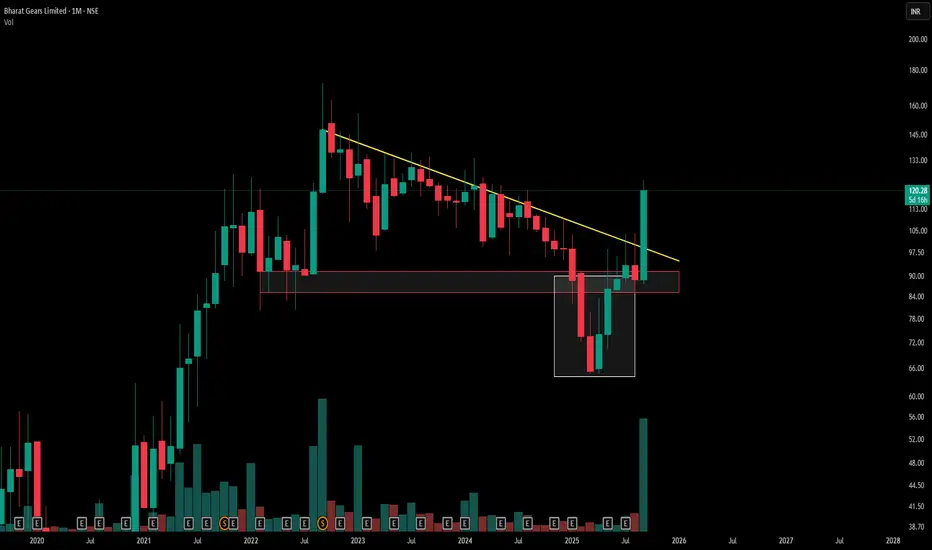
Monthly Descending Triangle & False BreakdownA descending triangle on the monthly chart shows lower highs converging toward a flat support, reflecting mounting seller pressure and key institutional interest at the horizontal base
The red counter trendline highlights corrective rallies within the broader down-sloping resistance.
The red demand zone marks where significant buying absorbed prior declines, offering a structural support area.
The white box illustrates a false breakdown below support—a liquidity-grab that shook out weak hands before a swift recovery—demonstrating how professional traders engineer stop-hunts to secure favorable entry levels.
This interplay of pattern, trendlines, demand zone, and false breakdown underscores how market structure and institutional tactics shape price action—key for informed, risk-defined decisions.
Disclaimer: For educational purposes only. Not investment advice. Risk management and independent research are vital.
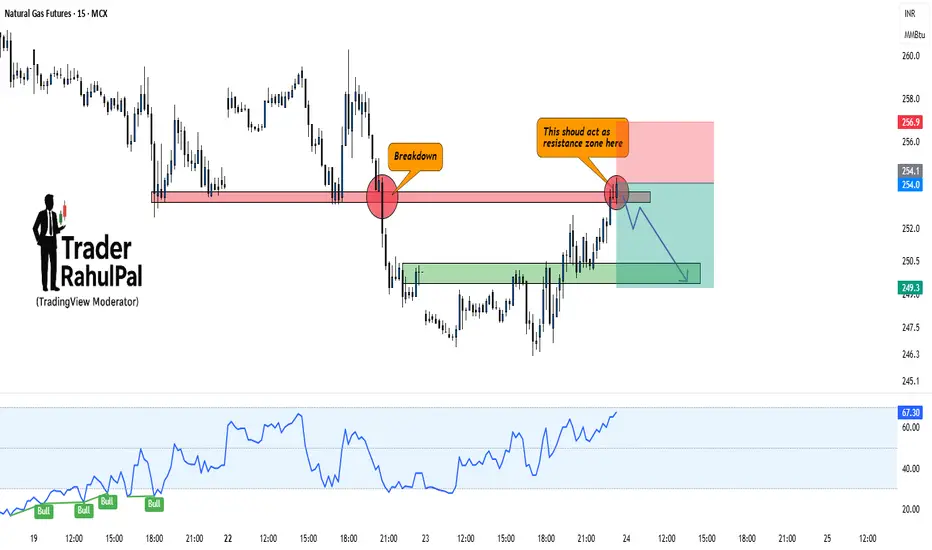
Natural Gas – Breakdown Retest Could Trigger Fresh FallHello everyone, Let's analyse Natural Gas and it has recently broken down from a key support level, turning it into resistance. The price is now retesting that zone, and unless bulls manage to reclaim it strongly, the downside remains the higher probability.
Current Setup:
Previous support around 254–256 has turned into a resistance zone.
Breakdown already confirmed with strong bearish candles.
RSI is still holding higher, but momentum may fade if resistance rejects.
Fresh downside targets can open toward 249–247 zone if rejection plays out.
Only a strong close above 257 will negate this bearish view.
Disclaimer: This analysis is for educational purposes only and should not be taken as financial advice. Please do your own research or consult your financial advisor before investing.
Analysis By @TraderRahulPal (TradingView Moderator) | More analysis & educational content on my profile
👉 If you found this helpful, don’t forget to like and follow for regular updates.
Gold Soars: Will a Weak USD Open the Door for New Highs?Hello traders, it’s clear that gold is rising sharply, supported by the weakening of the USD. Can gold continue to conquer new highs?
On the chart, the price is moving within a clear upward channel. The key support level at 3,750,000 has been tested multiple times, and if the price holds above this level, gold could continue rising towards 3,827,000. The areas near recent highs also show an increase in trading volume, reinforcing the bullish trend.
Forecasts indicate that the U.S. labor market is slowing down, with 233K jobs created, slightly higher than the previous 231K. This weakens the USD, creating an opportunity for gold to continue its rise, as gold typically benefits from a weaker USD.
With strong technicals and a weakening USD, XAU/USD could continue its upward momentum. Get ready for some exciting opportunities!

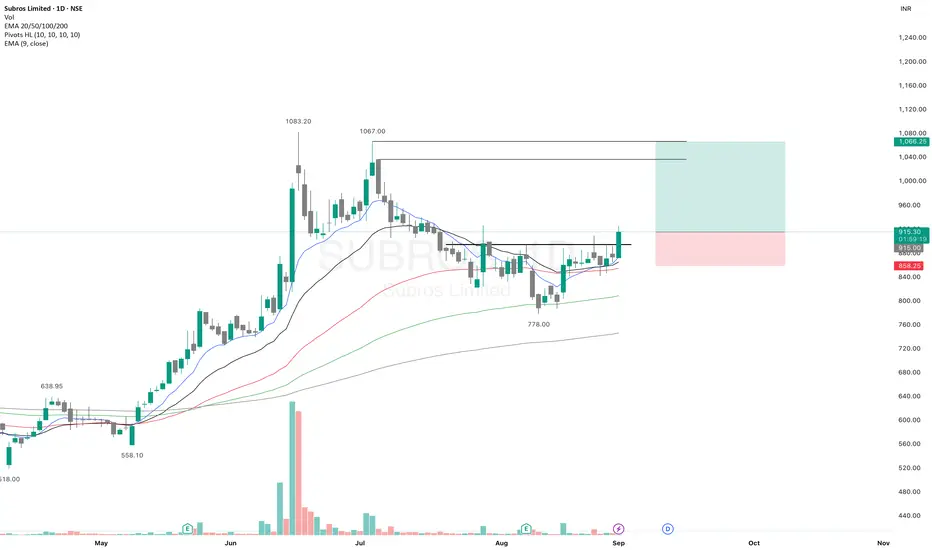
SUBROSSUBROS – After making an ATH, the price retraced and formed a new swing low at 778, followed by a brief consolidation.
Today, it has broken above the immediate resistance and is showing signs of strength.
All key EMAs are now aligned, further supporting the bullish setup.
✅ If you like my analysis, please follow me as a token of appreciation :)
in.tradingview.com/u/SatpalS/
📌 For learning and educational purposes only, not a recommendation. Please consult your financial advisor before investing.