DALBHARAT (DALMIA BHARAT)DALBHARAT has been making HH-HL formation.
There is probability of an upside move to touch the previous resistance near 2390.
Everyone: There is news about 25% tariff from Trump therefore strictly follow risk management to safeguard your capital.
✅ If you like my analysis, please follow me as a token of appreciation :)
in.tradingview.com/u/SatpalS/
📌 For learning and educational purposes only, not a recommendation. Please consult your financial advisor before investing.
Technical Analysis

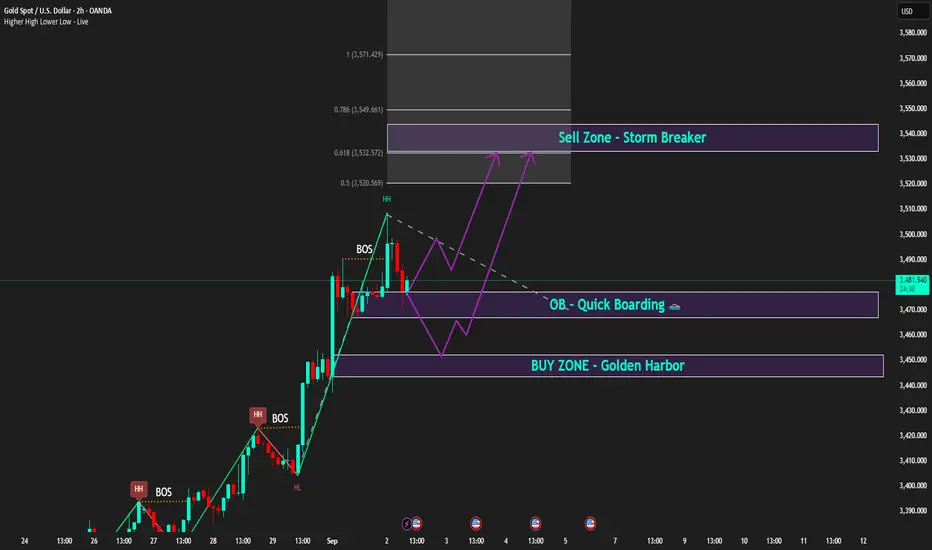
Bullish trend intact, waiting for PMI to spark the next waveCaptain Vincent – Gold Plan XAU/USD
1. Market Waves 🌍
The USD continues to weaken as investors grow more confident that the FED will cut rates in the coming months. With the greenback losing appeal, large flows are leaving cash and moving into safe-haven assets → gold stands out as the number one choice .
👉 This supports gold’s sustainable bullish trend . If USD selling pressure persists, the market could see fresh breakouts into year-end.
2. Technical Outlook ⚙️
H2 Chart: gold just created a Higher High after BOS , confirming bullish dominance.
Golden Harbor 🏝️ (Buy Zone 3,450 – 3,452): aligned with previous FVG , heavy liquidity zone.
Quick Boarding 🚤 (OB ~3,470): intermediate support, ideal for quick pullback entries.
Storm Breaker 🌊 (Sell Zone 3,538 – 3,540): resistance at Fibo 0.618 – 0.786 , strong chance of profit-taking if tested.
Intraday bias: Wait for pullback to Buy. Short-term Sell only if price hits Storm Breaker.
3. Captain Vincent’s Map – Key Levels 🪙
Golden Harbor 🏝️ (Buy Zone): 3,450 – 3,452
Quick Boarding 🚤 (OB Support): 3,470
Storm Breaker 🌊 (Sell Zone): 3,538 – 3,540
4. Trade Scenarios 📌
🔺 Golden Harbor 🏝️ (BUY – Priority)
Entry: 3,450 – 3,452
SL: 3,444
TP: 3,455 → 3,458 → 3,462 → 3,465 → 34xx
🔻 Storm Breaker 🌊 (SELL Reaction)
Entry: 3,538 – 3,540
SL: 3,548
TP: 3,535 → 3,532 → 3,529 → 35xx
5. Captain’s Note ⚓
“The gold sail is still filled with bullish wind, but Storm Breaker 🌊 above may create counter waves. Stay patient at Golden Harbor 🏝️ for precise entries, and watch the PMI at 21:00 – the catalyst for the next wave.”
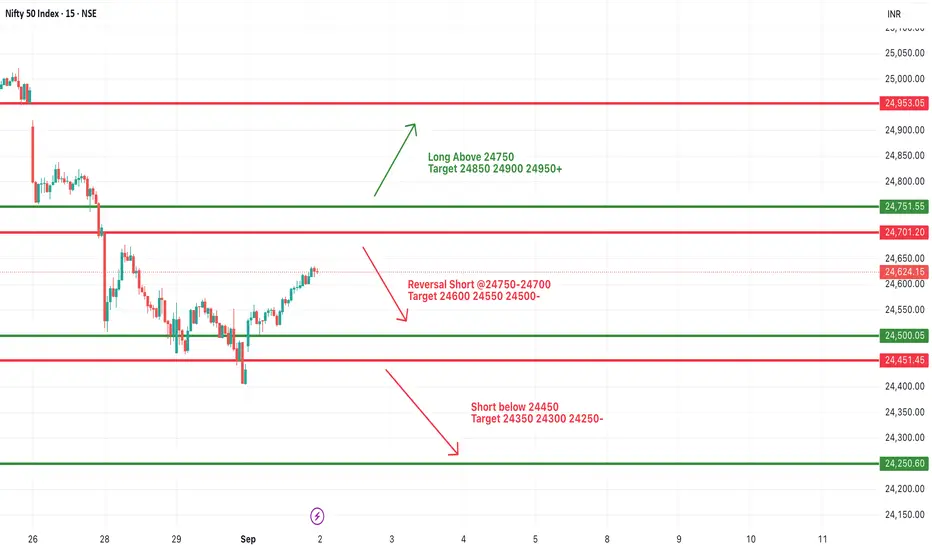
#NIFTY Intraday Support and Resistance Levels - 02/09/2025Nifty is expected to open with a gap up today, likely testing levels above 24,700. This zone will play a crucial role in deciding the intraday direction, as price action near this level may trigger either continuation or reversal moves.
On the upside, if Nifty sustains above the 24,750 mark, a fresh rally can be seen with targets at 24,850, 24,900, and 24,950+. A breakout above 24,950 could further fuel momentum, paving the way for an extended move toward 25,100 levels.
However, if Nifty faces resistance near 24,750–24,700 and fails to hold, a reversal short opportunity may open up. In that case, downside targets would be 24,600, 24,550, and 24,500. A decisive break below 24,450 would further weaken sentiment, dragging the index toward 24,350, 24,300, and 24,250.
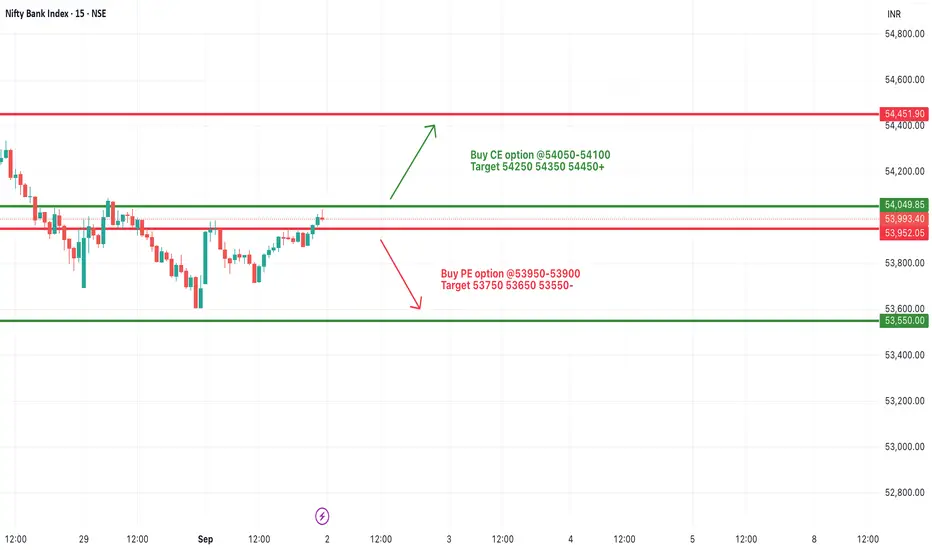
[INTRADAY] #BANKNIFTY PE & CE Levels(02/09/2025)Bank Nifty is likely to witness a slightly gap-up opening today, with price action consolidating near the 54,000 zone. This level remains a key pivot for intraday direction, and traders should watch closely for confirmation on either side.
On the upside, if Bank Nifty sustains above the 54,050–54,100 range, a positive move could unfold with targets placed at 54,250, 54,350, and 54,450+. Sustained buying momentum above 54,450 could further strengthen bullish sentiment and extend the rally.
On the downside, if the index fails to hold and slips below 53,950–53,900, fresh selling pressure may drag Bank Nifty lower toward 53,750, 53,650, and 53,550. A breakdown below 53,550 would open the door for deeper declines, turning market sentiment more negative.
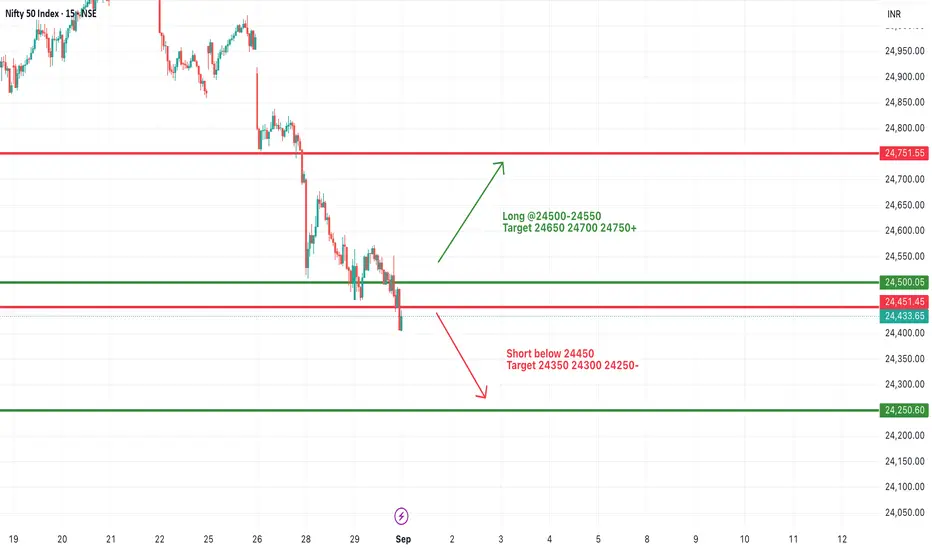
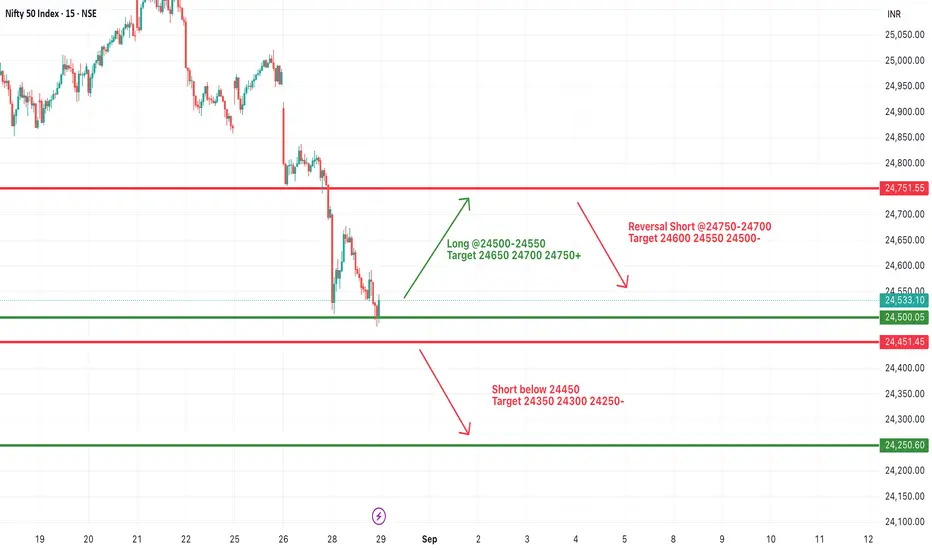
#NIFTY Intraday Support and Resistance Levels - 01/09/2025Nifty is expected to open slightly gap up today, with the index holding near the key 24,500 zone. This level will play a crucial role in defining intraday momentum. A sustained move above this mark can open the doors for a short-term recovery, while failure to hold above may trigger renewed selling pressure.
On the upside, if Nifty manages to sustain above 24,500–24,550, buying momentum could push the index higher toward 24,650, 24,700, and 24,750+. A breakout above 24,750 would further strengthen the bullish outlook, creating the possibility of testing higher resistance levels in the coming sessions.
On the downside, if Nifty slips below 24,450, selling pressure is likely to resume, dragging the index toward 24,350, 24,300, and 24,250. A breakdown below 24,250 could accelerate the decline, shifting market sentiment firmly to the bearish side.
Overall, Nifty remains in a critical zone with 24,500 acting as the pivot. Traders should watch price action closely around this level, as the first hour of trade will likely dictate the direction for the rest of the session.
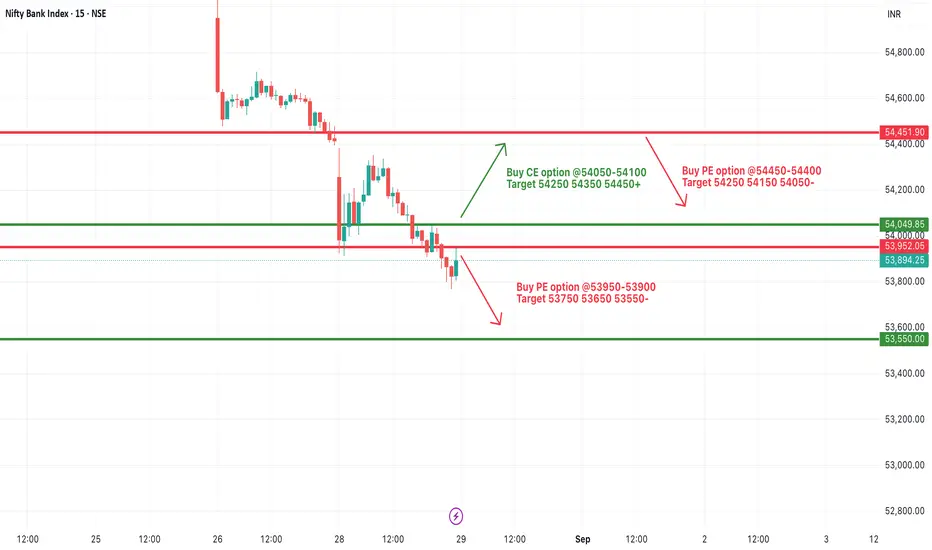
[INTRADAY] #BANKNIFTY PE & CE Levels(01/09/2025)Bank Nifty is likely to open with a slight gap-up today, showing signs of stabilisation after recent weakness. The immediate levels to watch will be 53,550 on the downside and 53,950 on the upside, as they are expected to act as crucial intraday pivot zones.
On the upside, if Bank Nifty sustains above 53,950–54,100, a recovery rally may emerge, taking the index higher towards 54,250, 54,350, and 54,450+. A breakout above 54,450 can provide stronger momentum for extended gains. Additionally, a reversal buying opportunity could also be considered around the 53,550–53,600 zone, with targets placed at 53,750, 53,850, and 53,950+.
On the downside, if Bank Nifty slips below 53,900, selling pressure may resume with targets at 53,750, 53,650, and 53,550. A further breakdown below 53,450 could drag the index lower towards 53,250, 53,150, and even 53,050 levels.
Overall, the index remains in a cautious zone with limited directional clarity. Traders should keep an eye on the price action around key support and resistance zones, as the first hour of trade will likely define the day’s momentum.

ETH Possible MoveETH currently is making a Peanut Pattern. One can also call this a Pole and Flag pattern. Hence, look for a breakout and breakdown of this pattern and keep a check on the chart.
Hope this study helps in learning and understanding chart patterns better.
Jai Shree Ram.
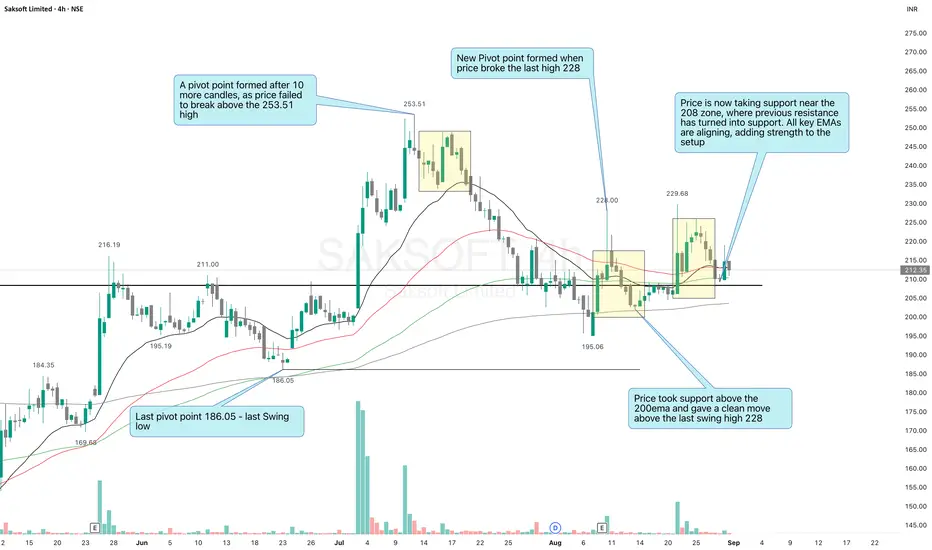
Pivot Points Indicator - Explained with SAKSOFT chartPivot Points Explained with SAKSOFT
Introduction
Pivot Points help us identify important swing highs and lows where the market changes direction. They are simple but powerful in understanding structure, support/resistance, and trend strength.
1. Pivot Low – 186.05
Price fell but held at 186.05. After enough candles, this level confirmed as a pivot low → strong support.
2. Pivot High – 253.51
Price tried to break 253.51 but failed. After sideways movement, this level confirmed as a pivot high → resistance zone.
3. Time Confirmation
A pivot point doesn’t form instantly.
It can take 10 or more candles, depending on timeframe and volatility.
Waiting filters noise and confirms real structure.
4. Next Pivot Low – 195.06
Price didn’t break 186 but formed a new low around 195.06.
This showed demand, but overall structure was still weak (lower highs).
5. Breakout Above 228
Price held above the 200 EMA and broke past the swing high at 228.
This created a new pivot high and signaled strength returning to buyers.
6. Support Flip – 208 Zone
The previous resistance at 208 flipped into support.
At the same time, 20–50–200 EMAs started aligning upward → bullish confluence.
7. Trading Insight
High-probability setups come when multiple factors align:
Price above 20–50 EMA
EMAs aligned in one direction
Bullish structure (Higher Highs, Higher Lows)
Strong support holding
Conclusion
Pivot Points + EMAs = simple yet effective way to read market structure.
They help identify support/resistance, confirm reversals, and guide trade planning with higher probability.
What do you think about using pivot points in your trading? Do you wait for them to form before planning entries? Share your experience and viewpoint
✅ If you like my analysis, please follow me as a token of appreciation :)
in.tradingview.com/u/SatpalS/
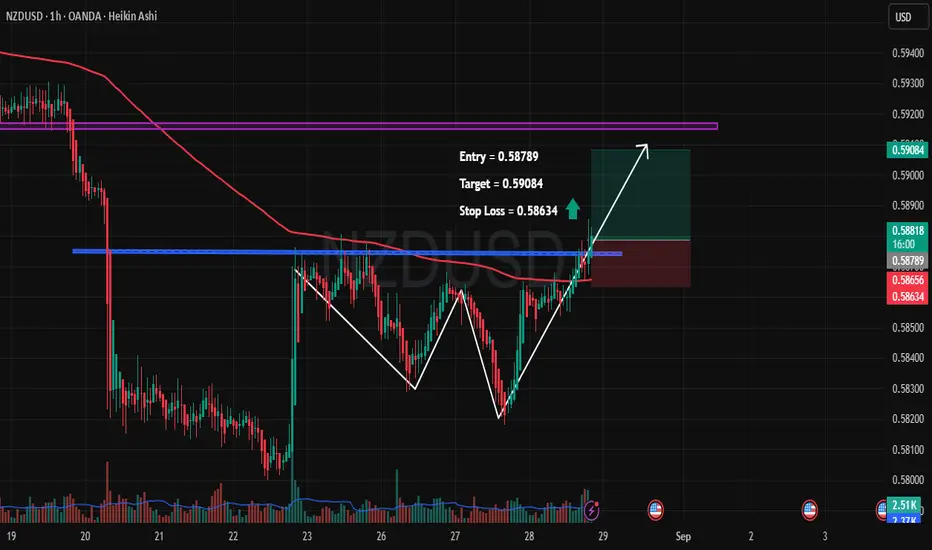
NZDUSD – Breakout Confirmation with Upside Potential🔹 Pair: NZDUSD (1H, Heikin Ashi)
🔹 Entry: 0.58789
🔹 Target: 0.59084 🎯
🔹 Stop Loss: 0.58634 🛑
🔑 Trade Rationale:
✅ Double Bottom Formation – Price respected key support twice, signaling potential reversal.
✅ Breakout Above Resistance – Clean breakout above horizontal resistance (blue line).
✅ 200 EMA Retest – Price is now pushing above the EMA, adding strength to the bullish case.
✅ Volume Spike – Recent surge in buying volume supports the upside move.
📊 Trade Plan:
I’m going long from 0.58789, looking for a quick move toward 0.59084. Risk is limited with a tight SL at 0.58634.
This setup offers a favorable R:R with a technical confluence of breakout + pattern confirmation.
⚠️ Disclaimer: This is not financial advice. Trade at your own risk. Always use proper risk management.
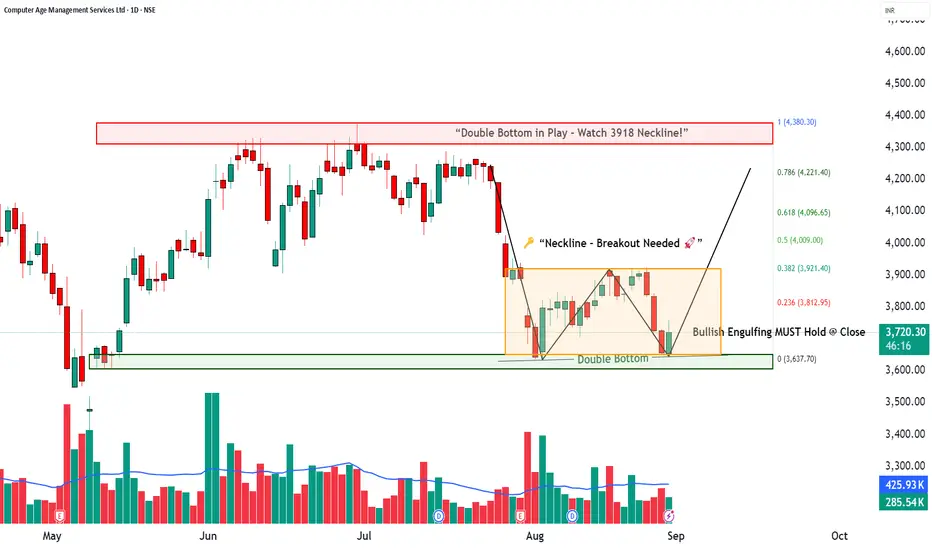
CAMS | Reversal in Sight? How to Trade a Double Bottom📈 CAMS | How to Trade a Double Bottom
Stock: Computer Age Management Services Ltd (CAMS)
Timeframe: Daily
Pattern: Possible Double Bottom (bullish reversal structure)
________________________________________
🔹 Pattern Identification
Bottom-1: 3632.40
Bottom-2: 3645
Neckline (Breakout Point): 3918
Candle Confirmation: Bullish Engulfing/Piercing on the second bottom
Volume: Improving on bounce, needs stronger confirmation on breakout
________________________________________
📘 Regular Trading Strategy (Conservative)
The Double Bottom is confirmed only when price closes above the neckline with strong volume.
Entry: Go long on close > 3918 preferred with volume ≥ 1.5–2× 20-DMA
Measured Height: 3918 − 3632 = 286 pts
Targets:
🎯 4094 (62% move)
🎯 4204 (full measured move)
🎯 4380 (161.8% Fibonacci extension)
Stoploss: Below 3630 (pattern invalidation)
Invalidation: Daily close below the bottoms
________________________________________
🔹 Alternative Entries
1️⃣ Retest Entry (Safer):
After breakout >3918, buy the pullback to neckline (3918–3925) if reversal candle appears.
SL below retest low.
2️⃣ Early Entry (Aggressive):
Trigger already seen at 3758.90 (bullish engulfing/piercing).
SL below 3668.
Add position if 3918 breakout confirms.
________________________________________
📊 Key Levels
Supports: 3668 | 3599 | 3554
Resistances: 3783 | 3827 | 3895
Fibonacci Zones: 3821 (23.6%) | 3921 (38.2%) | 4009 (50%) | 4096 (61.8%) | 4221(78.6%) | 4380 (100%)
________________________________________
💡 Trading View
CAMS is forming a potential Double Bottom reversal near major support.
Early signs of buying are visible at 3758.9, but real confirmation will come only above 3918 neckline.
Breakout with strong volume can open upside towards 4094 → 4204 → 4380.
📌 Bias: Bullish above 3750; stronger confirmation only on breakout above 3918.
📌 Risk: Invalidation below 3630.
👉 The Bullish Engulfing/Piercing candle at the second bottom MUST hold at daily close for the setup to remain valid.
⚠️ Disclaimer – Please Read Carefully
The information shared here is meant purely for learning and awareness. It is not a buy or sell recommendation and should not be taken as investment advice. I am not a SEBI-registered investment advisor, and all views expressed are based on personal study, chart patterns, and publicly available market data.
Trading — whether in stocks or options — carries risk. Markets can move unexpectedly, and losses can sometimes exceed the money you have invested. Past performance or past setups do not guarantee future results.
If you are a beginner, treat this as a guide to understand how the market works — practice on paper trades before risking real money. If you are experienced, always assess your own risk, position sizing, and strategy suitability before entering trades.
Consult a SEBI-registered financial advisor before making any real trading decision. By engaging with this content, you acknowledge full responsibility for your trades and investments.
💬 Found this useful?
🔼 Give this post a Boost to help more traders discover clean, structured learning.
✍️ Drop your thoughts, questions, or setups in the comments — let’s grow together!
🔁 Share with fellow traders and beginners to spread awareness.
👉 “If you liked this breakdown, follow for more clean, structured setups with discipline at the core.”
🚀 Stay Calm. Stay Clean. Trade With Patience.
Trade Smart | Learn Zones | Be Self-Reliant 📊
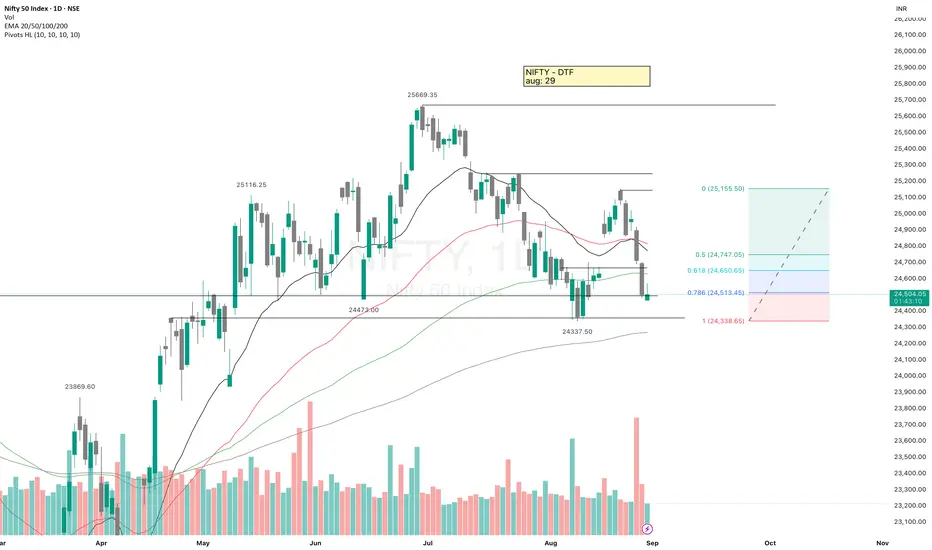
NIFTY50 - Technical AnalysisNIFTY - Technical analysis
Price is currently around 24,500, which is right near the 0.786 retracement level, a Strong confluence zone, Nifty has reversed from here multiple time.
If Nifty sustains above 24,500 and reclaims 24,650–24,750 (0.618–0.5 retracement), there is room for upside move toward 25,150.
If it fails to hold 24,500 and especially 24,334 - recent swing low, then downside continuation may come.
✅ If you like my analysis, please follow me as a token of appreciation :)
in.tradingview.com/u/SatpalS/
📌 For learning and educational purposes only, not a recommendation. Please consult your financial advisor before investing.
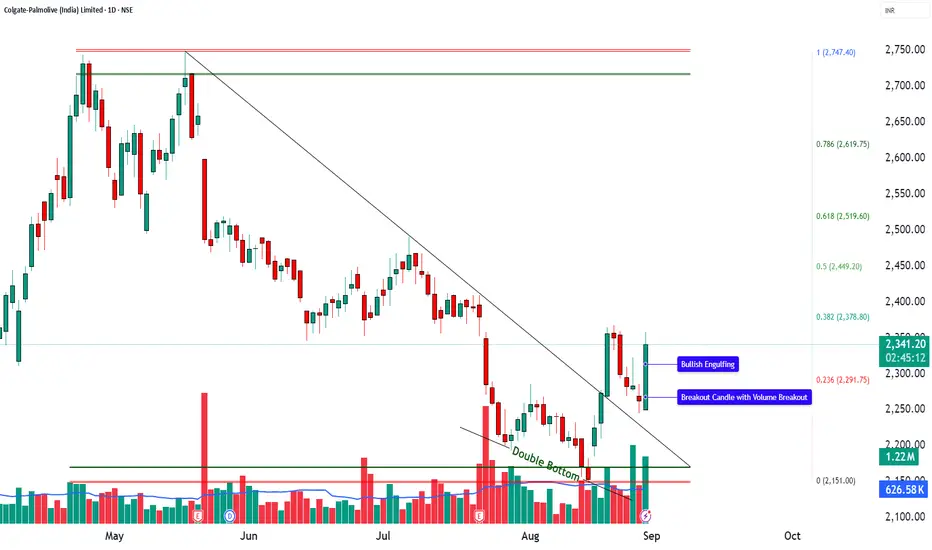
COLPAL | Double Bottom Retest + Volume Breakout🚀 COLPAL | Double Bottom Retest + Volume Breakout
📌 Pattern Setup:
🔹 Double Bottom retest spotted
🔹 Bullish Engulfing candle at support
🔹 Breakout candle with strong volume surge
📊 Technical Snapshot:
RSI: 58 → Healthy momentum
MACD: Bullish crossover
CCI: 107 → Strong positive bias
Stochastic: 89 → Overbought but strong
Volume: 1.22M vs 626k avg → ⚡ Breakout confirmed
🛠 Levels to Watch:
🔼 Long Entry: Above 2357.9
🔽 Stoploss: Below 2243
🎯 Targets: 2472 | 2587
📉 Pullback Buy Zone: 2291–2273
❌ Invalidation: Below 2207
⚡ Resistance Levels: 2382 | 2424 | 2490
⚡ Support Levels: 2274 | 2208 | 2167
🎯 Fibonacci Zones: 2378 → 2449 → 2519 → 2619 → 2747
💡 View:
COLPAL is breaking out from a Double Bottom Retest with strong volume & bullish signals. Sustaining above 2358 could open the gates towards 2472 – 2587 in the short term.
👉 Bias: Bullish till 2207 holds.
⚠️ Disclaimer – Please Read Carefully
The information shared here is meant purely for learning and awareness. It is not a buy or sell recommendation and should not be taken as investment advice. I am not a SEBI-registered investment advisor, and all views expressed are based on personal study, chart patterns, and publicly available market data.
Trading — whether in stocks or options — carries risk. Markets can move unexpectedly, and losses can sometimes exceed the money you have invested. Past performance or past setups do not guarantee future results.
If you are a beginner, treat this as a guide to understand how the market works — practice on paper trades before risking real money. If you are experienced, always assess your own risk, position sizing, and strategy suitability before entering trades.
Consult a SEBI-registered financial advisor before making any real trading decision. By engaging with this content, you acknowledge full responsibility for your trades and investments.
💬 Found this useful?
🔼 Give this post a Boost to help more traders discover clean, structured learning.
✍️ Drop your thoughts, questions, or setups in the comments — let’s grow together!
🔁 Share with fellow traders and beginners to spread awareness.
👉 “If you liked this breakdown, follow for more clean, structured setups with discipline at the core.”
🚀 Stay Calm. Stay Clean. Trade With Patience.
Trade Smart | Learn Zones | Be Self-Reliant 📊
#NIFTY Intraday Support and Resistance Levels - 29/08/2025Nifty is expected to open with a slight gap-up today, providing some relief to traders after yesterday’s weak close. The index is currently trading around the 24,500 zone, which will act as a crucial pivot level for the day. If Nifty sustains above 24,500–24,550, a recovery move may unfold with upside targets at 24,650, 24,700, and 24,750+. A sustained breakout above 24,750 will open the door for further bullish momentum and could extend the rally.
On the downside, if Nifty fails to hold the 24,500 mark and slips below 24,450, selling pressure may intensify. A breakdown here can push the index lower toward 24,350, 24,300, and 24,250 levels. Traders should closely watch intraday price action as volatility is likely to remain high, especially near these support and resistance zones.
Overall, Nifty’s trend remains slightly positive at open, but sustainability above 24,550 is the key for any meaningful upside. Traders should manage risk with strict stop losses and look for confirmation before entering trades.
[INTRADAY] #BANKNIFTY PE & CE Levels(29/08/2025)Bank Nifty is likely to witness a slightly gap-up opening today after a weak closing in the previous session. The index is currently hovering near the 53,900 zone, which is a key support area for intraday sentiment. If Bank Nifty sustains above 54,050, it may trigger a short-term correction rally, paving the way for an upside move toward 54,250, 54,350, and 54,450+. This zone will act as a crucial resistance, and only a strong breakout above it can confirm further recovery.
On the downside, failure to hold 54,000–53,950 levels may keep the pressure intact. A breakdown below 53,950 could extend the fall toward 53,750, 53,650, and 53,550. Traders should remain cautious as volatility is expected, and intraday price action near these levels will decide the direction for the day.
Overall, Bank Nifty remains in a weak-to-neutral zone, but a sustained close above 54,050 may provide relief for bulls. Traders are advised to maintain strict stop losses and look for opportunities in line with intraday momentum.
BTCUSD Long Setup – Trend Continuation Play📌 Trade Details
Entry: 113,256.5
Target: 115,317.7
Stop Loss: 111,874.4
📊 Trade Rationale
✅ Trend Continuation: Price has respected the ascending trendline multiple times, indicating strong buyer interest.
✅ Break of Structure: Recent higher highs and higher lows confirm bullish momentum.
✅ Support Flip: Zone around 113,050 acted as resistance earlier and is now being retested as support.
✅ Volume Confirmation: Rising volume supports the bullish continuation bias.
✅ Clean Risk–Reward: With SL below structure and TP near major resistance, this setup offers a favorable RRR.
🎯 Target Zone
The target aligns with the next strong supply zone at 115,300+, where sellers may re-enter.
⚠️ Risk Management
Always size positions wisely, as crypto remains highly volatile. Protect your capital first.
Disclaimer:
This idea is for educational purposes only and not financial advice. Do your own research before entering any trade.

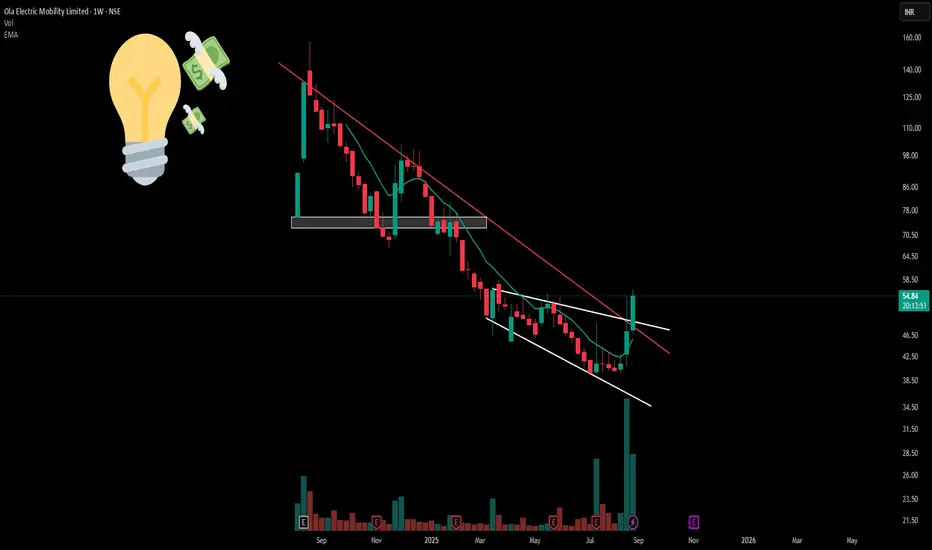
OLA : Simple Channels and Exceptional Volume PatternsOla Electric (NSE: OLAELEC) displays a descending channel pattern with the red resistance trendline providing consistent overhead resistance. The stock has operated within this falling channel structure since peak levels, creating defined technical boundaries.
A broadening formation is evident through white trendlines showing expanding volatility ranges.
Exceptional volume expansion compared to historical averages. Combined NSE+BSE volumes substantially exceed normal ranges, indicating institutional participation rather than retail activity.
Disclaimer: Educational content only. Not investment advice. Trading involves substantial risk. Technical patterns don't guarantee outcomes. Consult qualified advisors before investing.
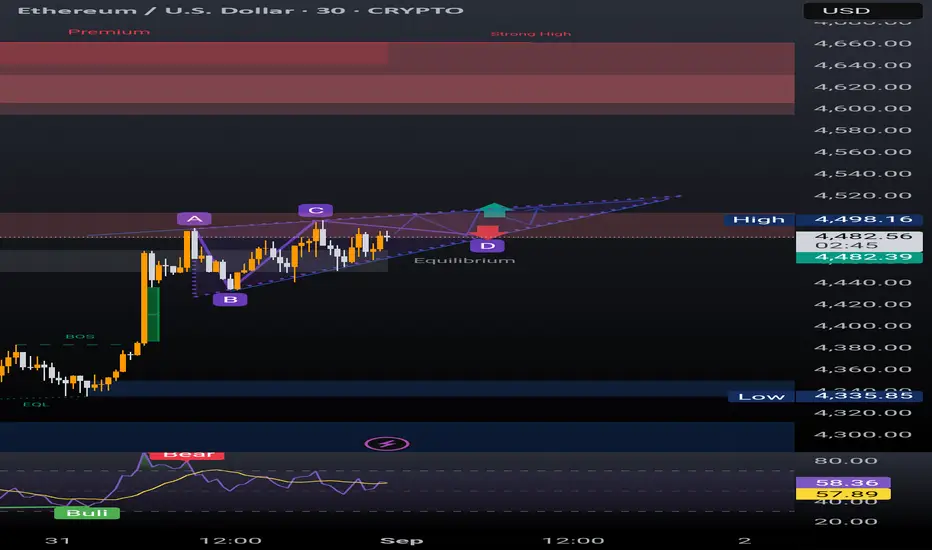
Fibonacci Trailing : Lock Profits & Ride Trends [BANKNIFTY]🔹 Intro / Overview
Managing trades after entry is just as critical as spotting the entry itself.
In this idea, we apply Fibonacci retracements with a trailing stop system to capture profits while staying disciplined.
A well-structured trailing plan helps traders:
✅ Lock in gains early
🛡️ Protect capital against reversals
📊 Stay rule-based instead of emotional
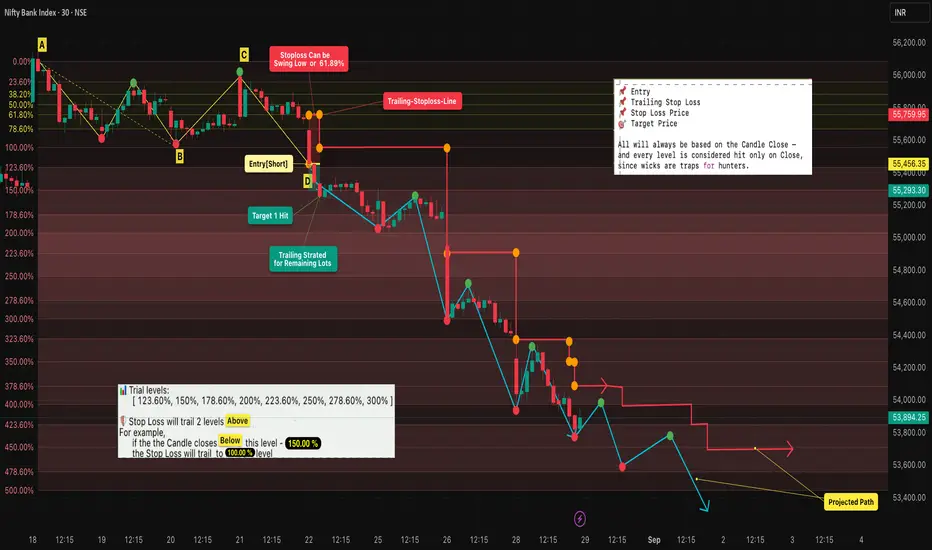
📈 In this case study, BANKNIFTY aligned well with Fibonacci retracement levels , showcasing how these concepts can work in practice as an educational example.
---
📖 Concept
- A swing High (A) to Low (B) defines our Fibonacci retracement zones.
- Retracements (C) test Fibonacci levels but don’t confirm entry until structure is validated.
- Entry (D) occurs only after a successive close confirms the short trade.
- Stop Loss (SL) is placed at the 61.8% retracement (closer and more protective than the far swing).
- Trailing: SL trails forward only , two Fib levels behind price. It manages the remaining position after booking partial profits.
---
📊 Chart Explanation (Step-by-Step)
1️⃣ Swing Definition
📍 A = Swing High
📍 B = Swing Low
2️⃣ Retracement Testing
- C → first retracement (no confirmation) - Here there's a retracement but due to the candle closes below the 38.20% level so devalidation doesn't occured.
3️⃣ Entry Point
✅ At D, successive closes confirm → short entry taken
4️⃣ Stop Loss (SL)
📉 Set at 61.8% retracement for tighter risk management
5️⃣ Targets & Trailing
🎯 Target 1 hit → exit one lot, secure partial profits
🔄 Remaining lots managed with trailing system:
• SL adjusted only forward , never backward
• SL trails as price moves down:
• 150% → SL to 100%
• 178.6% → SL to 123.6%
• 200% → SL to 150%, etc.
6️⃣ Projected Path
🔍 Blue/red paths illustrate how price could move while trailing locks in gains
---
🔍 Observations
📌 Entry validated on structure → reduces false signals
🎯 Booking partial profits builds confidence and ensures realized gains
🔄 Trailing maximizes potential while staying safe
📊 Fib-based progression keeps decisions mechanical, not emotional
---
✨ Why It Matters
✔ Turns static Fibonacci into a dynamic strategy
✔ Prevents giving back profits when trends reverse
✔ Adds confidence and discipline in trade management
✔ Teaches how to scale out smartly
---
✅ Conclusion
Fibonacci retracement alone gives levels — but combining it with a trailing stop system transforms it into a complete trade plan.
By booking partial profits and trailing the rest:
🛡️ You protect capital
🚀 You ride trends longer
🤝 You trade with discipline instead of emotion
---
⚠️ Disclaimer
For educational purposes only · Not SEBI registered · Not a buy/sell recommendation · No investment advice — purely a learning resource
XAUUSD: Maintaining Support, Gold Aims for New Highs!Based on the latest data and chart for XAUUSD, it can be seen that gold is in an uptrend after holding strong above the key support level at 3,373.70. The chart indicates that if gold maintains above this support zone, the next target will be 3,413.00, with the potential to continue rising higher if the current support area is not broken.
Technical Analysis: XAUUSD is currently trading near the support zone at 3,373.70 and resistance at 3,413.00. If the price remains above 3,373.70, the uptrend will continue with the target at 3,413.00. The nearest support levels are 3,373.70 and 3,362.00.
Fundamental Signals: Weaker economic data from the U.S., especially the higher-than-expected PCE index and lower-than-expected jobless claims, have increased expectations that the Fed will cut interest rates. This has put pressure on the USD and supported gold’s recovery.

SBINSBIN is looking good.
It gave a clean breakout above an old resistance zone. After the breakout, it pulled back to retest the level, and during this retest it respected the previous swing low at ₹781.70. Not breaching this level shows strong demand holding.
It is moving above all key EMAs, more importantly it is moving above 200ema for the last 3 months - which confirms the strength of the broader uptrend.
Volume is good and this reduces the there is probability of a false breakout.
In between it may halt around 858, 880 and 894, previous resistance levels.
✅ If you like my analysis, please follow me as a token of appreciation :)
in.tradingview.com/u/SatpalS/
📌 For learning and educational purposes only, not a recommendation. Please consult your financial advisor before investing.

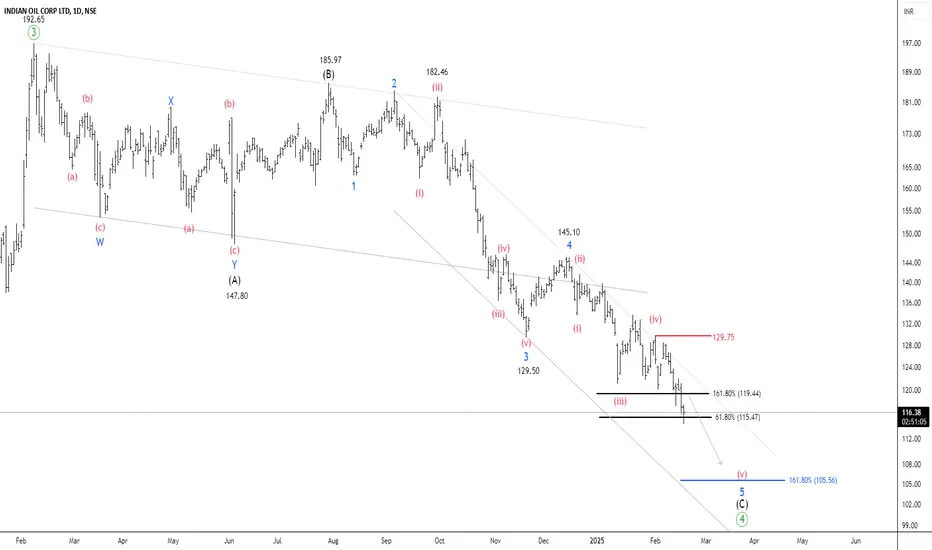
NSE IOC – Approaching a Key Demand ZoneTimeframe: Daily
After reaching a high of 196.8, the price has declined by over 39% in 13 weeks. It is currently trading below the 50/100 EMA band, with ATR at 3.68 and ADX at 26.02 . According to the Elliott Wave projection, the peak of 196.80 can be identified as a wave ((3)). The security is currently undergoing the formation of a corrective wave (4).
Wave (B) formed at 185.97 , while wave 4 of wave (C) was completed at 145.10 . NSE IOC is now setting up for the final wave 5 of wave (C).
Two key Fibonacci relationships help estimate the end of the correction:
1.618 Fibonacci extension of wave (A) at 106.54 (for wave C)
0.618 Fibonacci extension of wave 1 at 115.52 (for wave 5)
The price is expected to settle between 115 and 105 , which serves as a key demand zone for buyers. If the price breaks out and sustains above 129.75, traders can target the following levels: 139 – 156 – 172+.
we will update further information soon.
#NIFTY Intraday Support and Resistance Levels - 28/08/2025Nifty is expected to open with a gap-down today, indicating weak sentiment after a sharp decline in the previous session. The index is currently trading near the 24,700 zone, which will act as a critical intraday pivot level. Sustained movement below 24,700 may invite further selling pressure, with immediate downside targets placed at 24,600, 24,550, and 24,500. A decisive break below 24,500 could intensify bearish momentum, dragging the index towards 24,350–24,250 levels in the short term.
On the upside, recovery signs will only emerge if Nifty manages to hold above 24,750. A strong move above this level may trigger a bounce, with upside targets at 24,850, 24,900, and 24,950+. However, given the broader weakness, such up-moves may face stiff resistance at higher levels.
Overall, the bias remains negative for the day, with traders advised to stay cautious and follow strict risk management. Intraday volatility is likely to remain high, making it important to track price action around the key support and resistance zones.

[INTRADAY] #BANKNIFTY PE & CE Levels(28/08/2025)Bank Nifty is expected to witness a gap-down opening today, reflecting weakness in sentiment as the index continues to face selling pressure. The price action has slipped below the 54,450–54,400 zone, which now acts as a crucial resistance level for the day. Sustained trading below this zone may trigger further downside moves, with immediate support seen at 54,250 and 54,150. A break below these levels could accelerate weakness toward 54,050 and extend further toward 53,750–53,550 zones.
On the upside, recovery attempts will gain strength only if Bank Nifty manages to reclaim 54,550–54,600 levels. In such a case, a pullback rally could push the index towards 54,750, 54,850, and 54,950. However, this zone is likely to act as a strong hurdle unless broader sentiment improves.
Overall, the bias remains negative as long as the index trades below 54,450, with traders advised to maintain a cautious approach. Intraday moves are expected to remain volatile, and strict risk management will be key to navigating today’s session.

Is Gold's Bullish Trend Here to Stay?On the chart, gold has broken through the previous small downtrend channel, opening up new opportunities for a rally. The $3,360 level has become a key support, while the nearest resistance targets are at $3,430 and $3,458. The current price structure shows a clear "break & retest" scenario, with buying momentum dominating as gold stays above key EMA levels.
Supporting News for Gold's Bullish Trend:
The weakening USD, declining U.S. bond yields, rising geopolitical tensions, and the potential for a Fed rate cut have created favorable conditions for gold's upward movement. Fed Chairman Jerome Powell's comments at Jackson Hole signaled that the Fed could ease tightening if the labor market weakens, strongly supporting gold's bullish trend.
Trading Strategy:
Buy on dip around $3,360–$3,365.
Target at $3,430 and $3,458.
Stop-loss below $3,350 to manage risk.
If the Fed maintains its dovish tone and the USD remains weak, gold is likely to continue its upward momentum in the short term, opening the door for higher price levels in September.
