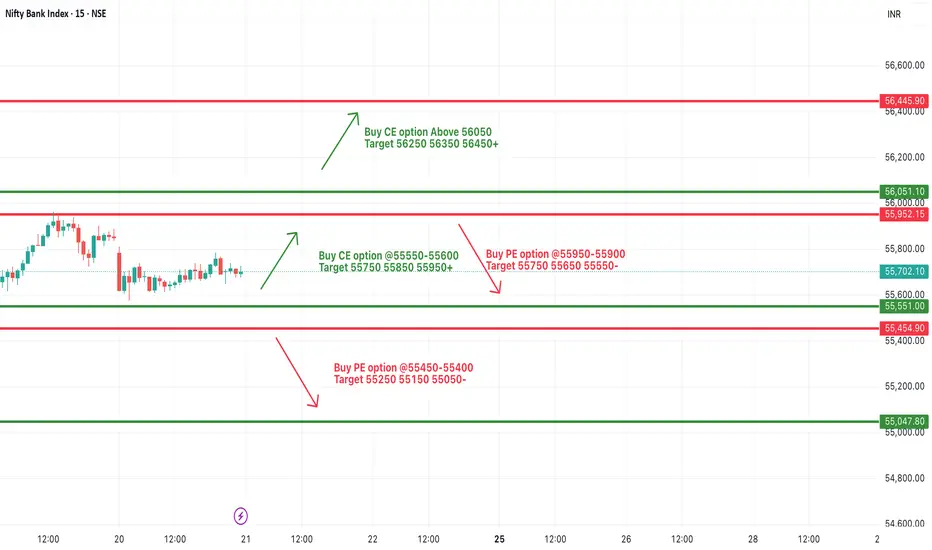
[INTRADAY] #BANKNIFTY PE & CE Levels(21/08/2025)Bank Nifty is expected to open with a slight gap-up today, but overall, no major changes are seen in the levels compared to yesterday due to continued consolidation. The index has been trading in a narrow range, indicating indecisiveness among participants, and today’s move will likely depend on a breakout or breakdown from these consolidation levels.
On the upside, fresh buying can be initiated if Bank Nifty sustains above 55,550–55,600. This could trigger an upside move toward 55,750, 55,850, and 55,950+. A further breakout above 56,050 will strengthen the momentum, opening the path toward 56,250, 56,350, and 56,450+.
On the downside, weakness will only be confirmed if Bank Nifty slips below 55,450–55,400. In that case, targets of 55,250, 55,150, and 55,050 can be expected. A deeper fall may occur if the index sustains below 55,000, which will invite further selling pressure.
Since the market is consolidating, traders should focus on quick intraday trades with strict stop-losses and wait for a decisive move for positional trades.
Technical Analysis
PERSISTENT – Bullish Engulfing + RSI Breakout📊 PERSISTENT – Technical & Educational Snapshot
Ticker: NSE: PERSISTENT | Sector: 💻 IT Services
CMP: ₹ ▲ (as of 20 Aug 2025)
Rating (for learning purpose): ⭐⭐⭐⭐
Pattern Observed: 📈 Bullish Engulfing + RSI Breakout
PERSISTENT is displaying strong bullish momentum across multiple technical indicators. The presence of a strong bullish candle with Open = Low, combined with an RSI breakout, highlights aggressive buying pressure. A Bullish Engulfing pattern further supports the continuation bias. Meanwhile, the Bollinger Band Squeeze-Off suggests increased volatility with a likely breakout on the upside. Together with a volume-supported move, these signals indicate strength in the trend.
📊 Volume Check:
🔹 Current Volume: 628.85k
🔹 20SMA Volume: 604.21k ✅
💥 Above average – confirming genuine buying interest!
💡 Learnings:
Bullish engulfing + Open=Low candles often signal strong buyer dominance.
RSI breakouts are stronger when paired with above-average volumes.
Bollinger Band squeeze-offs frequently precede powerful directional moves.
Defining pullback areas and invalidation levels helps structure risk management.
Key Levels:
Resistance: 5410 | 5475 | 5580
Support: 5240 | 5135 | 5070
Pullback Level: 5284
Invalidation Level: Close below 5008
STWP Trade Setup:
Entry (Long): Above 5370
Stop Loss: 5173 or below
Reference Levels: 5566 | 5763
⚠️ Disclaimer – Please Read Carefully
The information shared here is meant purely for learning and awareness. It is not a buy or sell recommendation and should not be taken as investment advice. I am not a SEBI-registered investment advisor, and all views expressed are based on personal study, chart patterns, and publicly available market data.
Trading — whether in stocks or options — carries risk. Markets can move unexpectedly, and losses can sometimes be larger than the money you have invested. Past performance or past setups do not guarantee future results.
If you are a beginner, treat this as a guide to understand how the market works — practice on paper trades before risking real money. If you are an experienced trader, remember to assess your own risk, position sizing, and strategy suitability before entering any trade.
Consult a SEBI-registered financial advisor before making any real trading decision.
By reading, watching, or engaging with this content, you acknowledge that you take full responsibility for your own trades and investments.
💬 Found this useful?
🔼 Give this post a Boost to help more traders discover clean, structured learning.
✍️ Drop your thoughts, questions, or setups in the comments — let’s grow together!
🔁 Share with fellow traders and beginners to spread awareness.
✅ Follow simpletradewithpatience for beginner-friendly setups, price action insights & disciplined trading content.
🚀 Stay Calm. Stay Clean. Trade With Patience.
Trade Smart | Learn Zones | Be Self-Reliant 📊

BTC Consolidating, Ready to Blast Towards 130K?BTC/USDT is still holding within its uptrend channel , with strong support around 112.3K and key resistance at 123K–125K. After hitting an all-time high near 124.5K, the price pulled back to 112–115K for consolidation, building a base for the next rally.
On the news side, the market is getting strong support as the US officially allows Bitcoin in 401(k) retirement plans and has set up a Strategic Bitcoin Reserve . At the same time, spot Bitcoin ETFs continue to attract massive inflows, pushing total assets above $150 billion in just 18 months. This shows rising institutional confidence, despite short-term corrections.
The preferred scenario now is to look for buy opportunities around 112–115K , targeting a rebound to 123–125K, and if that breaks, the next destination could be 130–135K.
On the flip side, a defensive strategy should be considered if BTC falls below 110K, as this is a crucial level for maintaining the medium-term uptrend.

Gold Price Awaits FOMC – Liquidity Levels in PlayGold price continued to slide into liquidity zones during the late US session yesterday and reacted perfectly at the MMFLOW BUY ZONE 3314 – 3316, delivering over +70 pips profit to traders ✅.
At present, on M5–M15, Gold is showing signs of a short-term recovery. However, for a strong upside move, buyers must break through the 3320 – 3322 resistance zone. A confirmed breakout here could trigger momentum towards higher KeyLevels, allowing price to retest important supply zones.
📈 Upside Targets (Intraday): 333x and 334x remain the key areas to watch for take-profits or potential reversal setups.
🔔 Why This Week Matters – The FOMC Decision
The highlight of the week is the FOMC meeting during the US session. Markets are awaiting clarity on the Fed’s next move. Any hint towards a September rate cut could trigger massive bullish momentum, breaking Gold out of its corrective channel.
👉 Asian & European sessions: Focus remains bullish toward 333x – 334x, with potential SELL setups at resistance.
⚠️ US session with FOMC: Expect extreme volatility – risk management is critical.
📉 MMFLOW Technical Trading Plan
🔹 BUY Scalp Setup
Entry: 3311 – 3309
SL: 3305
TP: 3315 → 3320 → 3325 → 3330 → 3340 → 3350 → 3360+
🔹 BUY Zone (FOMC Plan)
Entry: 3290 – 3288
SL: 3282
TP: 3295 → 3330 → 3335 → 3340 → 3350 → 3360 → 3370+
🔸 SELL Scalp Setup
Entry: 3342 – 3344
SL: 3348
TP: 3338 → 3332 → 3328 → 3324 → 3320
🔸 SELL Zone (FOMC Plan)
Entry: 3360 – 3362
SL: 3368
TP: 3355 → 3350 → 3345 → 3340 → 3330
⚠️ Key Notes for Indian Traders
FOMC = high volatility event – manage your exposure carefully.
Stick to strict TP/SL discipline to protect capital.
Smart traders know: KeyLevels = Profits ✅
🔥 Follow MMFLOW TRADING for daily Gold price analysis, liquidity maps, and Smart Money insights – designed for Forex & Gold traders in India.

How to read market TOPS like a pro : Double & Triple TopsIn this video I will breakdown about the concepts of Double and triple tops, they aren’t just reversal signals — they’re blueprints of future price action. Here’s how to read market tops like a pro and anticipate what comes next.

Gold breaks downtrend channel, next target lower!Gold is currently trading within a clear downtrend channel, marked by lower highs and lower lows. After multiple rejections at the upper boundary of the channel, gold has begun its downward trend towards key support levels.
From a technical standpoint, the recent pullback and structural breakdown indicate that the market may continue its bearish trend. Last week's PPI data showed a 0.9% increase , exceeding expectations, which has strengthened the USD and added pressure on gold. This news reduces expectations for aggressive Fed rate cuts , further strengthening the dollar and diminishing gold's appeal as a safe-haven asset.
Looking at the chart, we can identify key support levels to monitor. The first target is around 3,311.000, with the potential to continue falling to 3,287.800 if price breaks below the near-term support at 3,310.000.
Key Levels:
Resistance: 3,355.700 (Upper boundary of the downtrend channel)
Support: 3,311.000, 3,287.800
Next Target (TP1): 3,311.000
Next Target (TP2): 3,287.800
My Advice:
With the bearish structure on the chart and the pressure from the PPI data, the outlook for gold remains to the downside. I recommend looking for short opportunities near 3,355.700, with stops above resistance and targets at 3,311.000 and 3,287.800.

[INTRADAY] #BANKNIFTY PE & CE Levels(20/08/2025)Bank Nifty is expected to open flat today, suggesting a cautious start after recent moves. On the upside, a breakout above 55,550–55,600 could trigger a rally towards 55,750, 55,850, and 55,950+, while a strong move above 56,050 may extend gains to 56,250, 56,350, and 56,450+. On the downside, if Bank Nifty slips below 55,950–55,900, it may see a corrective move towards 55,750, 55,650, and 55,550-. Further weakness will be confirmed only below 55,450, which could drag it down to 55,250, 55,150, and 55,050-.

Effective and Widely Used Trading StrategiesTrend Following Strategy
Definition: Trading according to the market trend, buying when the trend is up and selling when the trend is down.
How to Implement: Use technical analysis tools like Moving Averages (MA), RSI, and MACD to identify the market trend. One simple strategy is to trade long when the price is above the moving average (MA), and trade short when the price is below the MA.
Why it Works: The Forex market often has strong trends, which increases the chances of success.
Reversal Trading Strategy
Definition: Finding trading opportunities when the price shows signs of reversing after a strong trend.
How to Implement: Use indicators like RSI, Stochastic Oscillator, or reversal candlestick patterns (such as Doji, Engulfing) to identify reversal points. When the indicators show overbought or oversold conditions, you can place a sell order (if overbought) or a buy order (if oversold).
Why it Works: The market can reverse sharply after a long trend, offering high-profit opportunities when entering at the right reversal point.
News Trading Strategy
Definition: Trading based on major news events, such as interest rate announcements, GDP reports, or employment data.
How to Implement: You need to monitor economic events such as interest rate announcements, GDP reports, employment data (Non-Farm Payrolls), and inflation indices (CPI) to make trading decisions. Usually, before and after important news, the price will experience significant volatility.
Why it Works: News can cause strong market movements, creating high potential profit opportunities if you predict correctly.
Would you like to learn more about any specific strategy? Please leave a comment below to discuss with us.

EURUSD: Support About to Break, Bearish Trend Continues!EURUSD is currently trading in a clear downward channel. After failing to break the resistance at 1.17200, the price reversed and is now testing support at 1.16000. If this support is broken, the price may continue to decline towards 1.16297 and 1.15500.
The current market structure shows that selling pressure is dominant. If 1.16000 is broken, the bearish trend will continue. Traders should prepare to enter a sell position if this support level is broken, with targets towards lower support levels.

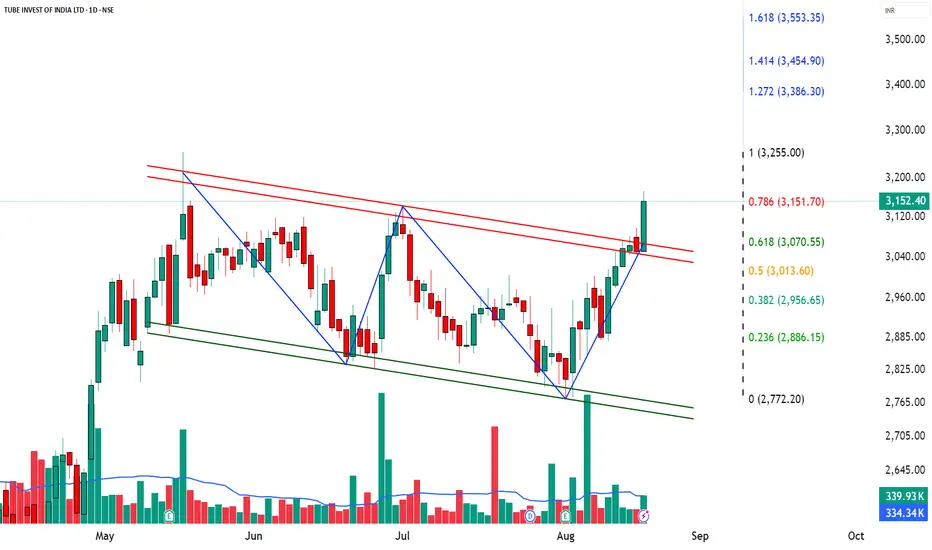
TIINDIA – Technical & Educational Snapshot📊 TIINDIA – Technical & Educational Snapshot
Ticker: NSE: TIINDIA | Sector: 🏭 Industrial Manufacturing
CMP: ₹ ▲ (as of 20 Aug 2025)
Rating (for learning purpose): ⭐⭐⭐⭐
Pattern Observed: 📈 Channel Breakout
TIINDIA is showing strong bullish momentum across multiple technical indicators. The presence of a strong bullish candle, combined with an RSI breakout at 68, indicates significant buying pressure. The Bollinger Band breakout and BB Squeeze-Off suggest increased volatility and the potential for a strong upward move. Bullish VWAP confirms the trend is supported by average price strength, while MACD bullish, CCI at 178, and Stochastic at 95 all point to strong near-term momentum, signaling a likely continuation of the upward trend.
📊 Volume Check:
🔹 Current Volume: 339.93k
🔹 20SMA Volume: 334.34k ✅
💥 Slightly above average – confirming possible buying interest!
💡 Learnings:
Breakouts with above-average volume are more reliable as they indicate real buying interest.
RSI, MACD, CCI, and Stochastic together provide a strong confirmation of momentum.
Bollinger Band squeeze-offs often precede strong directional moves – a good cue for potential entry. Identifying pullback areas and invalidation levels helps manage risk effectively.
Key Levels:
Resistance: 3200 | 3248 | 3323
Support: 3077 | 3002 | 2954
Pullback Area: 3013–3070
Invalidation Level: Close below 2956
STWP Trade Setup:
Entry (Long): Above 3172.90
Stop Loss: 3039.80 or below
Reference Levels: 3306 | 3439
⚠️ Disclaimer – Please Read Carefully
The information shared here is meant purely for learning and awareness. It is not a buy or sell recommendation and should not be taken as investment advice. I am not a SEBI-registered investment advisor, and all views expressed are based on personal study, chart patterns, and publicly available market data.
Trading — whether in stocks or options — carries risk. Markets can move unexpectedly, and losses can sometimes be larger than the money you have invested. Past performance or past setups do not guarantee future results.
If you are a beginner, treat this as a guide to understand how the market works — practice on paper trades before risking real money. If you are an experienced trader, remember to assess your own risk, position sizing, and strategy suitability before entering any trade.
Consult a SEBI-registered financial advisor before making any real trading decision.
By reading, watching, or engaging with this content, you acknowledge that you take full responsibility for your own trades and investments.
💬 Found this useful?
🔼 Give this post a Boost to help more traders discover clean, structured learning.
✍️ Drop your thoughts, questions, or setups in the comments — let’s grow together!
🔁 Share with fellow traders and beginners to spread awareness.
✅ Follow simpletradewithpatience for beginner-friendly setups, price action insights & disciplined trading content.
🚀 Stay Calm. Stay Clean. Trade With Patience.
Trade Smart | Learn Zones | Be Self-Reliant 📊
TATA MOTORS – Technical & Educational Snapshot📊 TATA MOTORS – Technical & Educational Snapshot
Ticker: NSE: TATAMOTORS | Sector: 🚗 Automobiles
CMP: ₹ ▲ (as of 20 Aug 2025)
Rating (for learning purpose): ⭐⭐⭐⭐
Pattern Observed: 📈 Channel Breakout
Tata Motors is showing strong bullish signals across multiple technical indicators. The RSI has broken out to 62, reflecting healthy buying momentum without being overbought, while the MACD remains bullish, confirming upward momentum. The SuperTrend and VWAP are both bullish, supporting the upward trend, and the CCI at 98 along with a Stochastic of 96 indicate strong near-term strength. Additionally, the Bollinger Band squeeze has released, suggesting increased volatility and a likely breakout. Altogether, these signals point toward a potential continuation of the bullish move in the near term.
Key Levels:
Resistance: 711 | 722 | 742
Support: 681 | 662 | 651
Pullback Area: 671–685
Invalidation level: 654
STWP Trade Analysis:
Entry (Long): Above 703.35
Stop Loss: 656 or below
Reference Levels: 750 | 796
⚠️ Disclaimer – Please Read Carefully
The information shared here is meant purely for learning and awareness. It is not a buy or sell recommendation and should not be taken as investment advice. I am not a SEBI-registered investment advisor, and all views expressed are based on personal study, chart patterns, and publicly available market data.
Trading — whether in stocks or options — carries risk. Markets can move unexpectedly, and losses can sometimes be larger than the money you have invested. Past performance or past setups do not guarantee future results.
If you are a beginner, treat this as a guide to understand how the market works — practice on paper trades before risking real money. If you are an experienced trader, remember to assess your own risk, position sizing, and strategy suitability before entering any trade.
Consult a SEBI-registered financial advisor before making any real trading decision.
By reading, watching, or engaging with this content, you acknowledge that you take full responsibility for your own trades and investments.
💬 Found this useful?
🔼 Give this post a Boost to help more traders discover clean, structured learning.
✍️ Drop your thoughts, questions, or setups in the comments — let’s grow together!
🔁 Share with fellow traders and beginners to spread awareness.
✅ Follow simpletradewithpatience for beginner-friendly setups, price action insights & disciplined trading content.
🚀 Stay Calm. Stay Clean. Trade With Patience.
Trade Smart | Learn Zones | Be Self-Reliant 📊

ABCAPITAL(cup& handle)My analysis is large capital company with good returns.
Key piont is Make cup and handle pattern look into chart how was possible to Target reach . Road map create for our target is 230, 300 but .. respect to SL .. LIKE ME .
Company has delivered good profit growth of 47.2% CAGR over last 5 years
Shareholding pattern (%)
As On Dec-23
Promoter 69.0 %
DII 8.4%
FII 10.6 %
Others 12.0 %
for MORE check in my TradingView ID
If You LIKE👌👌 MY Idea ......Boost.🔥🔥🔥.. its.
"Disclosure : I am not Sebi-registered." This channel is for only educational purpose. Any profit/loss, I am not responsible.
Before taking any trade on our charts / calls, please consult your financial advisors. Thanks🙏

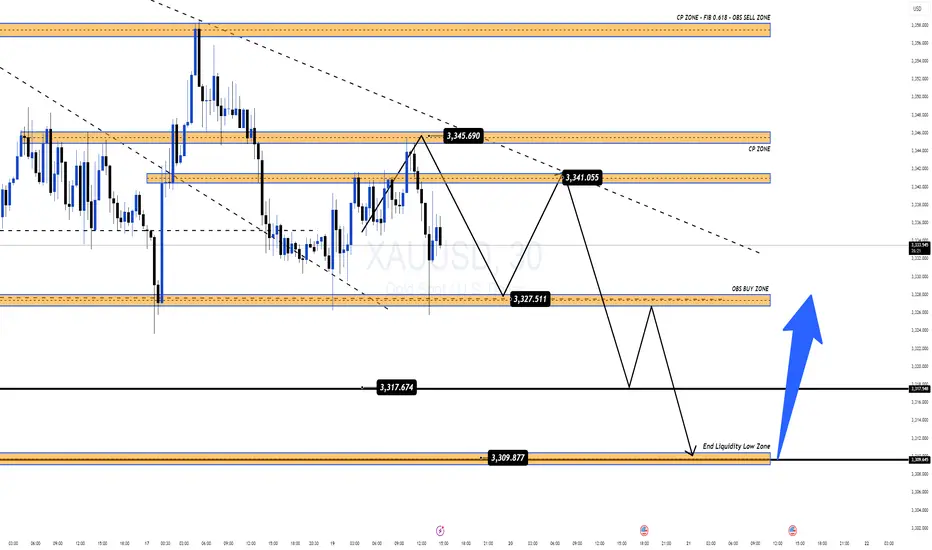
Gold Consolidates Ahead of FOMC Liquidity SweepGold is currently moving within a narrow range, with downside pressure becoming increasingly evident. With just over a day left before the FOMC meeting – an event that could shape the next major trend – the market seems to be preparing for a sharp liquidity sweep.
👉 At first glance, price action looks frustrating and unclear. But for traders following MMFLOW KeyLevels, this is actually the “golden range”, as key zones continue to hold with remarkable precision.
📉 Today’s Outlook
Main Trend: Ongoing corrective downside move.
Potential Scenario: A deep liquidity sweep towards the 331x zone before a strong bullish rebound.
🔑 Key Trading Levels
SELL Zone: 3340 – 3345 | Short SL: 4 – 5$
🎯 Targets: 3325 → 3317 → extended 3310
📌 Note: Manage risk tightly and watch reactions around KeyLevels – a single BreakOut move post-FOMC could unlock the next major opportunity.
✨ Once again: KeyLevels = Profits ✅
👉 Follow MMFLOW TRADING for daily KeyLevel strategies, liquidity maps & smart money insights
XAUUSD: Support Broken? Bearish Trend Continues!XAUUSD is currently trading in a clear downward channel on the H4 timeframe . After failing to break the resistance at 3,360 , the price reversed and is now testing the important support level at 3,320 . This support level has been tested multiple times in the past weeks. If this support is broken, the bearish trend could continue, with the next targets at 3,300 and 3,280.
The market structure remains weak, with lower highs and lower lows , confirming that the selling pressure is dominant. If the price fails to hold the 3,320 support level, the likelihood of further declines towards lower support levels is very high. It’s crucial to closely monitor price action at these support levels.
Stay tuned to market developments and prepare your trading strategy accordingly, as everything is shifting towards a stronger bearish move !

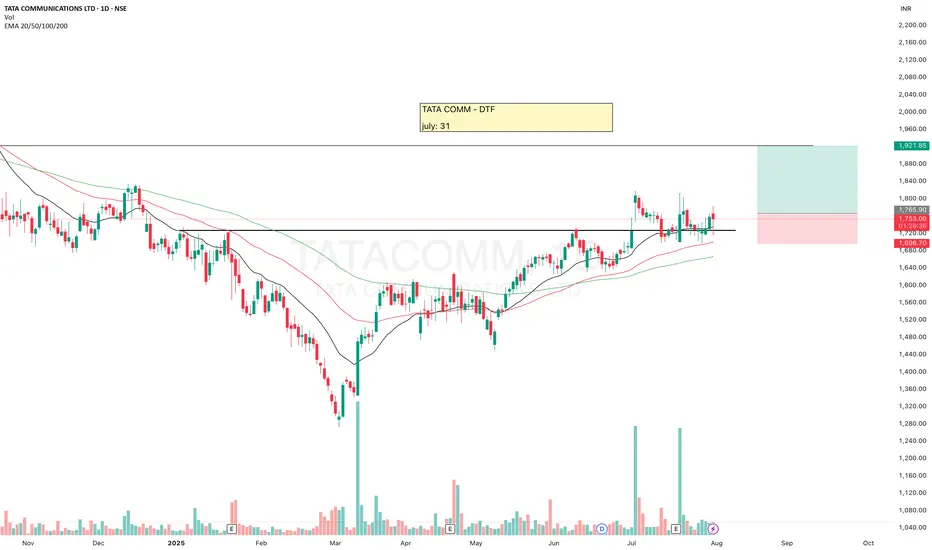
TATACOMMTATACOMM gave breakout after making HH-HL formation
Re-tested and now there is probability of an upside move. SL is must.
✅ If you like my analysis, please follow me here as a token of appreciation :)
in.tradingview.com/u/SatpalS/
📌 For learning and educational purposes only, not a recommendation. Please consult your financial advisor before investing.
GOLD Waiting for the Big BreakOut after FOMC This WeekGold Sideway Compression | Waiting for the Big BreakOut after FOMC This Week
Gold is currently consolidating in a tight range, building up energy for a major BreakOut. After the liquidity sweep at the weekly open, price fluctuated strongly between the 332x – 335x zone, but on the H1 timeframe, the overall trend still remains within a descending channel.
Last week, CPI & PPI data failed to deliver a clear direction. This week, all eyes are on the FOMC meeting, expected to provide stronger signals for gold’s next move.
⏳ Early to mid-week: with limited impactful news, gold may continue to sideway within the narrow range or maintain downside pressure until FOMC is released.
🔑 Key Market Levels
Resistance: 3357 – 3369 – 3383 – 3398
Support: 3335 – 3317 – 3309
📌 Trading Setup
✅ BUY Zone: 3334 – 3332
SL: 3328
TP: 3338 – 3342 – 3346 – 3350 – 3355 – 3360 – 3370 – 3380
👉 If gold breaks the descending channel around 336x, expect a strong move towards 3383 – 3398.
✅ SELL Zone: 3383 – 3385
SL: 3390
TP: 3378 – 3374 – 3370 – 3360 – 3350
👉 If gold fails at higher resistance and reverses, liquidity may be swept back into 333x – 331x, with potential extension down to 329x.
⚠️ Summary
Gold is at a critical decision point: BreakOut or Breakdown.
Before FOMC: sideways / bearish bias within H1 channel.
After FOMC: expect a strong Pump or Dump to define the clear weekly trend.
🔥 Keep a close eye on reactions at KeyLevels (333x – 336x – 338x) to adjust trading strategy accordingly.

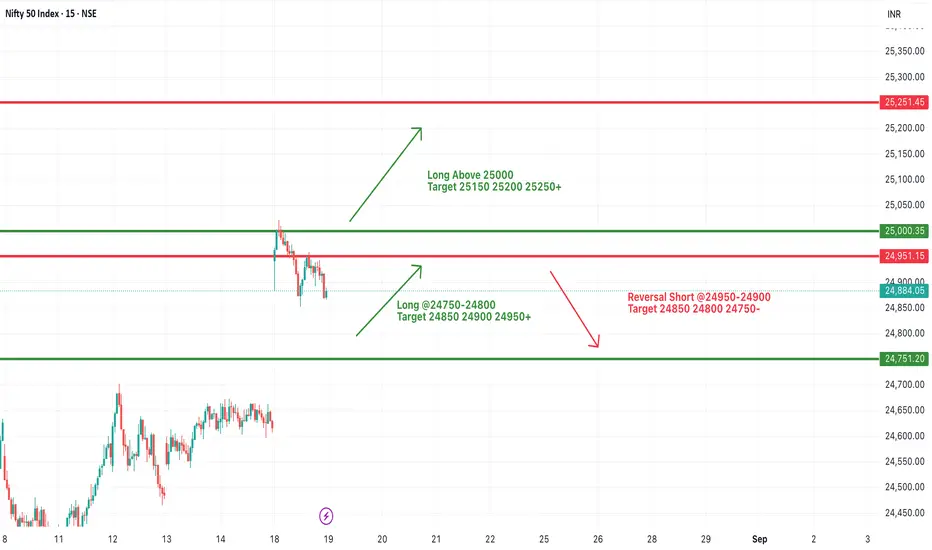
#NIFTY Intraday Support and Resistance Levels - 19/08/2025Nifty is expected to open with a gap-up today, reflecting positive sentiment in the market. If the index sustains above the 24,750–24,800 zone, fresh upside momentum can take it towards 24,850, 24,900, and 24,950+. A strong breakout above the 25,000 level may open the path for further targets at 25,150, 25,200, and 25,250+.
On the flip side, if Nifty faces rejection near 24,950–24,900, a reversal short opportunity may emerge, dragging it back towards 24,850, 24,800, and possibly 24,750-.
Overall, the bias remains positive with a gap-up start, but traders should keep a close eye on the 24,950–25,000 resistance zone for possible reversals.
[INTRADAY] #BANKNIFTY PE & CE Levels(19/08/2025)Bank Nifty is likely to open with a gap-up today, reflecting positive momentum from the previous session. If the index sustains above the 55,550–55,600 zone, further upside towards 55,750, 55,850, and 55,950+ can be expected. A breakout above 56,050 could trigger fresh buying momentum with potential targets of 56,250, 56,350, and 56,450+.
On the downside, immediate support lies near 55,950–55,900. If Bank Nifty fails to hold this zone, short opportunities may emerge with targets at 55,750, 55,650, and 55,550-. A deeper correction below 55,450–55,400 could extend the fall towards 55,250, 55,150, and 55,050-.
Overall, the trend is bullish with a gap-up start, but traders should watch for rejection at higher resistance levels and trade with strict stop losses to manage volatility.

BTCUSDT: Continued Growth in the Short TermBTCUSDT is currently trading within a stable price range, with a clear uptrend channel forming. After bouncing off the strong support at 116,000 USD, BTCUSDT is likely to continue its bullish momentum, with the first target set at 123,000 USD.
The latest news from the cryptocurrency market shows a growing confidence in Bitcoin, driven by positive signals from major financial institutions. Recent price corrections have created good buying opportunities for investors. The global economic situation, particularly the weakening of the USD and increasing institutional adoption of Bitcoin, is driving BTC's value higher.
Trading Strategy:
Buy: Enter a buy position when the price approaches the 116,000 USD support level again or breaks above 117,000 USD.
Stop-loss: Set a stop-loss below the 116,000 USD support level to protect in case of a reversal.
With the current market structure and supportive factors from both news and technical analysis, the bullish trend of BTCUSDT is highly likely to continue in the near term.

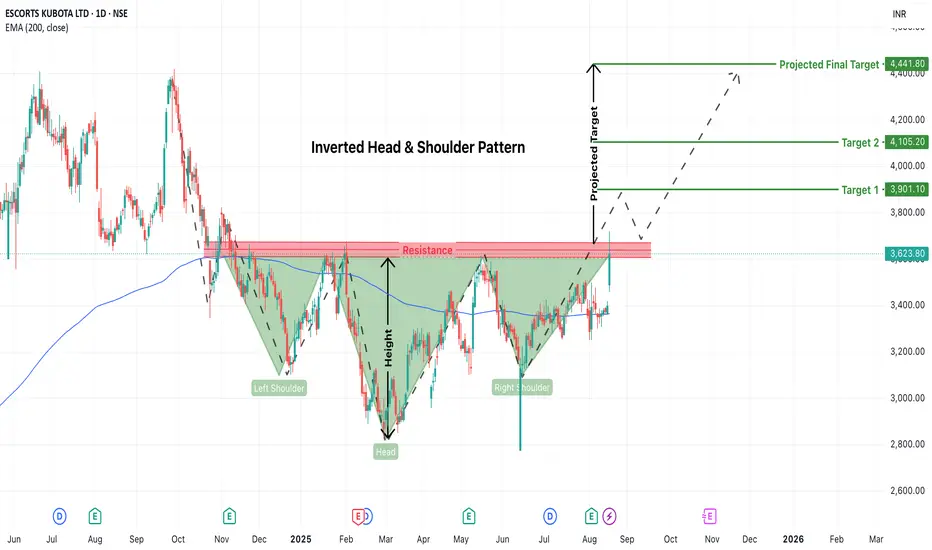
ESCORTS Potential Breakout Alert: Inverted Head & ShoulderThe chart of ESCORTS KUBOTA LTD (daily timeframe) is currently displaying a well-formed Inverted Head and Shoulder pattern, a powerful reversal setup often seen at the end of prolonged downtrends. This pattern suggests a shift in momentum from bearish to bullish—but the key breakout level still remains unconfirmed.
The left shoulder formed around November 2024, the head during March 2025, and the right shoulder recently shaped up through June and July 2025. The neckline resistance, drawn near the ₹3,580–₹3,620 zone, has been tested multiple times but has not yet been breached with conviction. A successful breakout above this resistance zone with strong volume would validate the pattern and signal a potential upside move.
At the moment, the price is hovering just around the neckline, attempting to build enough momentum to push through. This indicates a decision point—either the bulls gather strength to break out and push the stock higher, or the neckline acts as a ceiling, resulting in another round of consolidation or even a reversal.
Until confirmation, it remains a watchlist stock rather than an immediate entry.
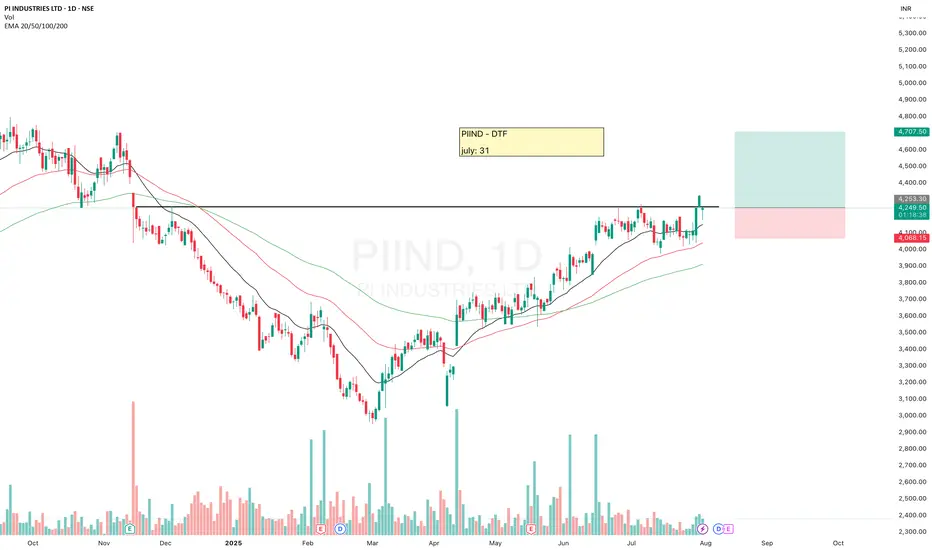
PIINDPIIND is looking good.
It has made HH-HL formation, moving above 20ema and breakout from here may give a good upside move. Keep eyes on it.
✅ If you like my analysis, please follow me here as a token of appreciation :)
in.tradingview.com/u/SatpalS/
📌 For learning and educational purposes only, not a recommendation. Please consult your financial advisor before investing.
EURUSD: Bearish OutlookFrom the chart, EURUSD is currently trading in an ascending price channel, but signs of a pullback have emerged from the 1.17300 level, suggesting a potential continuation of the decline in the short term. Recent economic data, particularly the PPI index from the U.S., has put significant pressure on the EUR, strengthening the USD and weakening the Euro. This may continue to maintain bearish pressure on EURUSD.
Technically, the key support level to watch is 1.16264. If this level breaks, EURUSD could continue to decline towards lower support levels such as 1.16000. Bearish signals from technical indicators also support this pullback.
Trading Strategy:
Sell: Wait for a break below 1.16264 to enter a short position, with the next target at 1.16000.
Stop-loss: Set a stop-loss above the resistance at 1.17300 to protect the account in case of a reversal.

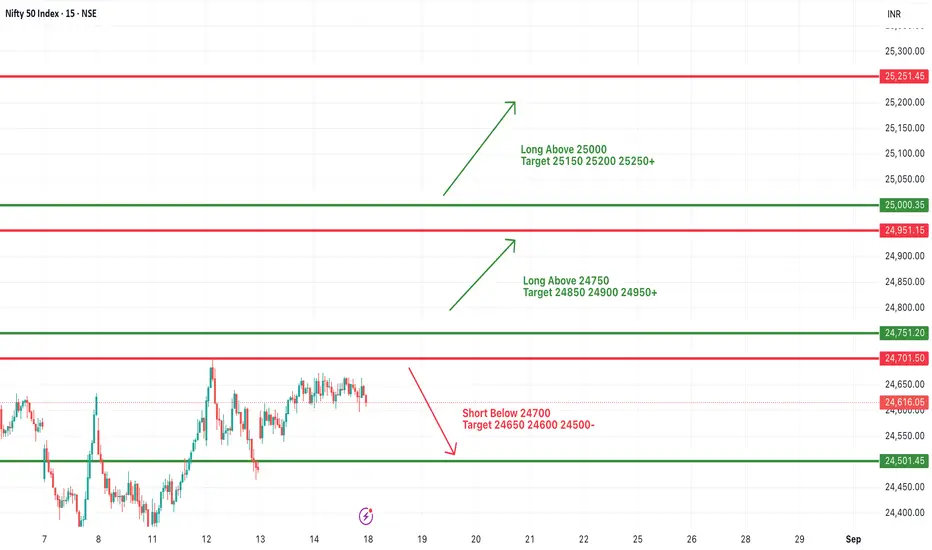
#NIFTY Intraday Support and Resistance Levels - 18/08/2025Nifty is likely to open with a gap-up above the 24,750 level, indicating bullish momentum at the start of the session. If the index sustains above this level, further upside movement towards 24,850, 24,900, and 24,950+ can be expected. A strong breakout above 25,000 could extend the rally towards 25,150, 25,200, and 25,250+.
On the downside, immediate support lies near 24,700, and a break below 24,700 may lead to some profit booking, dragging the index towards 24,650, 24,600, and 24,500-. However, as long as Nifty trades above 24,750, the bias remains positive with dips likely to be bought into.
Overall, the sentiment is bullish, and traders should trail their stop losses while riding the upside move.