NIFTY FMCGNifty FMCG sector looks strong, might give an upside move in coming days. Add it to your watchlist.
Which FMCG stock are you tracking? I’m eyeing VBL .
Let me know if you want me to analyse any specific stock?
✅ If you like my analysis, please follow me here as a token of appreciation :)
in.tradingview.com/u/SatpalS/
📌 For learning and educational purposes only, not a recommendation. Please consult your financial advisor before investing.
Technical Analysis

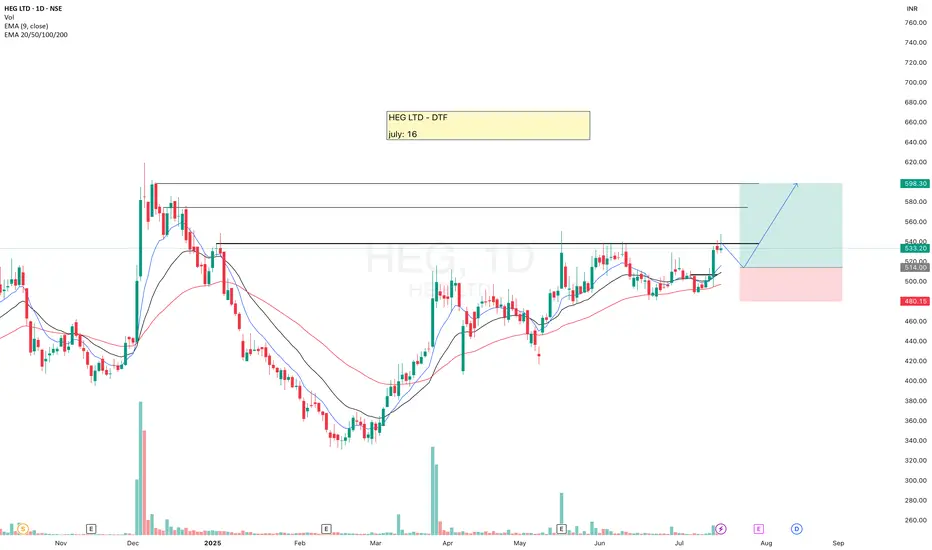
HEGHEG is looking good, moving above 20ema, but I am looking for small retracement for the Entry. In case it starts consolidating at CMP then we'll change our plan accordingly.
Trading is a game of probabilities, keep your ego aside and flow with the market.
✅ If you like my analysis, please follow me here as a token of appreciation :)
in.tradingview.com/u/SatpalS/
📌 For learning and educational purposes only, not a recommendation. Please consult your financial advisor before investing.
#NIFTY Intraday Support and Resistance Levels - 31/07/2025Today, Nifty is expected to open with a gap-down below the 24,700 level, signaling potential early weakness in the session. The market is hovering around a critical support zone, and price action near the opening will set the tone for intraday moves.
If Nifty sustains below the 24,700–24,750 zone, it may trigger a short opportunity. A break and close below this level can lead to a downside move towards 24,600, 24,550, and possibly 24,500. Continued pressure could further drag the index toward 24,450, and if that breaks, we may see deeper levels near 24,350, 24,300, or even 24,250.
On the flip side, if the index shows a reversal from the 24,700–24,750 zone and sustains above 24,750, a reversal long setup may activate. This could push the index higher toward 24,850, 24,900, and 24,950+, where it may face significant resistance.

[INTRADAY] #BANKNIFTY PE & CE Levels(31/07/2025)A gap-down opening is expected near the 56,000 level in Bank Nifty today, following a phase of consolidation seen over the last few sessions. The market is likely to remain volatile around this zone, making it important to observe price action closely before entering trades.
On the upside, a reversal long opportunity may emerge between 56,050 and 56,100. If the price sustains above this zone with strong bullish momentum, traders can look for upward targets around 56,250, 56,350, and potentially 56,450+. This area has previously acted as a short-term support, and a bullish reversal here could offer favorable risk-reward trades.
On the other hand, resistance lies around 56,400 to 56,450, where sellers may re-enter the market. If the price fails to sustain above this zone and shows bearish signs, it could trigger a downside move. In such a case, downside targets would be around 56,250, 56,150, and 56,050.
If Bank Nifty breaks below 55,950, it could signal a fresh short setup. A clean breakdown with volume confirmation below this support zone may lead to a further drop toward 55,750, 55,650, and 55,550. This level is crucial, and any break below it could result in strong bearish momentum.
In summary, traders should remain cautious near the opening bell and observe price behavior around key levels. Maintain a strict stop loss, practice partial profit booking, and trail positions to manage risk effectively in today’s volatile session.

XAUUSD – The Weakness of Gold – Are Investors Ready?Gold is being heavily impacted by the strengthening of the US dollar, driven by recently released economic data from the US. A strong increase in employment and a 2.5% GDP growth show that the US economy is growing stronger than expected, pushing the US dollar higher and creating downward pressure on gold.
The chart shows that gold is trading within a downward price channel, with key support and resistance levels already identified. The strong resistance at 3,345 USD continues to be a major challenge for any upward movement in gold.
If gold cannot break through these resistance levels and continues to decline below 3,310 USD, we may see a deeper correction.

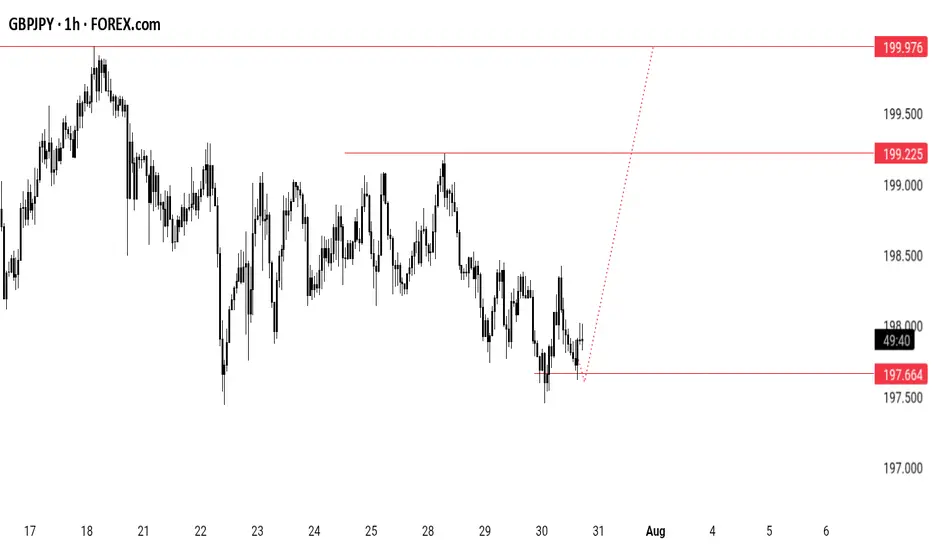
GBPJPY POTENTIAL LONGLooking at GBPJPY ,CURRENTLY taking long positions on the retest of the recently created daily demand zone which also confluences with the retest of the recently created 4h and 1h demand zone .
GOLD: Is This a Bottom or the Calm Before the Storm?🌐 Fundamental & Macro Landscape
The recent US–EU trade and defense pact has temporarily reduced gold’s appeal as a safe haven.
The US Dollar and stock markets remain strong thanks to positive macroeconomic data.
Current sentiment is risk-on, which typically shifts capital away from metals and into riskier assets.
But the real volatility could come later this week:
📅 High-Impact Events to Watch:
US ADP Employment Report
FOMC Statement + Nonfarm Payrolls (NFP)
These will likely decide whether gold resumes its uptrend or continues sliding lower.
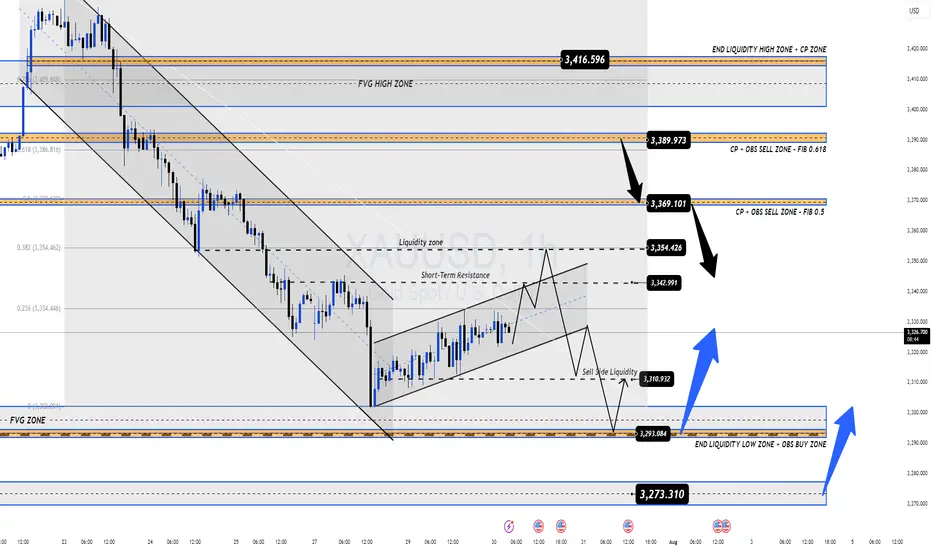
📊 Technical Outlook (H1–H4)
Gold is currently trading within a parallel bullish channel after rebounding from local lows.
However, price is now approaching a key resistance zone around 3342, where we might see either a breakout or a rejection, depending on market sentiment during the upcoming data releases.
🔍 Key Price Zones
🔺 Short-Term Resistance: 3342
🔺 Major Supply Zone: 3369–3388 (Order Block + FVG + Fib 0.5–0.618)
🔻 High-Liquidity Demand Area: 3293–3290
🔻 Deep Demand Zone (FVG): 3275–3273
🔺 Long-Term Resistance Target: 3416
📈 Trade Plan – Based on Price Reaction, Not Prediction
The best trades come from waiting for the right reaction at key zones. No chasing. No guessing.
✅ Scenario 1 – Buy the Dip (Scalp Setup)
Entry: 3293 – 3291
Stop Loss: 3286
Targets: 3296 → 3300 → 3304 → 3308 → 3312 → 3315 → 3320 → 3330
🟢 Works well in high-liquidity zones for quick short-term gains.
✅ Scenario 2 – Buy from Deeper Support (Swing Setup)
Entry: 3275 – 3273
Stop Loss: 3269
Targets: 3280 → 3284 → 3288 → 3292 → 3300 → 3305 → 3310 → 3320 → 3330
🟢 Great setup if price absorbs selling pressure and reverses from FVG demand.
❌ Scenario 3 – Short from Short-Term Resistance
Entry: 3340 – 3342
Stop Loss: 3346
Targets: 3335 → 3330 → 3325 → 3320 → 3310
🔴 Valid only if price fails to reclaim above 3342.
❌ Scenario 4 – Short from Major Supply Zone
Entry: 3369 – 3372
Stop Loss: 3376
Targets: 3365 → 3360 → 3355 → 3350 → 3345 → 3340 → 3330 → 3320
🔴 Higher risk – only act after confirmation (e.g., rejection wicks or bearish candle pattern).
⚠️ Risk Management Tips
Avoid entering right at London or New York opens – too much volatility and false breakouts.
Always wait for confirmation (candle rejection, pin bars, engulfing, etc.).
Use strict stop-loss rules – FOMC + NFP can spike price in both directions.
💡 Final Tips for Indian Traders
Trade with patience – the best setups often appear when others are panicking.
Respect your capital – don’t overleverage during high-volatility news events.
Focus on price action – not emotions or fixed bias.
📌 If you found this gold analysis helpful, feel free to drop your thoughts in the comments or follow for daily updates on XAU/USD.
Let’s grow and trade smarter, one setup at a time.
Namaste 🙏 | Trade safe, trade with clarity.
#NIFTY Intraday Support and Resistance Levels - 30/07/2025After a strong recovery from recent lows, Nifty is expected to open flat today and may continue its upward momentum if key resistance levels are breached. The index is currently hovering near the upper end of its reversal zone.
Upside Levels:
A breakout above 25,000 could trigger bullish continuation.
If sustained, we can expect targets at 25,150, 25,200, and 25,250+.
This level is crucial for short-term trend reversal confirmation.
Reversal Buy Opportunity:
If Nifty takes support around 24,750–24,800, a reversal long can be initiated.
Expected targets for this setup: 24,850, 24,900, 24,950+.
Keep strict trailing stop loss as volatility may increase near upper resistance zones.
Reversal Short Setup:
If price fails to sustain above 24,900–24,950, a short opportunity may arise.
Expected downside targets: 24,850, 24,800, 24,750-.
This zone may act as a reversal point for sellers.
Breakdown Short Setup:
If Nifty breaks below 24,700, a strong downside move may begin.
In that case, expect targets at 24,600, 24,550, and 24,500-.
Summary:
Today’s session could turn directional after consolidation around key levels. Wait for confirmation near reversal zones before entering trades. Follow partial profit booking and trailing stop loss for intraday trades.

EURUSD: Short-term rebound signals after sharp dropEURUSD has just reacted to a key demand zone and is showing signs of a technical rebound. A small double bottom pattern is forming on the 3H chart, indicating that buyers are starting to return. If the price holds above this recent low, the short-term bullish scenario could continue.
On the news front, the US JOLTS data came in lower than expected, reflecting a cooling labor market. This reduces the likelihood of further Fed tightening, creating room for the euro to recover slightly.
Strategy: Favor buying if price remains above the support zone, with a potential move to retest the upper FVG area before the market makes its next decision.

Gold rebounds – Enough to shift the trend?Gold is trading within an ascending channel, recently bouncing modestly from the trendline after a series of declines. The structure suggests XAUUSD could continue a technical rebound toward the resistance zone near 3,374 before a new trend is confirmed.
On the news front, JOLTS job openings came in slightly below expectations, indicating a cooling U.S. labor market. This offers mild support for gold, as the Fed may consider easing policy sooner. However, with the figure still above 7 million, the impact remains short-term.
Strategy: Watch price reaction near the 3,374 zone. If it fails to break through, the bearish scenario remains dominant. Short-term buying may be considered as long as the trendline holds.

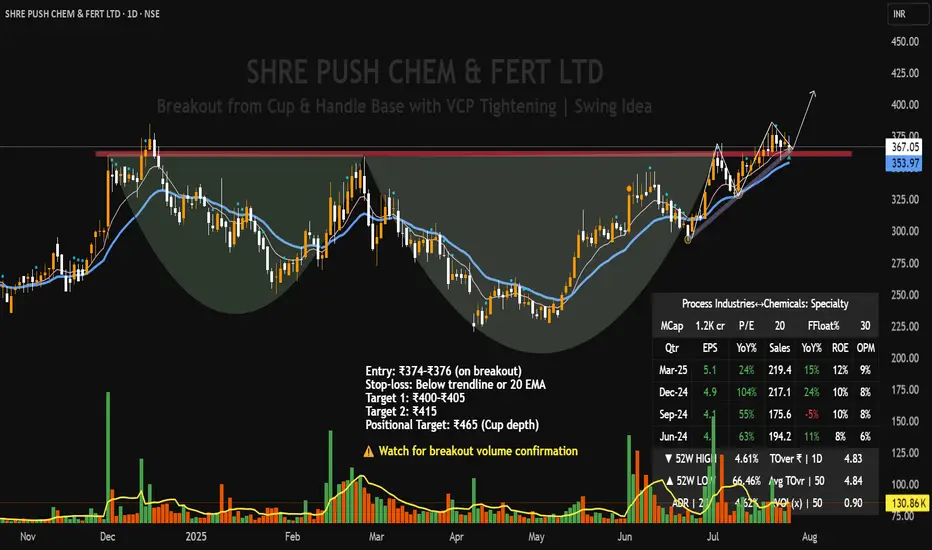
SHREE PUSHKAR CHEMICALS – Cup & Handle + VCP Breakout Setup |Technical Structure:
SHREE PUSHKAR CHEMICALS is forming a high-quality breakout setup on the daily chart, combining both a Cup & Handle pattern and a Volatility Contraction Pattern (VCP) within the handle zone.
Cup & Handle base formation extending from Nov 2023 to Jul 2025
Mini VCP within handle, showing tight range contraction, signaling institutional accumulation.
Ascending trendline support holding firm, along with the 9 EMA.
Volume contraction during each pullback
A confirmed breakout above ₹378 with volume can trigger a strong upside continuation.
Volume has steadily contracted across the handle, especially during pullbacks
Current price is tightening just under the breakout zone — ideal for a low-risk entry
A decisive breakout on volume >150K will act as a confirmation trigger.
Fundamentals
Market Cap : ₹1,200 Cr (Small-cap room for growth)
P/E Ratio: ~20x Reasonable for specialty chemicals
EPS Growth: 24% YoY Consistent profit improvement
Revenue Growth: 15% YoY Stable.
ROE: ~12% Healthy return metrics
Operating Margin: ~9% Sustainable profitability
This setup reflects strong technical discipline with a clean, low-risk structure. Ideal for swing traders looking for breakouts backed by volume and volatility contraction. Watch closely for confirmation with volume.
NIFTY50: Trend Reversal on the Horizon or More Downside Ahead?The Nifty50 index has witnessed consistent selling pressure throughout July, carving out a clean downtrend structure. However, recent price action suggests the index may be preparing for a potential structural shift, as visible through the formation of a reversal pattern—an Inverted Head & Shoulders on the 1-hour chart.
But before jumping to conclusions, let’s break it down in detail.
🔍 The Setup: July’s Downtrend & Emerging Reversal Zone
Since early July, the Nifty50 index has been consistently creating lower highs and lower lows, following a strong bearish sequence. Each bounce was short-lived and got sold into, confirming bearish dominance. The market sentiment was largely negative due to global volatility, sectoral underperformance, and FII selling.
But now, a trend resistance line—clearly respected multiple times—has been approached again, and this time, the structure looks different. The chart shows a potential inverted head and shoulders pattern, a classic bullish reversal formation that often signals an exhaustion of the downtrend.
📊 Potential Scenarios
✅ Bullish Case:
If NIFTY manages to:
Break above the trend resistance
Sustain above 25,100
And retest with a bullish engulfing candle or strong follow-through
Then we could see a fresh uptrend toward 25,400, 25,600, and possibly 25,750+, aligning with the measured move projection of the Inverted Head and Shoulders.
❌ Bearish Case:
If the price:
Fails to break the trendline
Faces rejection near 24,900–25,000
Or breaks below the right shoulder low again
Then the index might resume its downtrend, potentially testing back to 24,600, 24,400, and lower support zones.
📍Price Action Points to Watch
24,900–25,000: Trend resistance; immediate decision zone.
25,100–25,300: Strong supply zone; breakout confirms structure change.
24,700: Key swing low; a breach here confirms continuation of bearish trend.
Retest zones: Look for strong reversal candlesticks or rejection wicks near breakout points.
📝 Final Thought
This is a make-or-break zone for NIFTY. The market has been consolidating near the lows after a sharp selloff, and now it’s showing signs of reversal. But confirmation is key—don’t jump in without price breaking critical levels with strength.
A breakout above the neckline (25,100) followed by bullish confirmation could signal a trend reversal, while rejection from this zone may bring in another wave of downside.
In short, NIFTY is at an inflection point. Watch the 24,900–25,300 zone closely—it holds the key to the index’s next 300–500 point move.

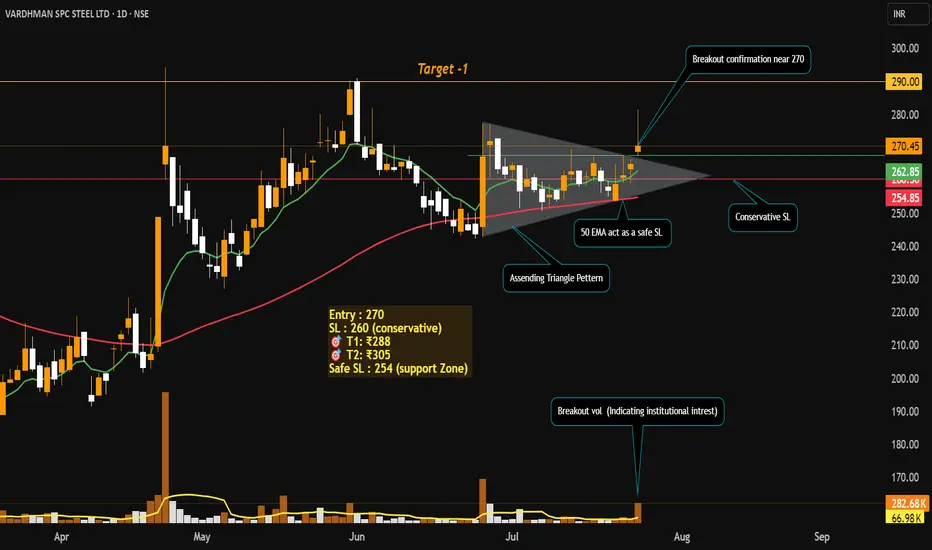
Swing Trade Idea: Vardhman Special Steels Ltd (NSE: VSSL)Technical Setup
Ascending Triangle Breakout on Daily Timeframe
Volume Spike 4x average volume on breakout day — strong institutional confirmation.
both the EMAs Bullish crossover (Price trading above both the EMAs).
RSI showing bullish momentum (60-65).
Price Action Strategy
Price broke out from resistance zone with strong bullish candle and closed near the high.
Previous resistance of ₹270 now acts as support.
Fundamentals
Promoter Holding: High, backed by Aichi Steel (Toyota Group).
Debt/Equity: Low (~0.12) → Strong solvency.
Strong financials: ROE / ROCE ~12.4% / ~17.8%
Revenue Growth: Consistent YoY
Valuation: Reasonable P/E (~18–20x)
My View: Entered at breakout with strong confirmation. Trail SL and book profits step-by-step. Holding for higher targets as long as price respects 9 EMA.
BTCUSDT – short-term pullback before heading higherBTCUSDT remains within a clear ascending channel. On the H8 timeframe, price is facing resistance and may pull back toward lower support before continuing its upward move. Several Fair Value Gaps below act as strong backing zones for buyers.
On the news side, market sentiment is improving as investors anticipate the upcoming PCE report and renewed interest in Bitcoin ETFs. Although the Fed holds its hawkish tone, rising recession risks are fueling expectations of a rate cut later this year.
Strategy: Consider BUY setups if price pulls back into support and shows strong reaction. Trend remains bullish unless the ascending structure is broken.

Gold plunges as Fed stays firm, war fails to boost XAUUSD is showing clear signs of weakness after peaking at 3,375 and consistently forming lower highs. On the H2 chart, the price action confirms a completed distribution pattern and is now consolidating ahead of a potential breakdown below 3,283.
News highlights:
The US ADP and GDP reports exceeded expectations, strengthening the case for the Fed to keep interest rates higher for longer – putting significant pressure on gold.
Although the JOLTS job openings dipped slightly, the figure remains above 7 million, offering little support for gold recovery.
Conflict news between Thailand and Cambodia might offer some support, but the impact is limited due to the small regional scale.
Trading strategy: Prioritize SELL if price pulls back to 3,339 and fails to hold. The next target is around 3,252.
The main trend remains bearish unless XAUUSD breaks above 3,360.
Do you think XAUUSD will break the bottom this week?

U.S. Inhaler Play and Strong Earnings Fuel Long-Term UpsideTicker: NSE: CIPLA
Sector: Pharmaceuticals
Market Cap: ₹1.26 lakh crore+
Current Price: ₹1,572 (as of July 28, 2025)
Technical Rating: ⭐⭐⭐⭐⭐ (Strong Buy across platforms)
________________________________________________________________________________
🔍 Strong Fundamentals Back the Bullish Momentum
CIPLA has delivered an encouraging performance in Q1 FY26, reinforcing its long-term bullish narrative. The company posted a 10% year-on-year growth in profit after tax (PAT), reaching ₹1,298 crore, while revenues climbed 4% to ₹6,957 crore. These gains were driven largely by robust performance across its domestic Indian market and continued traction in Africa. The earnings beat estimates and demonstrate management's ability to maintain profitability despite sector-wide margin pressures.
Brokerages have taken note. Antique Broking has issued a bullish price target of ₹1,875, citing confidence in CIPLA’s U.S. respiratory pipeline. Meanwhile, Nuvama has pegged a more conservative target of ₹1,651, emphasizing margin resilience. Both reflect a broader positive sentiment from the street, bolstered by the company’s continued strategic execution.
Perhaps most importantly, CIPLA's U.S. growth roadmap is gaining clarity. With a stated goal of achieving $1 billion in U.S. revenue by FY27, the company is betting big on its inhalation portfolio. The upcoming launches of generic Advair and Symbicort are expected to cushion the impact from the anticipated decline in Revlimid revenues. This pipeline visibility is a key factor that differentiates CIPLA from its peers in the pharma space.
________________________________________________________________________________
📊 Technical Structure Signals Bullish Breakout
From a technical standpoint, CIPLA has just confirmed a breakout from an ascending triangle pattern, typically viewed as a continuation setup in an uptrend. On July 28th, the stock surged above the key breakout zone of ₹1,575–₹1,580, backed by a substantial increase in volume (3.84M vs 1.68M avg), signaling institutional participation. The daily close at ₹1,572 marks a technical inflection point, with the price now firmly above its 20, 50, 100, and 200 EMAs, indicating strong trend alignment.
The momentum indicators are also supportive, though cautionary. The Relative Strength Index (RSI) hovers around 71, suggesting overbought conditions, while the MACD has given a fresh bullish crossover. Additionally, the ADX (above 25) confirms trend strength. However, traders should be prepared for short-term volatility or pullbacks, as these indicators often cool off before further upside continues.
Key support levels to watch include ₹1,536, followed by ₹1,500 and ₹1,479.5. On the upside, immediate resistances lie at ₹1,592.5, then ₹1,613 and ₹1,649. A sustained close above ₹1,580–1,592 may unlock the next bullish leg toward ₹1,650+ levels.
________________________________________________________________________________
⚠️ Risks Remain – Pricing Pressure and Valuation a Concern
Despite the bullish setup, there are risks that could temper upside momentum. CIPLA’s U.S. Revlimid portfolio is facing pricing pressure, a trend impacting the broader generics market. Any further compression could drag margins in upcoming quarters. Additionally, while the company has posted solid profits, its EBITDA margin has seen a slight dip to 25.6%, suggesting limited operating leverage.
On the valuation front, CIPLA now trades at nearly 27× P/E, pricing in much of the future growth optimism. This elevates the bar for quarterly execution. From a technical lens, the RSI and stochastic indicators remain in overbought territory, raising the possibility of near-term consolidation or minor pullbacks before the next move higher.
________________________________________________________________________________
⏳ Tactical & Strategic View – Trade the Momentum, Invest in the Vision
In the short term, momentum traders should monitor how the stock behaves around the ₹1,575–₹1,580 breakout level. If the price sustains above this zone with continued volume, it signals strength and potential for a rapid move toward ₹1,600–₹1,650. However, any retracement to the ₹1,540–₹1,550 support range could present an ideal buying opportunity, especially for swing traders looking for a defined risk-reward setup.
For long-term investors, the bullish thesis rests on execution of the U.S. strategy and maintaining growth in high-margin geographies. With brokerages projecting upside toward ₹1,650–₹1,875, and a strategic focus on inhalation therapies, CIPLA is well-positioned for structural growth. That said, investors must remain patient and allow the multi-year thesis to unfold.
________________________________________________________________________________
🧠 Market Sentiment – Cautious Optimism
Overall market sentiment remains decisively positive, supported by strong earnings, a visible product pipeline, and favorable technical alignment. Yet, caution stems from the overbought technicals and valuation concerns. A prudent approach would be to accumulate on dips near ₹1,540–₹1,550, while watching for a decisive breakout and close above ₹1,580 to confirm trend continuation.
________________________________________________________________________________
📍 Investment Thesis: Accumulate with Conviction
CIPLA’s combination of strong fundamentals, a defined U.S. strategy, technical momentum, and institutional interest makes it a compelling long-term investment. Traders and investors alike can look to accumulate on dips, while treating a breakout above ₹1,580 as a confirmation trigger for further upside. Execution risk remains, but the broader setup favors a bullish bias heading into the next quarter.
For traders looking to capitalize on Cipla’s potential breakout, two entry strategies stand out. An aggressive entry can be considered in the ₹1,572–₹1,577 range, with a stop loss placed at ₹1,558. This suits momentum traders aiming to ride an early breakout, targeting ₹1,590 as an initial objective and ₹1,610+ for extended gains, offering a risk-reward ratio of 1:1 to 1:2+. Alternatively, a low-cost entry is ideal near ₹1,564 for those seeking a better cushion against volatility, with a tighter stop loss at ₹1,542. This setup also offers attractive upside toward ₹1,580–₹1,605+, maintaining similar or better risk-reward dynamics. In both cases, a decisive breakout above ₹1,580 on strong volume would confirm the bullish structure. Traders are advised to follow strict stop-loss discipline and avoid chasing if the price stretches sharply.
________________________________________________________________________________
⚠ Disclaimer (Please Read):
• These Trades are shared for educational purposes only and is not investment advice.
• I am not a SEBI-registered advisor.
• The information provided here is based on personal market observation.
• No buy/sell recommendations are being made.
• Please do your own research or consult a registered financial advisor before making any trading decisions.
• Trading involves risk. Always use proper risk management.
• I am not responsible for trading decisions based on this post.
________________________________________________________________________________
💬 Found this helpful?
Drop your thoughts or questions in the comments below ⬇️
🔁 Share this post with your trading community – let them benefit from clean charts, structured setups, and zone-based learning.
✅ Follow simpletradewithpatience for charts, clean setups, and educational content based on price action, zones, and risk-managed trades.
🚀 Trade with patience, trust your charts, and stay clear-headed!
Be Self-Reliant | Trade with Patience | Learn with Charts & Zones 📊________________________________________________________________________________

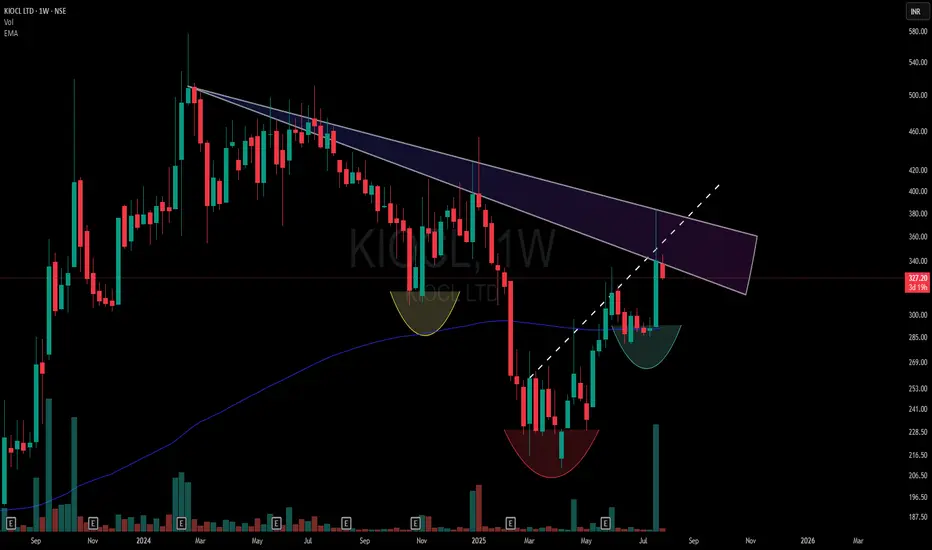
Dual Counter-Trend Zone and Market Structure Shift- This chart highlights a dual counter-trend resistance zone formed by two overlapping CT trendlines (marked in the shaded purple region).
🟡 Yellow Cup – Marks the origin base of the structure (assumed starting shift).
🔴 Red Cup – Establishes a Lower Low Base, still within bearish control.
🟢 Green Cup – Forms a Higher Low Base, showing a market structure change supported by a noticeable volume surge.
- The dotted trendline drawn through the zone acts as a hidden resistance confluence
⚠️ Disclaimer:
This post is non-forecasting in nature. It is not a buy/sell recommendation or financial advice. The chart is shared purely for educational and structural analysis purposes.
Dalmia Bharat: long 2120-2100 stop 2090 Keep eyes on the "Dalmia Bharat" : go long 2120-2100 stop 2090
Eying 2670..2900 in 4- 5 months

EURUSD – Bullish momentum fades, signs of a reversal emergeEURUSD is approaching the key resistance zone at 1.1780, a level that has been rejected multiple times in the past. On the H4 chart, the pair remains firmly within a descending channel since early July, with several FVG zones stacked above—indicating growing selling pressure. The recent upside momentum is clearly weakening, raising the risk of a deeper pullback.
Market context:
– The US dollar continues to gain support from strong economic data, while the Eurozone lacks clear signs of recovery.
– Traders are holding their breath ahead of upcoming Eurozone inflation data and the US PCE report—events that could trigger significant moves.
Trade setup: If EURUSD fails to break above 1.1780, a drop toward the 1.1610 support zone becomes increasingly likely.

XAUUSD – final bounce before the drop?Gold is trapped in a sideways box, and the bounce from the $3,330 zone looks like nothing more than a technical reaction – with no strong buying momentum. The dense cluster of FVGs signals that selling pressure hasn’t been fully absorbed yet.
Fresh data from the U.S. strengthens the bearish case: jobless claims have hit a 3-month low, indicating a resilient labor market. This paves the way for the Fed to keep rates steady at 4.25–4.50%. Meanwhile, Trump’s tariff policies are stoking inflation risks.
If gold fails to break above $3,437 in the next few sessions, sellers may step in aggressively. In that case, the next target could be $3,280.

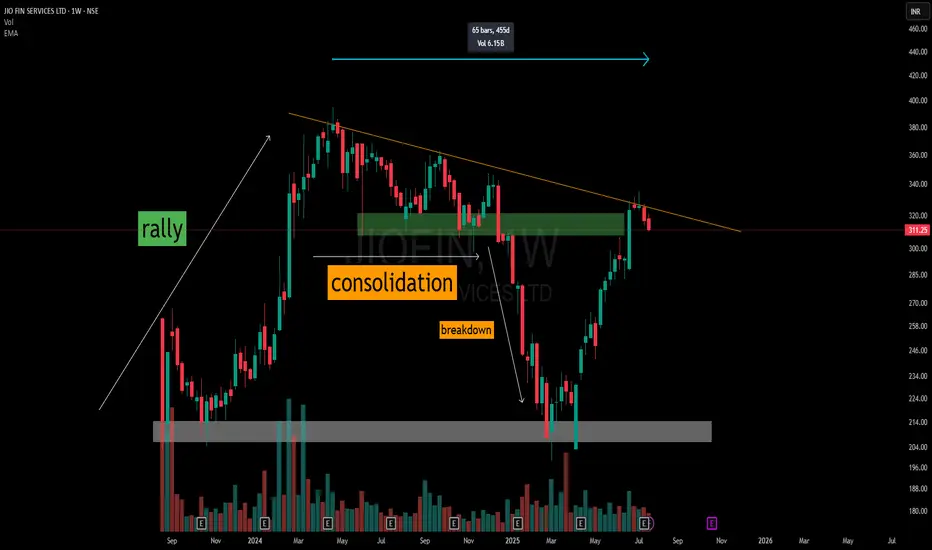
455-Day Counter Trendline | From Breakdown to V-RecoveryThis weekly chart of Jio Fin Services Ltd illustrates a multi-phase price structure over 455 days:
🔹 Initial Rally — Kicks off from a defined accumulation base (grey zone), marking the start of a strong impulse leg.
🔹 Consolidation Phase — Price enters a descending triangle formation just below a historical resistance band.
🔹 Breakdown — Clean breakdown from the triangle pattern sends price sharply downward.
🔹 V-Shaped Recovery — A strong reaction off the original base zone leads to a sharp reversal.
🔹 Back to the 455-Day Counter Trendline — Price now tests the long-standing counter trendline, which has remained intact throughout.
📌 This chart demonstrates how historical price structures—especially well-defined base formations and trendline resistances—continue to act as critical reference points for future price action.
🛠️ No predictions here. Just a structured breakdown of price behavior and major decision zones traders are often drawn to.
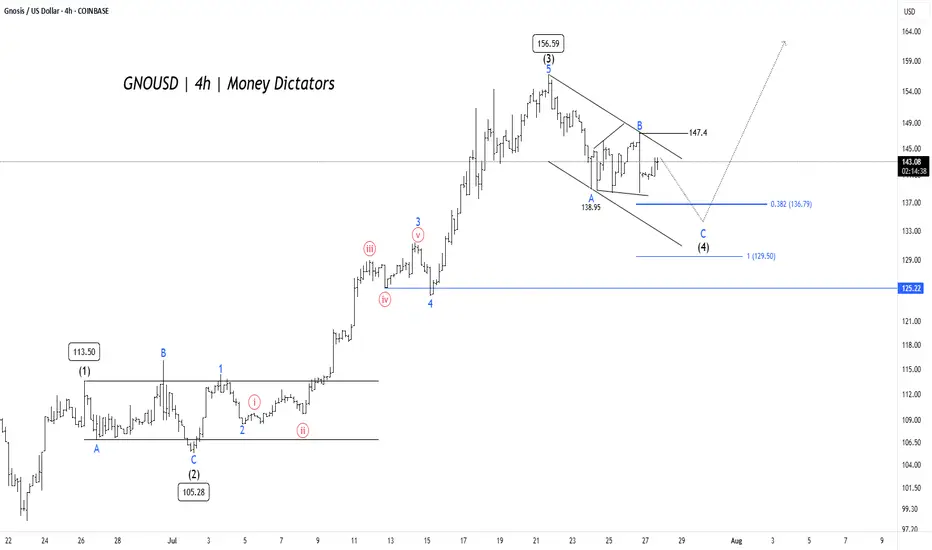
GNO/USD Price Action Aligns for Final Wave 5 PushGNO/USD pair is unfolding a clean Elliott Wave impulse pattern on the 4-hour chart. The rally began with Wave (1) reaching 113.50, followed by a corrective Wave (2) that bottomed near 105.28. This set the stage for a powerful Wave (3) that surged to 156.59 , aligning well with Elliott Wave theory where Wave 3 is typically the strongest and steepest leg in the sequence.
Wave (4) is now in progress, taking the form of an A-B-C correction inside a descending channel. Interim support was found at 138.95 during Wave A, and Wave C could extend toward the 0.382 Fibonacci retracement level at 136.79 or the deeper support zone near 129.5. These levels are crucial, as they often mark the end of a corrective phase and the beginning of the next impulse. A confirmed breakout above 147.4 would signal the start of Wave (5) and the return of bullish momentum.
Short-term targets have the potential to reach 135 – 128 , while 125.22 remains the invalidation level for this bullish setup. After the completion of Wave (4), traders can look for long opportunities targeting 147 – 154 – 172 . As long as the structure holds and price respects key supports, the outlook remains favorable for a fresh push higher in Wave (5).
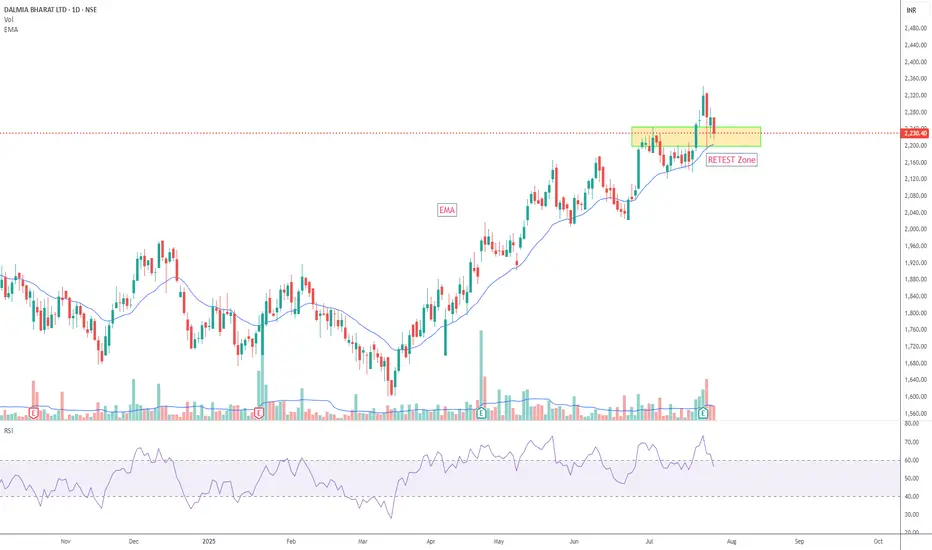
DALBHARAT Retesting Breakout Zone Near 21 EMAThe stock DALBHARAT is currently testing the breakout region between ₹2200–₹2250, which aligns with the 21 EMA — a potential confluence zone.
Traders may observe price action near this level for signs of a bounce. If the retest holds, there could be scope for upward movement toward previous highs.
Note: The risk-reward setup appears favorable based on current chart structure.
Disclaimer
This is a personal technical analysis and not a recommendation to buy or sell any securities. Please do your own research or consult a SEBI-registered investment advisor before making any investment decisions. Trading in financial markets involves risk.