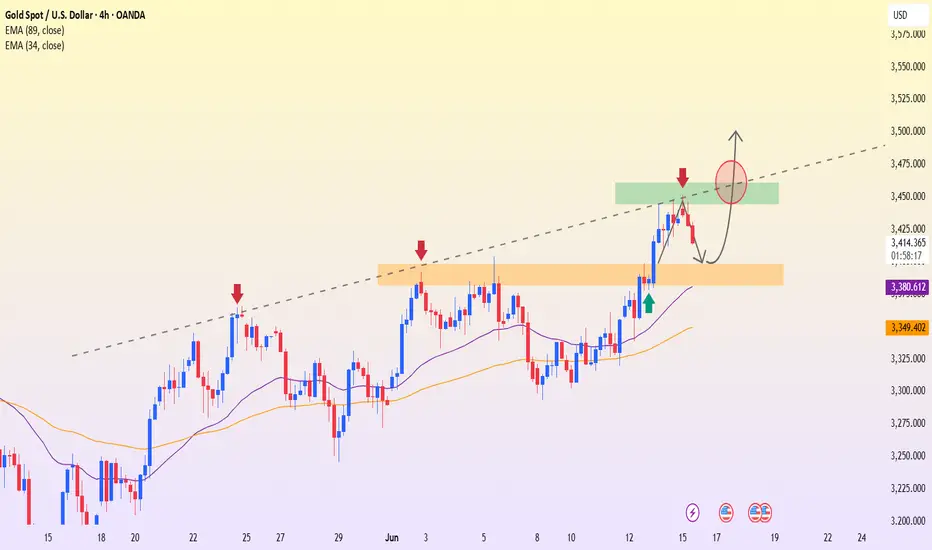
XAUUSD – Bullish Signal Taking ShapeGold begins the week on a positive note, supported by:
U.S. inflation coming in lower than expected, raising expectations that the Fed will cut interest rates in the coming months.
Tensions between Israel and Iran, which are driving safe-haven flows into gold.
On the H4 chart, the price is pulling back toward the $3,397 support zone, which aligns with both the EMA and a previous accumulation area. The current structure suggests a potential W-shaped reversal pattern, which could propel gold toward the $3,501 resistance level.
Main strategy: Look for buy setups around $3,397 upon bullish confirmation.
Target: $3,500
Stop loss: Below $3,380
Gold remains in an uptrend. The $3,397 zone is the key level that could trigger the next upward move.
Technical Analysis
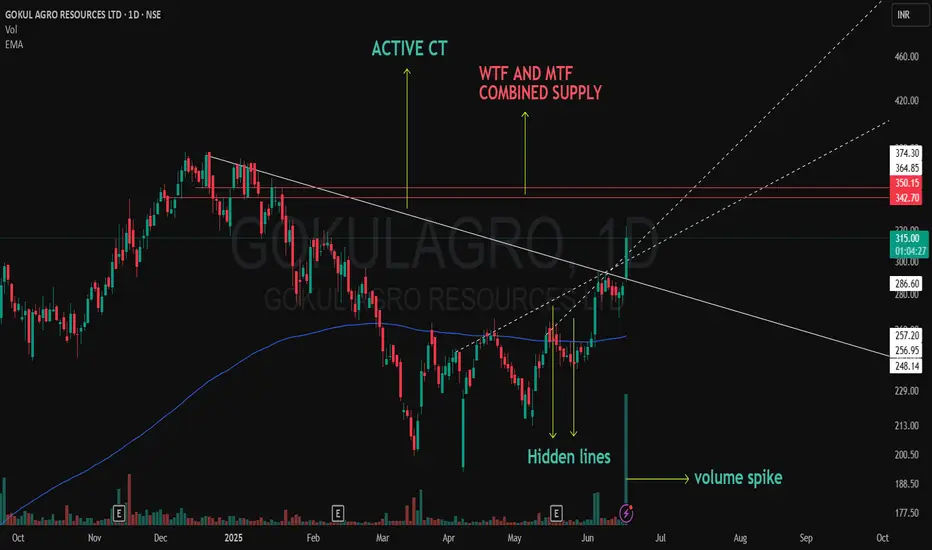
CT Breakout Live on GOKULAGRO! Supply Zone Just Ahead 📌 CT Breakout In Play | GOKULAGRO
A strong breakout just happened on the Daily chart of GOKULAGRO.
🟢 The Active CT (green) has been cleanly broken today with a strong bullish candle.
🟢 Multiple hidden resistances were also taken out during the breakout – marked in green as they’ve now turned into potential support.
🟢 A healthy volume spike confirms strong participation – not massive, but convincing enough to validate the move.
🔴 The next major supply lies just ahead – a combined Weekly + Monthly resistance zone (marked in red). This could act as a temporary pause or reversal zone if not cleared with momentum.
This is not a forecast or a buy/sell recommendation — just a structured observation of price action and context.
Watching how it behaves near the higher timeframe supply. Will it reject or absorb?
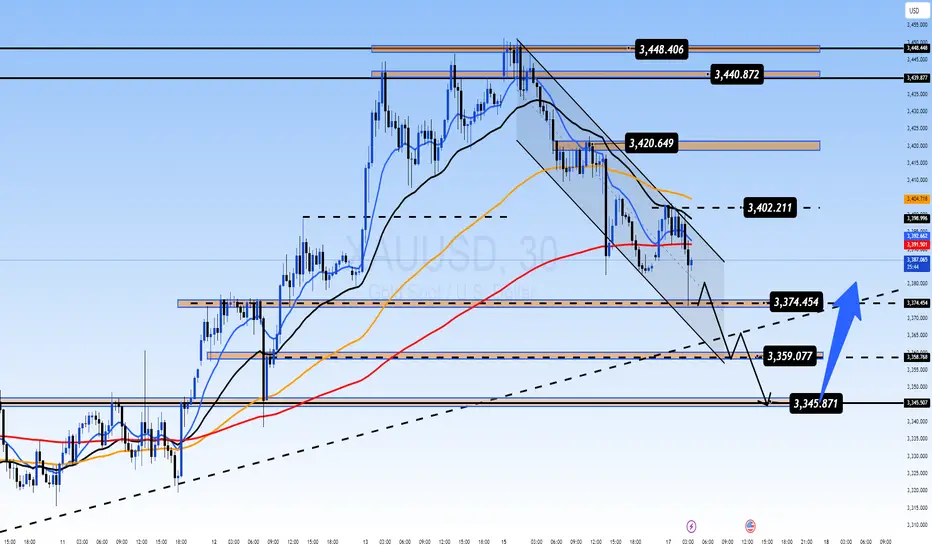
Gold Consolidating at Key Support: Is the Next Move a Reversal?XAUUSD 17 June – Gold Consolidating at Key Support: Is the Next Move a Reversal?
After a strong rally to 3,448 – the highest level in 8 weeks – gold faced profit booking and pulled back sharply towards 3,385. However, price is now sitting at a critical confluence of technical zones, and smart money may be preparing for the next strategic leg. Let’s decode the structure...
🌐 Macro & Market Sentiment
Geopolitical heat remains: Israel–Iran tension is far from cooling. Trump's statements about evacuating Tehran and pushing for a new nuclear deal are fueling safe-haven demand.
Fed policy meeting + US Retail Sales ahead: These upcoming events will shape inflation expectations and rate path clarity. Traders are cautious but alert.
Capital rotation: Large funds may be temporarily exiting gold and shifting into oil and stocks—triggering short-term volatility, not trend reversals.
📊 Technical Breakdown (M30-H1 Confluence)
Trend channel: Gold is currently trading within a descending short-term channel after failing to hold above the 3,440–3,448 supply zone.
EMA alignment (13-34-89-200): Squeezing closer, indicating momentum exhaustion and possible bullish crossover if support holds.
Fair Value Gap (FVG) + historical support + ascending trendline align near 3,345 → strong liquidity pocket forming here.
🎯 Trade Setups for Today
✅ BUY Setup (Liquidity Rebound)
BUY ZONE: 3,344 – 3,342
SL: 3,338
Targets:
→ 3,348 → 3,352 → 3,356 → 3,360
→ 3,364 → 3,368 → 3,372 → 3,380+
🧠 Ideal entry if price forms bullish rejection candle in this zone, especially during London open. Look for long-tail or inside bar confirmation.
⚠️ SELL Setup (Scalp-Only if Rejected)
SELL ZONE: 3,440 – 3,442
SL: 3,446
Targets:
→ 3,436 → 3,432 → 3,428 → 3,424
→ 3,420 → 3,415 → 3,410
📌 Only short if there's strong rejection from this supply zone. No blind entry—wait for clear bearish momentum or reversal wick with high volume.
🧭 Market Psychology
Retail traders were trapped on the breakout—smart money likely unloading at highs.
Price is now retracing to gather liquidity. If the 3,344 zone holds, we could see a powerful impulsive recovery.
Don’t trade the noise — trade the zones. Volume behavior around these levels will reveal market intention.
📌 Final Thoughts
This is a classic case of controlled retracement after a breakout. If gold finds support at the BUY ZONE, the next bullish wave could target 3,400+ again. But if the 3,345 area fails, deeper correction toward 3,320 is possible.
🧘♂️ Stay patient. Let price come to you.
✅ Follow structure, respect SL, and trade with clarity.
Gold Drops After Asian FOMO: Bull Trap or Liquidity Grab?🟡 XAUUSD 16/06 – Gold Drops After Asian FOMO: Bull Trap or Liquidity Grab?
After a strong bullish rally in the Asian session driven by fear-based headlines and war news, gold (XAUUSD) suddenly reversed sharply — confusing many retail traders who jumped in late. But when we look deeper into price behavior and volume, the story becomes clearer...
📌 Key Fundamental Insights
🔸 Geopolitical headlines (war tensions, assassination attempts) triggered a FOMO rally in gold early in Asia.
🔸 However, the lack of follow-through volume suggests this may have been a bull trap—a smart money strategy to unload positions into emotional buying.
🔸 Big funds could be reallocating capital temporarily from gold into:
🔹 Stocks (tech & value sectors are correcting attractively)
🔹 Oil (Middle East tension = higher oil price = strong institutional interest)
🔍 Technical Outlook (M30 Chart)
The technical structure shows a textbook liquidity play:
🔻 Price spiked into resistance at 3456, then reversed
🧊 EMAs (13/34/89/200) are flattening → signs of potential bearish crossover on M15–M30
📉 Volume has been declining → confirms exhaustion of the FOMO move
📦 A large Fair Value Gap (FVG) sits below current price, acting as a magnet for liquidity
🎯 Strategy Setup
Scenario 1: BUY from FVG (Liquidity Reclaim)
Entry: 3383 – 3385
SL: 3377
TPs: 3386 → 3390 → 3394 → 3398 → 3402 → 3406 → 3410+
Structure favors a bounce from this zone if confirmed by price action during London or NY sessions.
Scenario 2: SELL if price re-tests 3456–3458
Entry: Only on clear rejection
SL: 3462
TPs: 3452 → 3448 → 3444 → 3440 → 3435 → 3430
⚠️ Avoid shorting blindly — only trade confirmed rejections with strong candle setups.
Market Psychology Right Now
Big players may be unloading gold to rotate into oil and equities
Asian FOMO = retail got trapped
Volume profile shows imbalance: market likely seeking liquidity lower before moving higher again
📝 Final Thoughts
Gold is in a volatile reaccumulation zone. Rather than chasing price, it’s better to let the market come to your planned zones. The 3383–3385 zone will be critical. If it holds, we may see a solid bounce into next week.
Discipline beats emotion. Respect your SL and stick to the zone logic.
📌 Follow for intraday updates. Will post re-entry plan during London session if price reacts early.

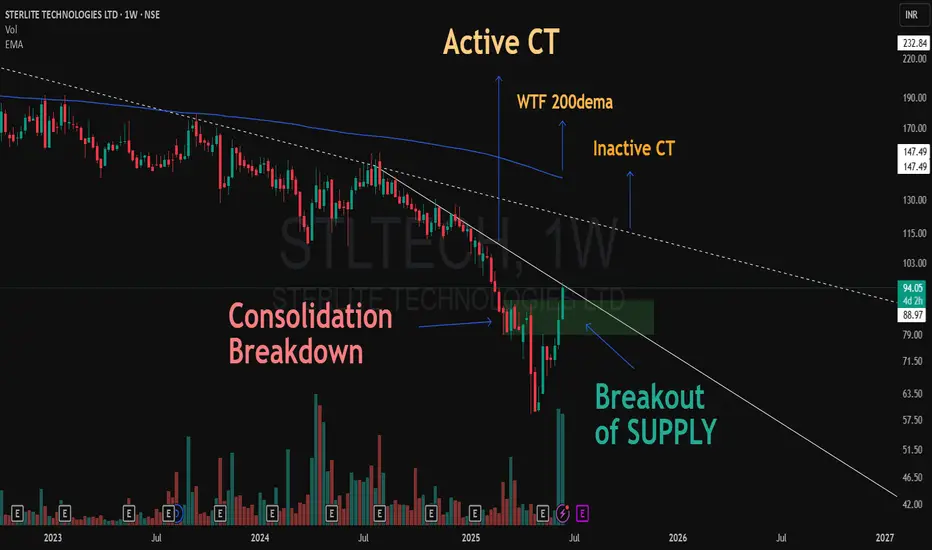
From Breakdown to Breakout: A V-Shaped Surprise!This chart of Sterlite Technologies (W1) tells a compelling price action story:
📉 The stock initially consolidated at a demand zone, only to break down sharply, flipping that zone into a fresh supply area.
💥 What followed was a strong V-shaped recovery, accompanied by significant volume expansion.
🚀 The reclaimed supply zone was decisively taken out, leading price right into the Active Counter Trendline (CT).
🔁 This Active CT now stands as a key structure; the stock needs to form a higher low near the reclaimed demand zone for structural strength.
⚠️ Ahead, we have two higher-timeframe resistances in sight:
📏 An Inactive Weekly CT (dotted)
📡 The WTF 200 DEMA, a major trend filter
While this is not a call or forecast, the shift in structure, volume, and reclaiming of supply tells a story of possible trend transition — something worth keeping on the radar.
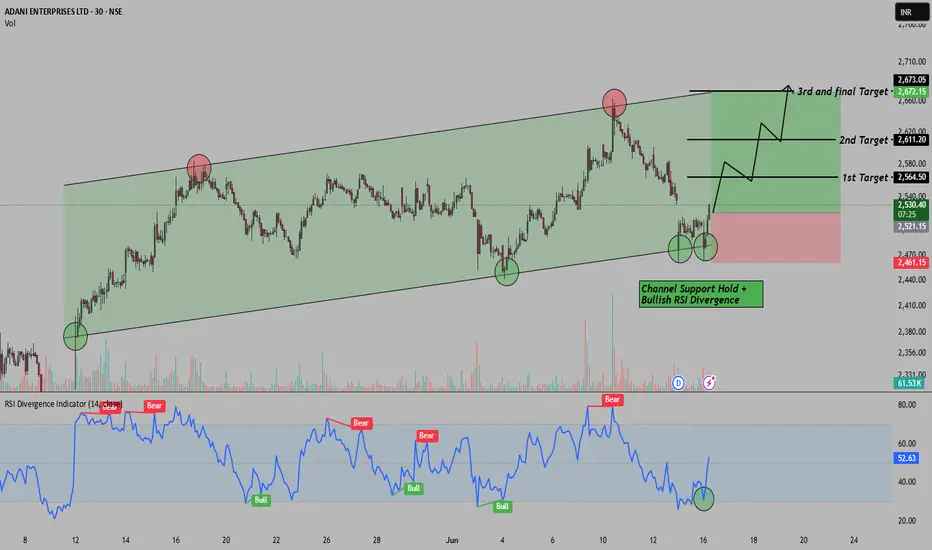
Rising Channel+RSI Divergence=Reversal Setup in Adani EnterpriseHello Everyone, i hope you all will be doing good in your life and your trading as well. Today i have brought a setup in Adani Enterprises , where we’re spotting a short-term reversal opportunity inside a clean rising channel . Price recently tested the channel support for the 3rd time and gave a solid bounce, which is also confirmed by a bullish RSI divergence . This combo often works as a reliable early reversal signal for positional or intraday swing traders. Here we are expecting at least 4%+ move behalf of this setup.
This trade is completely logic based so i placed Stop loss around 2461 for controlled risk. for the targets please check the chart above i have mention there.
Reward-to-Risk Ratio looks favorable here , especially with clear trend structure and momentum support from RSI. Let’s see how this setup plays out!
If you liked this breakdown, don’t forget to LIKE & FOLLOW for more real chart setups, data-backed ideas, and smart money zones.
Disclaimer: This post is for educational purposes only. Do your own research or consult a financial advisor before investing.
XAUUSD – Uptrend, waiting for pullback to enterGold is moving within an ascending channel on the 3-hour timeframe. After touching the resistance zone at 3,445–3,460, XAUUSD shows signs of consolidation and is likely to correct down to the support zone at 3,390–3,400 — aligning with the trendline and EMA34.
Strategy:
Watch for buying opportunities around the 3,390–3,400 zone when there are confirmation signals.
Target: 3,445–3,460, and potentially up to the 3,480–3,500 zone.
Stop loss if price falls below EMA89 (3,352).
Supporting news:
U.S. CPI data for May came in lower than expected (0.0% vs 0.1%) → Raises expectations of an earlier Fed rate cut → Supports the gold uptrend.

BTCUSDT – Rebound from 104,200, recovery opportunity emergingBTCUSDT has bounced back from the 104,200 support zone with a potential double bottom pattern, signaling the return of buying pressure. The price is consolidating around the 106,000–107,000 area. If this zone holds, the probability of retesting the previous high at 110,500 is high.
The EMA34 and EMA89 are narrowing – a sign of weakening selling pressure.
Supporting news:
The Fed kept interest rates unchanged, U.S. CPI slightly declined, and capital inflows from ETFs like BlackRock are returning to the market, creating momentum for recovery.

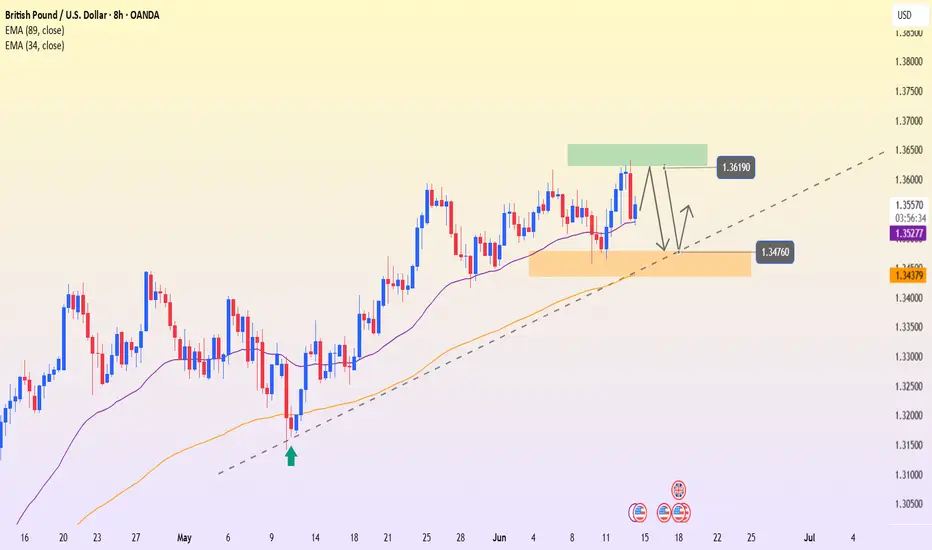
GBP/USD: Continuation or Correction?GBP/USD is in an uptrend, with support at 1.34760 and resistance at 1.36190. EMA (34) at 1.35277 and EMA (89) at 1.34379 are supporting the uptrend.
UK inflation data dropping has strengthened GBP, while USD remains volatile due to expectations of Fed rate hikes. If GBP/USD stays above 1.34760, the uptrend will likely continue.
However, if the price breaks below this level, a deeper correction may occur. The strategy is to buy on a pullback to 1.34760 and sell if support is broken. Manage risk by placing stop-loss orders around key support levels.
EURUSD – Buyers Remain in Control, Awaiting Confirmation SignalThe EURUSD pair posted a slight pullback after reaching the upper resistance zone of the ascending channel around 1.16130 on June 12. However, the bullish structure remains intact, with higher lows and clear respect for the upward channel on the 8H chart.
Technically, the 1.14590 zone — which aligns with both the trendline and the EMA34 — will act as a key support area. If the price holds this level and rebounds, the likelihood of retesting the 1.16130 high is strong. Conversely, a break below 1.14590 could trigger a deeper correction.
On the fundamental side, the euro is supported by expectations that the ECB will maintain its current interest rates, while cooling U.S. CPI data has weakened the dollar.

Gold Surges After FOMC, Eyes Breakout Above 3,515Gold prices surged sharply on June 12 following positive FOMC and CPI results, closing at 3,429 – up more than 1.2%. The technical structure remains firmly within an ascending channel on the 8H chart, with higher lows consistently supported by the EMA34 and trendline.
The 3,488–3,515 resistance zone will be a key test in the coming sessions. If price breaks and holds above this level, the next target will be new highs. Conversely, a minor pullback toward the 3,348 area – aligned with the trendline and EMA – may offer a trend-following buy opportunity if confirmed by price action.
Gold is receiving strong support from cooler U.S. CPI data, which has boosted expectations that the Fed may cut interest rates soon. Additionally, geopolitical tensions in the Middle East and bullish outlooks from major institutions continue to reinforce gold’s safe-haven appeal.

Gold Surges Amid Middle East TensionsXAUUSD – Gold Surges Amid Middle East Tensions | What’s Next After 3430 Break?
🌍 Macro & Geopolitical Overview
Gold prices accelerated sharply in the Asian session on June 13 after Israel launched a large-scale airstrike campaign against Iran, targeting nuclear facilities including the Natanz uranium enrichment site.
Israeli Prime Minister Netanyahu declared the mission would continue until the Iranian nuclear threat is “completely neutralized.”
Iran suffered major losses and scrambled its air force to prepare for retaliation.
WTI oil jumped over 8%, gold spiked to $3,430/oz, and US equities dropped sharply.
While the US claimed it would not participate directly in the attack, it vowed to defend its forces in the region if threatened.
This rapidly escalating geopolitical conflict has triggered a renewed flight into safe-haven assets, with gold leading the pack.
📉 Technical Outlook – M30 / H1 Chart
🔹 Trend Structure
Gold has broken out decisively above 3,392, forming a strong bullish leg and carving new short-term support around 3,412 – 3,426.
Price action is forming a Higher High – Higher Low structure within a rising channel.
🔹 Fair Value Gap (FVG)
A visible FVG between 3,405 – 3,412 has formed. As long as price holds above this zone, bullish continuation is favored.
🔹 EMA Structure
Price is well above all key EMAs (13, 34, 89, 200), confirming a strong bullish environment. EMA13 continues to guide intraday momentum.
🔹 Key Resistance Zone
Watch for potential distribution or profit-taking around 3,441 – 3,456 – a major resistance area if no further escalation occurs.
🧠 Market Sentiment & Behavior
Investor sentiment has shifted firmly into risk-off mode.
Funds are flowing heavily into gold, oil, CHF, and JPY.
Price volatility is likely to spike further, as headlines continue to drive intraday sentiment.
🎯 Updated Trade Setup – 13 June
🔵 BUY ZONE: 3384 – 3382
Stop-Loss: 3378
Take-Profit: 3388 → 3392 → 3396 → 3400 → 3405 → 3410
🔴 SELL ZONE: 3454 – 3456
Stop-Loss: 3460
Take-Profit: 3450 → 3446 → 3442 → 3438 → 3434 → 3430
✅ Conclusion
The renewed conflict between Israel and Iran is fueling gold’s rise as global risk appetite collapses. Technically, the trend remains bullish, but volatility is extremely elevated. Traders should watch key price zones closely and avoid emotional trades during event-driven spikes.
⚠️ Trade the reaction, not the prediction. Let key levels confirm bias before entering.

GBPUSD – Resistance Pressures, Downside Risk EmergingAfter rebounding from the EMA89 area near 1.3500, GBPUSD recovered to approach the 1.3600 resistance zone but was quickly rejected. The H4 chart shows weakening bullish momentum as price retests the previous distribution area without managing a close above it.
The current technical structure leans toward a potential pullback, especially since the EMA34 and trendline support zone has not been broken. If the price breaks back below 1.3500, the next target would be around 1.3440 – the previous key support.
Recent news shows a slight decline in US CPI, temporarily weakening the USD, but the market is now focused on the upcoming FOMC meeting to determine the rate direction. If the Fed maintains a hawkish stance, GBPUSD is likely to come under renewed downward pressure.

EURUSD – Price Holds Uptrend, 1.145 Zone Is the Key to BreakoutOn the H4 timeframe, EURUSD continues to move within a clearly defined ascending channel, consistently bouncing off the trendline and EMA34–89 cluster. Price is now approaching the 1.14500 resistance zone, which previously rejected bullish attempts twice. However, this time, price is consolidating just below resistance, indicating that buying pressure may be building.
If 1.14500 is breached with strong momentum, the next target will be 1.15000. Conversely, if price gets rejected again, the 1.14100 support zone will be crucial to watch for a reaction.
Meanwhile, news from the ongoing US–China trade talks is keeping gold highly volatile, creating a risk-on sentiment and weakening the USD—this may provide additional support for EUR’s bullish trend.

XAUUSD – Testing the Descending Trendline, Awaiting FOMC SignalsGold has rebounded to the 3,371 zone after U.S. CPI data showed cooling inflation, putting pressure on the USD. The price is now approaching the descending trendline and the 3,400 resistance zone – a level that marked the top on June 5.
If this area fails to break clearly, gold is likely to pull back toward the 3,327 support – the confluence of the EMA89 and a recent low. On the other hand, if the FOMC delivers a dovish signal, price could break out and aim for 3,457.
Trade Setup:
SELL near 3,400 if rejection candles appear
BUY near 3,327 if bullish reversal signals show
BUY breakout above 3,405 if FOMC supports further gains

EURUSD – Pressure at the Top, Correction Likely AheadThe EURUSD pair posted strong gains during the June 11 session, breaking through the 1.1480 resistance zone and reaching the top of the ascending channel near 1.15460. However, price action is showing signs of slowing down as it approaches the upper trendline that previously rejected price on June 3.
Currently, if the price fails to decisively break above the 1.15460 area, a technical correction toward the support zone at 1.14180—where the EMA 34 and lower channel line intersect—is highly likely. This zone will be key to monitor for potential trend-following buy opportunities if a clear recovery signal emerges.
Latest data shows U.S. CPI is easing, putting pressure on the USD. However, markets are now focused on tonight’s FOMC decision, which will play a crucial role in determining the next direction for the dollar.

XAUUSD – CPI Data Pushes Gold HigherXAUUSD – CPI Data Pushes Gold Higher | Should You Follow the Trend or Sell the Top?
Gold prices surged strongly after the US CPI report came in lower than expected. This triggered a sharp drop in the US Dollar and yields, while boosting demand for safe-haven assets. The question now: Is this the beginning of a new leg higher, or a setup for a short-term correction?
🌐 MACRO & MARKET SENTIMENT
📰 US CPI (May): Increased only 0.1% MoM and 2.4% YoY vs. forecast of 2.5%.
➤ This softer inflation reading reignited expectations that the Fed may cut rates as early as September.
📉 USD Weakness: The Dollar Index (DXY) dropped ~0.4%, making gold cheaper and more attractive for global investors.
📉 Bond Yields Falling: US 10Y yields declined, further increasing the appeal of gold as a non-yielding safe asset.
💡 Market Psychology: Traders are rotating capital back into gold ahead of FOMC and geopolitical uncertainties (China, Middle East).
📈 TECHNICAL OUTLOOK – H1 & H4 STRUCTURE
🔹 Trend Structure
Gold remains in a Higher High – Higher Low formation since the 3,312 level. Price recently broke above the 3,360–3,374 resistance and is now consolidating around 3,375 — a possible accumulation before breakout.
🔹 Price Channel
Gold is respecting an ascending channel with the lower bound aligning with the key support area at 3,339 – 3,345. As long as this zone holds, bulls are in control.
🔹 EMA Indicators
EMA13 / EMA34: Price is comfortably above both — indicating strong short-term momentum.
EMA89 / EMA200: Both EMAs are well below price action, confirming a medium-term bullish trend.
🔹 Caution Zone
Resistance at 3,392 – 3,395 is a key area to watch for reversal patterns (Pin Bars, Bearish Engulfing, etc.)
If price pulls back to 3,339 – 3,345 and holds, it can offer high-probability long entries with trend continuation.
🎯 TRADE SETUPS
🔵 BUY ZONE: 3324 – 3322
Stop-Loss: 3318
Take-Profit Targets: 3330, 3334, 3338, 3342, 3346, 3350
🔵 BUY SCALP: 3337 – 3335
Stop-Loss: 3330
Take-Profit Targets: 3341, 3345, 3350, 3354, 3360, 3370, 3380
🔴 SELL ZONE: 3392 – 3394
Stop-Loss: 3398
Take-Profit Targets: 3388, 3384, 3380, 3375, 3370, 3360, 3350
🧠 CONCLUSION
The lower-than-expected CPI has given gold a short-term macro boost, and technically, bulls remain in control. However, caution is needed near the 3,392 zone — where price could face strong supply and trigger a pullback.
✅ Trade with confirmation, not assumptions. Let the price action guide your next move.

Gold Holds Breath for CPI – Decisive Catalyst or Price Trap?XAUUSD: Gold Holds Breath for CPI – Decisive Catalyst or Price Trap?
🌍 Macro Landscape: Gold Awaits CPI, Real Interest Rate Pressure
The Gold market (XAUUSD) is in a highly sensitive phase as investors hold their breath for the upcoming U.S. Consumer Price Index (CPI) report during the U.S. session. CPI is the most crucial inflation gauge, and any deviation from expectations can trigger significant market shocks, especially for safe-haven assets like gold.
In this context, real interest rates are playing a pivotal role. If inflation cools faster than anticipated (lower CPI), pressure on the Federal Reserve (Fed) to cut interest rates will increase, leading to a drop in bond yields and making gold more attractive. Conversely, if inflation remains "sticky" (higher CPI), the Fed may maintain a "higher-for-longer" policy stance, pushing bond yields up and putting downward pressure on gold due to the increased opportunity cost of holding the non-yielding asset.
🏦 Central Bank Policy Divergence: Fed's Caution, BoJ's Waiting Game
Federal Reserve (Fed): FOMC members continue to signal patience with rate cuts. Recent inflation data shows persistent price pressures, particularly in the services sector, reinforcing the Fed's hawkish bias. This creates pressure on gold if the USD continues to strengthen due to higher interest rates.
Bank of Japan (BoJ): (While not directly related to XAUUSD, global policy divergence still impacts capital flows and sentiment. For Gold, our focus is primarily on the Fed and other major central banks.)
The divergence in global monetary policies, especially between the Fed and other major central banks, is creating a volatile environment for the gold market.
🌐 Capital Flows: Gold & USD – The Safe-Haven Race Amid Instability
Global capital flow models suggest that the USD and Gold are currently the two most sought-after safe-haven assets amidst geopolitical tensions (such as US-China tensions) and EU fiscal risks.
If the upcoming CPI data surprises the market, it could trigger significant capital flows between the USD (a yielding asset) and gold (a non-yielding asset). A lower-than-expected CPI could boost inflows into gold, while a higher CPI could reinforce USD strength and push gold prices lower.
📊 Technical Structure (M30 Chart): Gold in Decision Zone
On the M30 chart for XAUUSD:
Primary Trend: Gold prices are currently in a consolidation or slight correction phase, accumulating before the CPI news. The EMA 13 - 34 - 89 - 200 indicators present a mixed picture, with the price oscillating around the short-term MAs, while the longer-term MA (EMA 200) still acts as dynamic support/resistance. A "fan-out formation" or MA crossovers will be crucial signals confirming the next trend direction.
Crucial Resistance Zone (SELL Zone): Around 3374 - 3376. This is a strong resistance area where the price has reacted or has the potential to reverse. If the price rallies and approaches this zone before or after the CPI news without breaking through, it presents a potential selling opportunity.
Crucial Support Zone (BUY ZONE): Around 3314 - 3312. This is a strong support area where the price may find significant buying pressure to bounce. If the price corrects to this zone and shows bullish reversal signals (e.g., hammer candle, bullish engulfing), it presents a potential buying opportunity.
🎯 Trade Strategy Recommendations
Scenario 1 – BUY (Await reaction at support):
Entry: 3314 - 3312 (Wait for bullish reversal candle confirmation or strong buying pressure in this zone).
Stop-Loss: 3308 (Just below the support zone for capital protection).
Take-Profit:
TP1: 3318
TP2: 3322
TP3: 3326
TP4: 3330
TP5: 3335
TP6: 3340
Scenario 2 – SELL (Await reaction at resistance):
Entry: 3374 - 3376 (Wait for bearish reversal candle confirmation or strong selling pressure in this zone).
Stop-Loss: 3380 (Just above the resistance zone for capital protection).
Take-Profit:
TP1: 3370
TP2: 3366
TP3: 3362
TP4: 3358
TP5: 3352
TP6: 3348
TP7: 3340
⚠️ Key Events to Watch:
U.S. CPI Report (U.S. session): This is the most critical event, which will dictate gold's primary direction in the short term. Be prepared for strong volatility upon its release.
Any statements from Fed members: Comments on inflation or monetary policy can impact market sentiment.

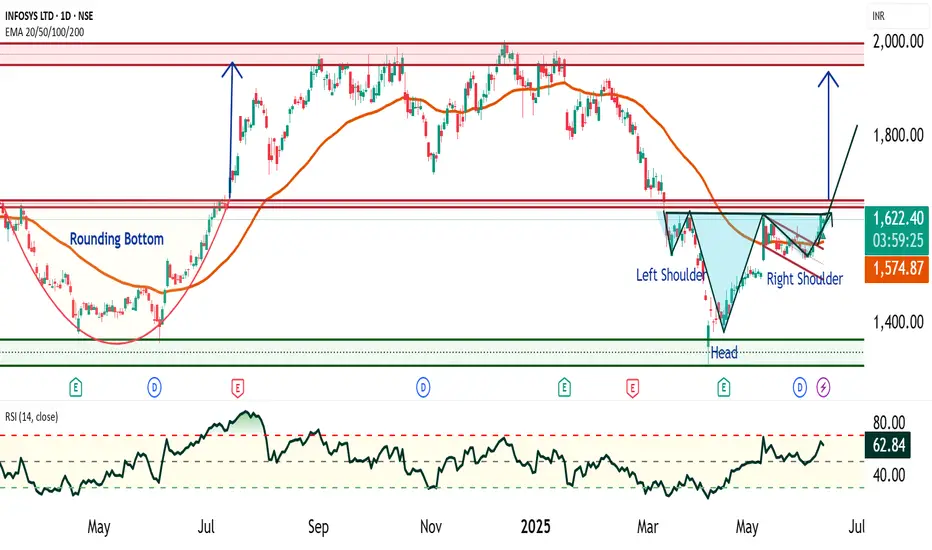
Infosys - Bullish Flag and Head & Shoulder Patterns🔍 1. Infosys Current Price Range and Key Levels
Since January 2021, Infosys has been trading in a broad range between ₹1300 and ₹2000, consolidating for over 4 years. Within this range, there are three key support and resistance levels to watch closely:
Support: ₹1300 (major floor)
Intermediate Resistance/Support Zone: ₹1600 – ₹1650
Strong Resistance: ₹2000 (upper bound)
📈 2. Bullish Flag Pattern: A Bullish Flag is a continuation pattern that forms after a strong upward price move "flagpole", followed by a period of consolidation in a narrow downward or sideways channel "flag". It typically signals a pause before the uptrend resumes.
Infosys recently broke out of a bullish flag pattern and crossed above ₹1580 with a strong closing on higher volume, indicating renewed buying interest.
Price is currently trading above the 50-day Exponential Moving Average (EMA), confirming the continuation of the mid-term uptrend.
However, the zone around ₹1650 remains a strong and key resistance level to monitor closely.
🧩 3. Potential Bullish Head and Shoulders Pattern Above ₹1650
Should Infosys break decisively above ₹1650, it is likely to form another significant bullish pattern known as the Bullish Head and Shoulders.
This pattern signals a trend reversal from bearish to bullish and is considered highly reliable.
Trend: Appears after a downtrend or consolidation, signaling reversal
Touchpoints: Three lows – left shoulder, head (lowest point), and right shoulder, roughly at similar levels
Neckline: The resistance line connecting the highs between shoulders and head
Timeframe: Medium-term, often forming over weeks up to 6 months
Volume: Typically higher volume on left shoulder and head formation, volume dips on right shoulder, and surges on breakout
⚠️ 4. Key Concerns in Infosys Chart Pattern
Price-Volume Divergence: During the head formation, volume increased sharply as price fell — indicating strong selling pressure. However, volume was low when price approached the neckline — suggesting weak buying interest to confirm breakout. This divergence signals potential caution.
Resistance Zone: Price remains below the key resistance at ₹1650, which has acted as a ceiling multiple times. A decisive breakout is required to sustain further upside momentum.
⚠️ Disclaimer
This report is intended solely for educational and training purposes and does not constitute investment advice. Traders and investors should conduct their own research and consult financial advisors before making trading decisions.
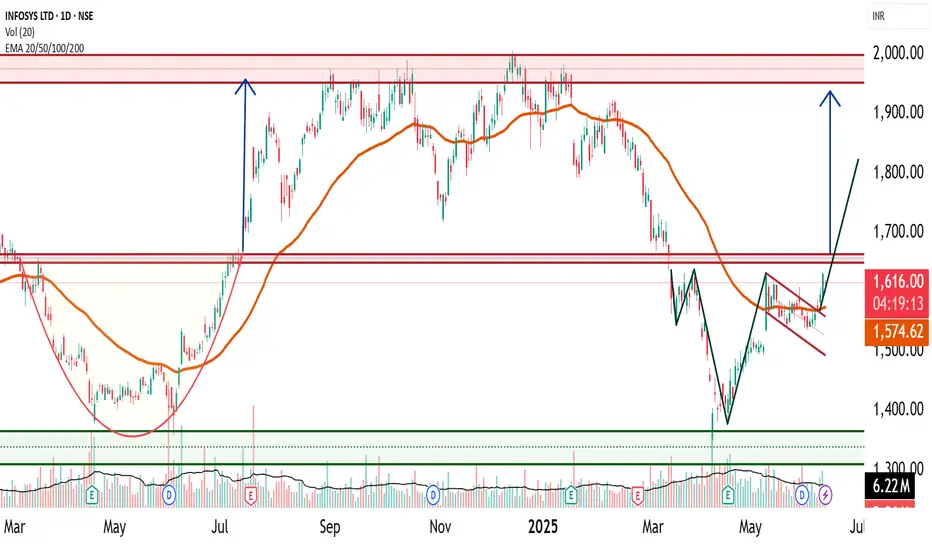
Infosys Technical Research- Flag and Head and shoulders🔍 1. Infosys Current Price Range and Key Levels
Since January 2021, Infosys has been trading in a broad range between ₹1300 and ₹2000, consolidating for over 4 years. Within this range, there are three key support and resistance levels to watch closely:
Support: ₹1300 (major floor)
Intermediate Resistance/Support Zone: ₹1600 – ₹1650
Strong Resistance: ₹2000 (upper bound)
📈 2. Bullish Flag Pattern: A Bullish Flag is a continuation pattern that forms after a strong upward price move "flagpole" , followed by a period of consolidation in a narrow downward or sideways channel "flag". It typically signals a pause before the uptrend resumes.
📊 2. Infosys Recent Technical Development
Infosys recently broke out of a bullish flag pattern and crossed above ₹1580 with a strong closing on higher volume, indicating renewed buying interest.
Price is currently trading above the 50-day Exponential Moving Average (EMA), confirming the continuation of the mid-term uptrend.
However, the zone around ₹1650 remains a strong and key resistance level to monitor closely.
🧩 3. Potential Bullish Head and Shoulders Pattern Above ₹1650
Should Infosys break decisively above ₹1650, it is likely to form another significant bullish pattern known as the Bullish Head and Shoulders (Inverse Head and Shoulders).
Bullish Head and Shoulders
This pattern signals a trend reversal from bearish to bullish and is considered highly reliable.
Trend: Appears after a downtrend or consolidation, signaling reversal
Touchpoints: Three lows – left shoulder, head (lowest point), and right shoulder, roughly at similar levels
Neckline: The resistance line connecting the highs between shoulders and head
Timeframe: Medium-term, often forming over weeks up to 6 months
Volume: Typically higher volume on left shoulder and head formation, volume dips on right shoulder, and surges on breakout
⚠️ 4. Key Concerns in Infosys Chart Pattern
Price-Volume Divergence: During the head formation, volume increased sharply as price fell — indicating strong selling pressure. However, volume was low when price approached the neckline — suggesting weak buying interest to confirm breakout. This divergence signals potential caution.
Resistance Zone: Price remains below the key resistance at ₹1650, which has acted as a ceiling multiple times. A decisive breakout is required to sustain further upside momentum.
⚠️ Disclaimer
This report is intended solely for educational and training purposes and does not constitute investment advice. Traders and investors should conduct their own research and consult financial advisors before making trading decisions.
USDJPY – Momentum Fades Near 146 BarrierUSDJPY is approaching the significant resistance level at 146.020 following a parabolic rebound. This area previously triggered a sharp sell-off, and a minor double top pattern may be forming. If price gets rejected here, the support zone around 144.470 (EMA89 + demand zone) becomes a likely target for a pullback.
The recent upside was supported by hawkish comments from BoJ Governor Ueda, but the main market focus remains on the U.S.–China trade talks. If tensions ease, the USD could weaken, supporting the bearish scenario for USDJPY.

XAUUSD – Weak Rebound, Downside Pressure RemainsGold is currently testing the 3,339 resistance zone – a confluence with the EMA34 and EMA89, which has rejected price multiple times before. The current rebound is weak, suggesting that buyers are struggling. The bearish structure is becoming clearer with lower highs. If gold fails to break this resistance, it could retreat to 3,303; a break below that would likely open the way down to the 3,264 support level.
On the news front, the gold market is being heavily influenced by the ongoing U.S.–China trade negotiations in London. This major event could spark unpredictable volatility. If tensions ease, safe-haven demand for gold may fade, further supporting the short-term bearish outlook.

RTNPOWER – A Classic Price Action Study Around Major Trendlines🟦 Dotted Blue Line
Represents the main counter trendline, stretched over a significant duration. Price has currently pushed above it, but the weekly candle is still open.
⬜ White Line (Hidden CT)
A hidden resistance line, drawn from key lower highs. Price is currently reacting near this line — acting as a logical area where sellers might test control ( for my setups )
🟨 Yellow Zones
These levels highlight higher lows, a sign of evolving structure. These bases often add context to the strength behind a breakout move.
🔴 Red Line (MTF Resistance)
Plotted from historical monthly rejection zones — a crucial area for confluence and reaction.
🛠️ Only sharing my Charting — no recommendations, no forecasting .
