Multi time frame charting explained in GEPILI make educational content videos for swing / positional trading GLong07:17by Averoy_Apoorv_Analysis1115
BTCUSDT – Strong rebound, waiting to break previous highsBitcoin is maintaining a fairly positive uptrend after bouncing from the support zone around 105,245 USDT – a confluence area of the EMA89 and previous lows on the 8H chart. Currently, the price has approached the key resistance area between 110,192 and 111,931, which has previously rejected bullish attempts twice. Price action suggests that BTC may temporarily pull back to gather momentum before continuing to test the green resistance zone around 113,331. A short-term accumulation pattern is forming with a higher-low structure – a good sign for buyers as long as the price holds above the 106,000 area. On the news front, investor sentiment has improved following weaker U.S. jobs data, reinforcing expectations that the Fed may cut interest rates sooner. This has prompted a return of safe-haven flows to the crypto market, adding fuel to BTC’s upward momentum.Longby Femal_Updated 118
GBPUSD – Choppy Below Resistance, Risk of Renewed WeaknessOn the H4 chart, GBPUSD is trading within a narrow range, fluctuating between 1.35740 and 1.34880. Each upward attempt toward the resistance zone has been quickly rejected. The price structure shows lower highs forming, while support areas are gradually moving lower. The EMA34 and EMA89 are starting to flatten out, indicating the main trend is becoming increasingly unclear. If the price breaks below the 1.34880 level, a clear downtrend will be confirmed, and the scenario of a return to the long-term trendline becomes more plausible. The key upcoming event is the U.S. CPI report, expected within the next 24 hours. If the data shows inflation remains high, the Fed will have less incentive to cut interest rates, potentially boosting the USD and putting downward pressure on GBPUSD.Shortby Femal_Updated 2244
EURUSD – Steady accumulation, ready for a fresh breakout?After a slight correction, EURUSD is trying to stabilize around the support zone of 1.13840 – which coincides with the EMA89 and a historically strong price reaction area. Although there hasn’t been a clear breakout yet, recent price action still shows an effort to maintain the bullish structure as the higher lows remain intact. If buyers can take advantage of this support and build momentum, the next target could very well be the 1.14780 zone – an area that has rejected price multiple times and now serves as a key resistance level for the bulls. Beyond the technical picture, the market is also awaiting this week's CPI, PPI, and NFP data. If these numbers come in weaker than expected, the likelihood of the Fed cutting rates sooner will rise – a positive signal for EURUSD. Moreover, with ongoing geopolitical risks, defensive capital flows may continue to exit the USD, giving the euro an edge in the coming sessions.Longby Femal_Updated 1
GOLD IN SIDEWAY PHASE, WAITING FOR A BREAKOUT THROUGH KEY LEVELSXAU/USD TRADING PLAN 10/06/2025 – GOLD IN SIDEWAY PHASE, WAITING FOR A BREAKOUT THROUGH KEY LEVELS! 🌍 MACRO CONTEXT – FUNDAMENTAL ANALYSIS Geopolitical tensions and monetary policy: The market is currently in a wait-and-see phase, with major decisions pending from important meetings, especially statements from the Federal Reserve (Fed) and global conflict situations. These factors could have a significant impact on market sentiment and volatility in gold. Weak economic data from major economies such as the U.S. and the Eurozone indicates challenging economic conditions, leading investors to view gold as a safe-haven asset. Interest rates: Although the Fed continues its rate hike policy, financial market uncertainties could continue to support gold as a preferred asset class. 📉 TECHNICAL ANALYSIS On the M30–H1 timeframe, XAU/USD is currently moving within a rising channel. After the correction in Wave 4, gold has bounced back in the 335x region and is now preparing to confirm the next trend. Signals from EMA indicate accumulation, potentially setting up for a strong rally ahead. Key resistance levels: 3,338 – 3,345 (unexplored FVG region). If gold breaks above 3,345, a continued rise to 3,353 is highly likely. Key support levels: 3,282 – 3,275. If gold retests these levels without breaking them, the chances of a rebound are strong. 🎯 TRADE SETUPS FOR TODAY 🔵 BUY ZONE: Entry: 3,302 - 3,304 SL: 3,296 TP: 3,306 → 3,310 → 3,314 → 3,318 → 3,325 🔴 SELL ZONE: Entry: 3352 - 3354 SL: 3,358 TP: 3,348 → 3,344 → 3,340 → 3,330 → 3,320 ⚠️ NOTE: Risk management: Expect significant volatility as the market awaits important news this week. Wait for confirmation: Technical signals are for guidance; clear confirmation from the charts is needed before entering trades. 📌 CONCLUSION: Gold is currently in a sideway phase and may be preparing for a breakout if these key support and resistance levels are breached. Traders should monitor both macroeconomic factors and strategic price zones to make informed trading decisions.Longby MMFlowTrading39
XAUUSD – Holding support, eyeing breakout aheadGold has paused its decline after falling out of the ascending channel and is now testing the support area around 3,279 USD. This zone is a confluence of a key demand area and recent swing lows. If this level holds, XAUUSD may rebound to retest the resistance near 3,358 USD – where the EMA34 and EMA89 are also positioned. Notably, the long-term bullish structure remains intact, and price action may be forming a consolidation phase before a potential upward move. If upcoming CPI, PPI, and NFP data come in weaker, expectations of a Fed rate cut could rise – a factor that typically supports gold. Additionally, ongoing geopolitical tensions continue to bolster gold’s safe-haven appeal.Longby Femal_3
XAUUSD – Breaks Support Line, Risk of Deeper CorrectionOn the H4 timeframe, gold has officially broken below the ascending trendline formed since mid-May, after several successful retests. This is a clear sign that the short-term uptrend is losing momentum. Following the trendline breakdown, price is currently making a mild pullback, retesting the confluence zone of EMA34–EMA89 around 3,323 to 3,336 USD. However, if this zone continues to act as resistance, the pullback pattern will complete and open up the possibility of further decline toward the next support area around 3,264 USD – which previously held price well. Moreover, gold remains under pressure due to the US dollar’s strong rebound amid expectations that the Fed will maintain high interest rates. Hot CPI and PPI forecasts are delaying rate cut hopes, further weighing on gold prices.Shortby Rocky_trade_2
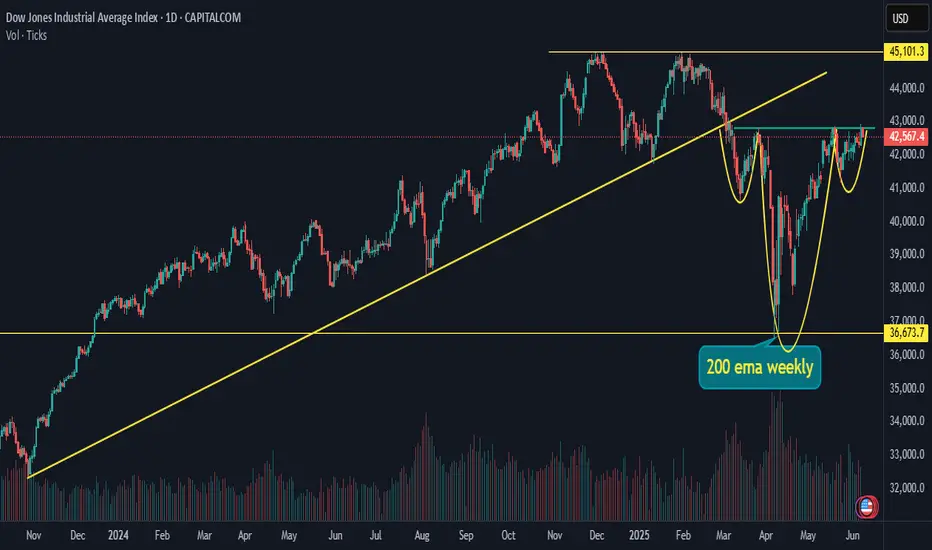
US 30 / Dow Jones / DJI forming bullish patternLooking at US30 US market is forming a bullish pattern called inverted Head and shoulder breakout can lead to a target of all time high. Longby GOURAV_DHOOT4
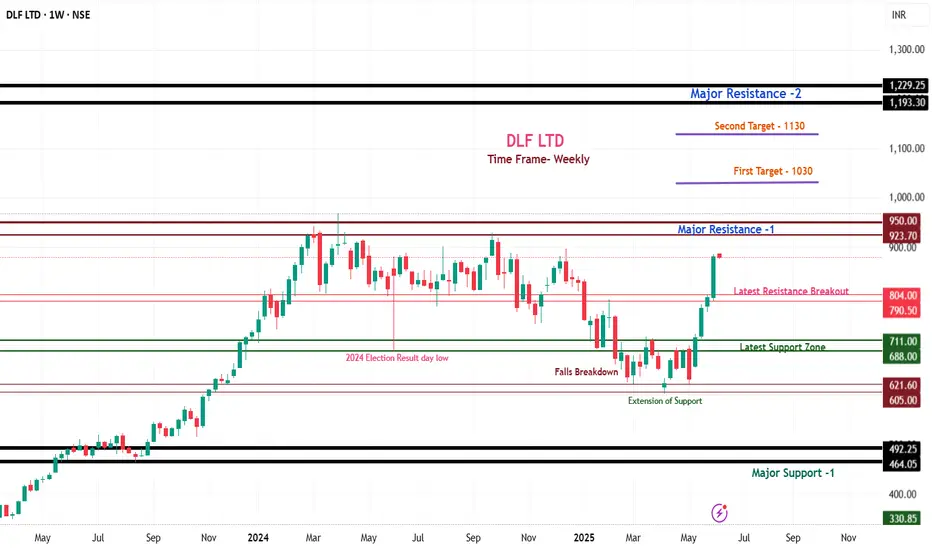
DLF Limited Technical Analysis & Trading Strategy DLF Limited – Weekly Chart Analysis (Technical View) Company Background: Founded in 1946, DLF Limited is India’s largest real estate developer, renowned for its premium residential and commercial projects. With iconic developments and vast land holdings across Delhi-NCR, Mumbai, and Bengaluru, DLF is a dominant player in high-end real estate. Core Business Segments Commercial Properties: IT Parks, retail malls (e.g., DLF CyberHub, DLF Emporio), Grade-A offices. Residential: Luxurious apartments, gated communities in prime locations. Land Bank: Extensive holdings in urban growth centers. Leasing & Rentals: Strong recurring income from office and retail leasing. This analysis is based on the weekly time frame, offering a medium- to long-term outlook for positional and swing traders. Chart Structure Overview: 1. DLF is currently trading around ₹878 and has shown a strong recovery after retesting its breakout zone of ₹804–₹790. The structure indicates bullish momentum. 2. But a major resistance zone lies between ₹923 and ₹950. Price action near this zone will be crucial in determining the next directional move. Bullish Scenario – If ₹950 Breaks with Volume: The zone of ₹923 to ₹950 is a major hurdle, acting as a resistance ceiling. A weekly close & sustain above ₹950 will confirm a strong breakout. After that: First Target: ₹1,030 Second Target: ₹1,130 to ₹1,180 🔽 Bearish Scenario – If Price Fails Near ₹950 The immediate support zone lies at ₹804–₹790, which earlier acted as resistance. If the price fails to hold this level: Next support seen at ₹711 to ₹688 A breakdown below ₹688 could lead to a deeper fall towards ₹605 to ₹621 If ₹605 breaks decisively, further downside could extend toward ₹492–₹464, which is a **major long-term support on the chart Conclusion: 1. This is a weekly chart-based analysis, ideal for swing or positional trades. The ₹950 level is the key breakout zone for the next bull leg. 2. As long as the price remains above ₹804, the structure remains positive. Below ₹688, trend may weaken significantly. 💬 Found this chart breakdown helpful? 👍 Like | 💭 Comment | ➕ Follow for more weekly chart analysis and breakout setups! Published on TradingView – DLF Limited | Weekly Analysis Longby manojshinde272
ADANIENT (Adani Enterprises)ADANIENT has been consolidating from a long time. After tapping at demand zone it started making higher high-higher lows formation and now at resistance level. Breakout from here may give a really good move, keep eyes on it. ✅ If you like my analysis, please follow me as a token of appreciation :) in.tradingview.com/u/SatpalS/ 📌 For learning and educational purposes only, not a recommendation. Please consult your financial advisor before investing. by SatpalS1
Godrej Properties Chart Analysis: Bullish or Bearish Move Ahead? Godrej Properties – Chart Analysis & Trading Strategy Company Background: Godrej Properties, a branch of the renowned Godrej Group, began its journey in the real estate sector in 1990. The company has gained recognition for its focus on innovative and sustainable construction methods. It actively develops eco-friendly housing and commercial infrastructure projects, especially in the mid-income segment. Core Business Areas Residential Projects: Offers a wide range—from budget homes to premium apartments—with sustainability as a core design principle. Commercial Developments: Develops business parks, malls, and office complexes. Sustainable Construction: Implements green building practices and energy-efficient technologies across its developments. Subsidiaries Include: Godrej Construction Godrej Fund Management Why Consider Godrej Properties for Long-Term Investment? 📈 Rising Demand in Mid-Segment Housing: Driven by demographic shifts and urban growth. 🔗 Smart Business Partnerships: Asset-light model helps reduce risk and capital expenditure. 🌱 Sustainability Appeal: Well-aligned with global ESG goals, making it attractive for ethical and green investors. Godrej Properties Technical Analysis – Key Levels to Watch Godrej Properties is currently trading near ₹2,460, showing strong momentum after a recent recovery. However, the stock is approaching a critical resistance zone that will determine its next major move. Key Resistance Zone Major Resistance: ₹2,550 – ₹2,575 This zone is crucial. A decisive breakout above ₹2,575 on strong volume can lead to significant upside. Bullish Scenario (Breakout) If the stock closes above ₹2,575, it may trigger a fresh rally. First Target: ₹2,800 Second Target: ₹3,000 Momentum traders should watch for price action confirmation above this level for potential long entries. Bearish Scenario (Rejection at Resistance) If ₹2,575 is not breached, the stock may face selling pressure. Immediate Support: ₹2,240 – ₹2,215 If this zone breaks, the next key level to watch is ₹2,000, which acted as a strong support in the past. A breakdown below ₹2,000 could shift the trend to bearish in the medium term. Summary Current Price: ₹2,460 Critical Resistance: ₹2,550 – ₹2,575 Upside Targets: ₹2,800 → ₹3,000 (after breakout) Downside Supports: ₹2,240 → ₹2,215 → ₹2,000 Traders should closely track price behavior around the ₹2,575 level, which is likely to define the next directional move. As always, use proper risk management and wait for confirmation before entering trades. Like this analysis? 👍 Don’t forget to like, comment your views, and follow for more actionable stock insights and breakout trade setups! 📈 Stay tuned for latest updates, key level revisions, and momentum alerts on Godrej Properties and other trending stocks. by manojshinde273
Waiting for the Breakout: Consolidation or Trend Continuation?XAUUSD – Waiting for the Breakout: Consolidation or Trend Continuation? Gold (XAUUSD) is trading within a narrowing range, building momentum after rebounding from the 3.276 support area. Despite short-term uncertainties, the overall macroeconomic landscape continues to favor bullish scenarios — though key resistance levels must be cleared to confirm continuation. 🌍 MACRO & MARKET SENTIMENT USD Weakness: The DXY continues to trade under pressure, increasing the appeal of non-yielding assets like gold. US–China Trade Talks: Ongoing high-level negotiations in London could either ease geopolitical tensions or fuel safe-haven demand, depending on outcomes. Global Risk Appetite: With US debt ceiling concerns still looming and the Fed showing hesitancy to cut rates soon, gold remains in focus as a hedge. 📈 TECHNICAL OUTLOOK (30M–H1) The price has formed a descending wedge structure and is hovering near key EMAs (13–34–89–200). A breakout above 3,334 could trigger a short-term bullish wave, while failure at this zone would likely lead to deeper correction toward 3,276 or lower. 📍 STRATEGIC KEY LEVELS Resistance: 3,334 – 3,336 – 3,362 – 3,390 Support: 3,300 – 3,276 – 3,250 🧭 TRADING SCENARIOS 🔵 BUY ZONE: 3,276 – 3,274 SL: 3,270 TP: 3,280 → 3,284 → 3,288 → 3,292 → 3,296 → 3,300 🔻 SELL SCALP: 3,334 – 3,336 SL: 3,340 TP: 3,330 → 3,326 → 3,322 → 3,318 → 3,314 → 3,310 🔻 SELL ZONE: 3,362 – 3,364 SL: 3,368 TP: 3,358 → 3,354 → 3,350 → 3,346 → 3,340 → 3,335 → 3,330 → 3,320 ✅ SUMMARY Gold remains in a critical range, and traders should focus on well-defined zones to capitalize on volatility. Use confirmation-based entries and respect risk parameters — especially as macro headlines and technical patterns align for a potential breakout.Longby MMFlowTrading4
XAUUSD – Shaky below resistance, clear bearish signal formingGold is showing signs of weakness after retesting the resistance area around 3,394 USD. The current price structure indicates a failed minor rebound – most likely a false breakout, suggesting the potential for another leg down. On the H4 chart, price has slipped below the EMA34 and is heading toward the EMA89 zone. If selling pressure continues, the next target will be the strong support around 3,167 USD. A break below this level could trigger a deeper decline toward the 3,114 USD zone. Notably, price action is forming a short-term “lower high” – a classic characteristic of a downtrend. The strategy now is to closely monitor the retracement zone around 3,320–3,330 USD for reversal signals, rather than trying to catch a bottom too early.Shortby Rocky_trade_4
XAUUSD – Reaccumulating below key resistanceGold is following the textbook pattern of a strong uptrend on the D1 chart. After bouncing from the support zone around EMA34 and EMA89, the price is continuing to consolidate just below the major resistance around 3,397.500 USD. What’s notable is that this level previously rejected price, so the current pause in momentum is understandable. However, as long as the price holds above the support zone around 3,171.600 USD – which aligns with EMA89 and the prior demand zone – the bullish structure remains intact. The most reasonable scenario now is to wait for a clear bounce from the EMA region or a confirmed breakout above resistance. If a breakout occurs, the next target will likely be the previous high around 3,434.500 USD. On the news front, U.S. jobless claims have slightly increased this week, reinforcing expectations that the Fed will keep interest rates unchanged – an indirect boost for gold. Longby Rocky_trade_Updated 16
Inside 2 Weekly Timeframe CT Breakouts With Strong VolumesPurely chart-based view. No bias. No advice. Just how I interpret these right now I make educational content videos on Swing trading . Long05:34by Averoy_Apoorv_Analysis5523
USDJPY – Buying momentum builds, uptrend in sightUSDJPY has just bounced strongly from the key support zone around 142.510 – a level that has acted as a “fortress” over the past two weeks. Price action is gradually regaining momentum, forming a potential double bottom and heading toward a retest of the long-term descending trendline. Currently, the 144.800–145.000 area is the nearest resistance, aligning with both the EMA and the descending trendline. If buyers maintain control, a breakout above this zone could pave the way for the next leg up toward 145.750 and beyond. In terms of news, the latest U.S. ISM Services data came in weaker than expected, reducing rate hike expectations. While this puts mild pressure on the USD, the reaction from USDJPY suggests the market is leaning toward a rebound rather than a breakdown.Longby Rocky_trade_Updated 41
NFP STORM BREWING: WILL GOLD BREAK HIGHER OR DIVE LOWER?XAUUSD – NFP STORM BREWING: WILL GOLD BREAK HIGHER OR DIVE LOWER? Gold enters a highly sensitive phase ahead of tonight’s Non-Farm Payrolls (NFP) release – one of the most influential data points for global financial markets. With US-China trade tensions rekindling and sovereign debt concerns mounting in the US, the yellow metal could experience a major breakout or a sharp reversal during the New York session. 🌍 MACRO & FUNDAMENTAL OUTLOOK US-China trade talks have resurfaced, with concerns around tariffs and strategic metals dominating headlines. China's recent stance signals it may take stronger defensive actions. The US national debt is projected to hit $55 trillion by 2034, prompting global central banks to ramp up gold purchases as a strategic hedge. Fed Chair Powell reiterated a “no rush to cut” stance, yet political pressure is mounting – especially with Donald Trump urging immediate rate cuts following the weakest ADP job growth in two years. Unemployment Claims released today came in slightly better than expected (236K vs. 240K), adding fuel to speculations around a softer NFP print – potentially bullish for gold. 🔍 TECHNICAL ANALYSIS (H1 – EMA 13/34/89/200) The chart shows a clean impulsive wave structure. After hitting the resistance zone at 3408–3410, gold entered a consolidation range. Price is currently hovering around EMA 89–200, suggesting trend divergence and uncertainty ahead of NFP. A breakdown below the 3344–3332 support zone could push price down to the FVG (Fair Value Gap) at 3320, which may act as a strong liquidity pool for buyers. ⚠️ KEY LEVELS TO WATCH Resistance: 3380 – 3392 – 3408 – 3436 Support: 3365 – 3350 – 3344 – 3332 – 3320 🧭 TRADE SETUPS 🔻 SELL ZONE: 3408 – 3410 Stop Loss: 3415 Take Profit: 3404 → 3400 → 3395 → 3390 → 3380 → 3370 → 3360 → 3350 🔵 BUY ZONE: 3318 – 3316 Stop Loss: 3310 Take Profit: 3322 → 3326 → 3330 → 3335 → 3340 → 3350 → 3360 → ??? ✅ CONCLUSION Gold is poised for a volatile breakout with NFP acting as the key catalyst. A soft jobs report may trigger a breakout above 3410, while stronger-than-expected numbers could fuel a bearish reversal. In this sensitive phase, traders should stick to defined zones and wait for confirmed liquidity reactions rather than chasing price impulsively.by MMFlowTradingUpdated 2
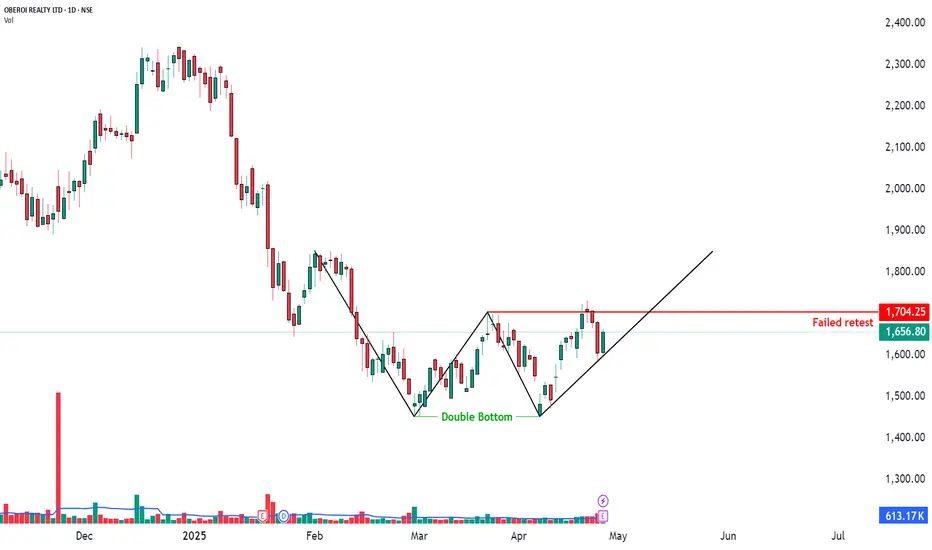
Double Bottom but Failed Breakout Retest | Daily Time Frame📉 OBEROI REALTY LTD – Double Bottom but Failed Breakout Retest 📅 Date: April 28, 2025 📈 Timeframe: Daily Chart 🔍 Stock: Oberoi Realty Ltd (NSE) 📌 Technical Overview: A Double Bottom pattern was formed indicating bullish reversal potential. Price attempted a breakout above the neckline near ₹1704.25, but the retest failed — price could not sustain above the breakout zone. Price is currently trading at ₹1656.80, under the trendline support. 🧩 Key Observations: ✅ Double bottom structure was confirmed. ❌ Breakout retest failed — caution needed. 📉 Watch trendline support (black line) closely — breakdown could trigger weakness. 📊 Volume during the failure was moderate (not aggressive selling yet). 🧠 Observational Bias: Weak below the trendline support. Bulls must reclaim and hold above ₹1704.25 to regain strength.by simpletradewithpatienceUpdated 111
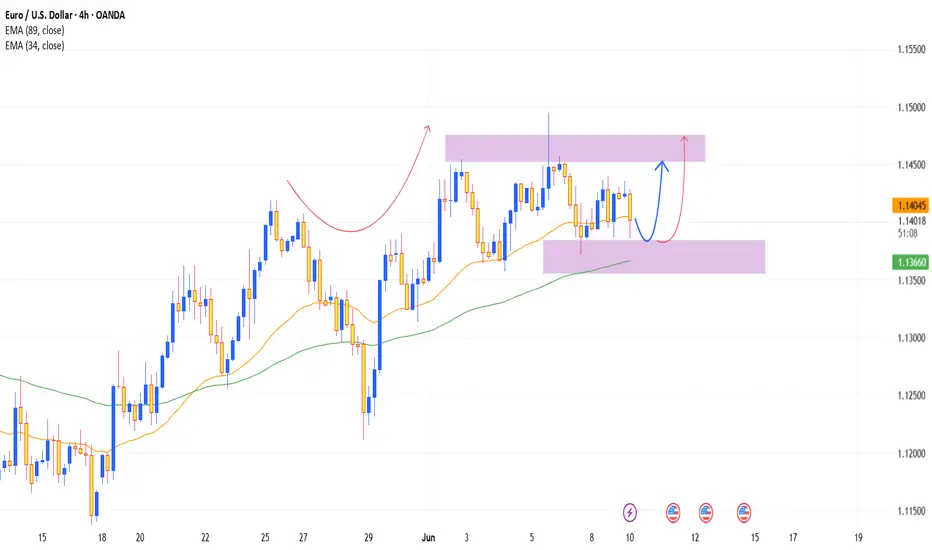
EURUSD – Strong uptrend, Non-farm could trigger breakoutEURUSD continues to maintain a steady uptrend within a well-defined ascending channel. Each pullback has been well absorbed around the EMA 34–89 and the dynamic support zone near 1.13650, signaling that buyers remain in control. Currently, price is approaching the key resistance area around 1.14840 – a level that previously triggered a rejection. If it fails to break through again, a minor pullback toward the support zone followed by a bounce, as shown in the chart, is a likely scenario. What’s worth noting is that the Non-Farm Payroll report is due later today – a potential catalyst that could either fuel a breakout or break the current channel. If U.S. job data comes in weaker than expected, the USD may face selling pressure, providing a strong boost for the euro.Longby Rocky_trade_11
XAUUSD – Awaiting Non-Farm, will gold hold its ground?The H8 chart shows gold retesting a key resistance zone around 3,426 USD after an impressive recovery run. Price action remains solid above the rising trendline and is supported by the EMA 34–89, indicating that the bullish structure is still well intact. However, the upper resistance zone is causing some hesitation in the market. If gold fails to break through immediately, a minor pullback toward the 3,330 – 3,290 USD area is highly possible. If this zone holds, it would present a good opportunity to rejoin the uptrend. On the news front, today’s spotlight is the U.S. Non-Farm Payrolls report. If the jobs data comes in weaker than expected, expectations for a Fed rate cut will likely increase – a scenario that could benefit gold significantly as a non-yielding asset.Longby Rocky_trade_1
USDJPY – Downtrend Continues, 143.500 Is the Key ZoneUSDJPY is moving within a clear descending channel and is now approaching the strong resistance area at 143.500 – where the EMA 34, EMA 89, and the upper trendline all converge. Historically, each time price touched this zone, a strong rejection followed. If the same happens again, we could see a move back down to 142.000 and potentially 140.500. On the fundamental side, the recently released U.S. ISM Services data disappointed, fueling expectations that the Fed might cut rates sooner – adding bearish pressure to the USD. Preferred scenario: watch for price reaction around 143.500 to enter a short position in line with the downtrend.Shortby Rocky_trade_Updated 4
EURUSD – Lower highs emerging, bearish signal in sight?Although the lower-than-expected jobless claims forecast could support a mild USD recovery, EURUSD is still holding above the EMAs in the short term. However, signs of weakness have begun to appear as price continues to get rejected around the 1.14800 zone – which aligns with a descending trendline that has been tested multiple times. Currently, EURUSD is forming a lower high pattern on the H4 chart, indicating growing selling pressure. If this pattern continues and price breaks below the 1.13800 area, a deeper correction toward the 1.13600 support zone could be triggered. This level has repeatedly supported price in the past and coincides with the confluence of the 34 and 89 EMAs.Shortby Rocky_trade_Updated 110
EURUSD – Strong push but might run out of steamEURUSD has just bounced nicely off the 1.13400 support zone. Price is now climbing back toward the previous high around 1.14500 – which looks promising, but also comes with some risk. This is a level that previously triggered a strong reversal, so if price fails to break through again, a pullback toward the lower EMA region is quite possible. On the chart, I can see price approaching the upper boundary of the ascending channel, while buying momentum seems to be fading. If we see a reversal candlestick pattern or long upper wicks forming in this area, it might be an early sign of a short-term drop. What about the news? The latest JOLTS report shows job openings in the US are slowing down, raising concerns about the labor market. At the same time, US–China trade tensions are flaring up again, and President Trump's unclear remarks on tariffs are making investors more cautious with the USD.Shortby Rocky_trade_Updated 25