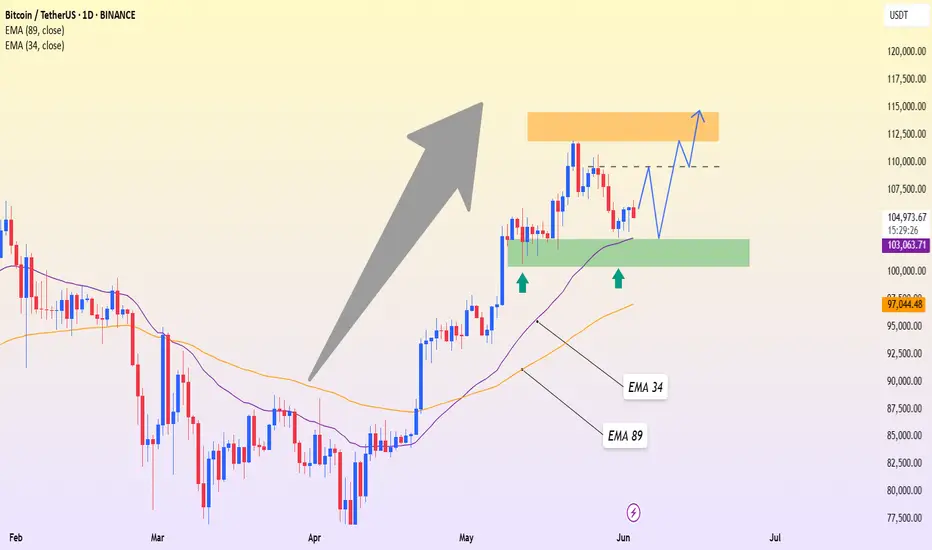
BTCUSDT – Squeezed enough, ready to explode?Bitcoin is currently trading within a converging triangle pattern – a setup every trader knows often signals an imminent breakout. The price is sitting between the EMA 34 and EMA 89, consolidating right above the long-term ascending trendline, indicating that buying pressure is still quietly in control.
The 105,000 – 106,000 USDT area is the key resistance zone to watch. If BTC breaks through this level decisively, it could trigger a new bullish wave aiming for 110,000+.
On the news front, market sentiment has turned optimistic again after the SEC Chairman hinted at the possibility of approving more Bitcoin ETFs in the upcoming quarter. This has given a strong psychological boost to the buying side.
Technical Analysis

EURUSD – In a tough spot as USD regains momentumThe sharp rise in ADP and ISM PMI forecasts is shifting market expectations: the Fed is now less likely to cut interest rates soon. This immediately supports the USD recovery and puts pressure on major currency pairs – EURUSD included.
Looking at the H4 chart, we can see price being rejected around the 1.14480 resistance zone, right when the EMA 34 and 89 lines are starting to tighten – a sign that the bullish momentum is fading. At this point, price appears to be heading back toward the 1.13300 support zone, which has held several times before. If this level breaks, the bearish move could extend toward 1.12890.

GBPUSD – Stalling at resistance, correction ahead?The market is reacting to a series of strong US economic data, especially the rising expectations for ADP and ISM PMI figures. This has boosted the USD, putting pressure on major currency pairs, including GBPUSD.
Looking at the H4 chart, GBPUSD is trading near the resistance zone around 1.35959 while also testing a long-term descending trendline – a level that has previously rejected price multiple times. Notably, although price is still holding above the EMA 34 and 89 support zone, recent candles reflect clear hesitation, suggesting the pair is “stuck at a crossroads.”
A reasonable technical scenario: if the price continues to be rejected at 1.35959 and breaks below the EMA confluence and support area at 1.34994, a short-term downtrend may resume. The nearest target would be around 1.34530 – a strong technical support that has held up price in the past.

Gold Stalls Ahead of Key Trade TalksGold Stalls Ahead of Key Trade Talks – Will Price Explode Out of the 3345–3370 Range?
After Monday’s explosive rally, gold is currently consolidating within a tight price range. The market is at a critical juncture, awaiting high-level trade talks between the U.S. and China — an event that could serve as a major catalyst for the next directional move.
🌍 MACRO OUTLOOK & MARKET SENTIMENT
A major trade call between Trump and President Xi Jinping is on the horizon. This conversation could reset global trade expectations and potentially trigger large moves in risk assets.
Last week’s strong U.S. jobs data (NFP) pushed back expectations of Fed rate cuts. Treasury yields remain elevated, which is temporarily capping gold’s upside.
Market sentiment is neutral-to-cautious, with traders waiting for confirmation of a breakout or breakdown before committing capital to new positions.
📈 TECHNICAL ANALYSIS (H1 – EMA 13/34/89/200)
Gold appears to be in a wave 4 correction, consolidating after completing wave 3.
EMAs remain aligned to the upside (bullish), suggesting the broader trend still favors buyers.
Key range:
Above 3370 → breakout confirmation → momentum push toward 3400–3410
Below 3345 → breakdown → fast dip to 3310–3300 to complete wave 4 and initiate wave 5 upward
🧭 STRATEGIC ZONES
🔵 BUY ZONE: 3317 – 3315
Stop Loss: 3310
Take Profits:
3322 → 3326 → 3330 → 3334 → 3338 → 3345 → 3350 → 3360
This zone aligns with a strong FVG + EMA89 support. A bullish reaction here could provide a high-probability entry for the next impulsive leg upward (wave 5).
🔻 SELL ZONE: 3372 – 3374
Stop Loss: 3378
Take Profits:
3368 → 3364 → 3360 → 3356 → 3350 → 3345
3370 is a critical resistance zone. Any rejection at this level with weak momentum or divergence could open a short-term bearish correction back toward 331x levels.
✅ SUMMARY
Gold is trapped in a decision zone between 3345–3370. The market awaits clarity from macro headlines and technical breakout signals. Until then, traders should watch key levels closely, stay patient, and position accordingly based on price action confirmation at strategic zones.

BTCUSDT – Still Has Upside Potential, as Long as Support HoldsBitcoin is showing strong signs of recovery after retesting the support zone around 102,574 – which also aligns with the 34 EMA on the D1 chart. This bounce suggests that buying pressure remains intact and the market continues to respect the overall bullish structure.
If BTC can hold this area over the next few sessions, a breakout toward the resistance zone at 114,461 is a realistic scenario. With enough momentum, price might even break above the previous high and head toward the 118,000+ region.
That said, the 102,500 – 103,000 area is now the “make-or-break” zone. If it gets breached, the uptrend could be in jeopardy, and BTC might correct deeper toward the 89 EMA.
XAUUSD – Pullback ahead of potential breakout above 3,433The latest forecasts show that both ADP and ISM PMI data in the US are rising, reflecting a stronger-than-expected economic recovery. This has led the market to scale back expectations of an imminent Fed rate cut. As a result, the dollar is gaining strength, putting short-term downward pressure on gold.
On the H4 chart, XAUUSD is trading within a consolidation range between two key levels: support at 3,346 and resistance at 3,433. Price was recently rejected at the previous high but has not shown any clear reversal signal. The 34 and 89 EMAs are acting as a technical cushion, keeping the broader bullish trend intact.
The scenario to watch: if price continues to stabilize around the 3,346 zone without breaking below, a clean consolidation structure could form. In that case, a breakout above 3,433 would be a confirmation signal for another bullish wave—opening the door to higher targets ahead.

USDJPY – Rebounding from Support after Positive PMI DataIn the latest session, USDJPY is gradually regaining its upward momentum after the US released a better-than-expected manufacturing PMI. The data suggests that the US industrial sector remains strong, reducing pressure on the Fed to ease policy. As a result, the US dollar benefited, lifting USDJPY off its recent technical bottom.
On the H4 chart, the pair is trading within a sideways range between 142.200 and 144.800. Each time it approaches the 142.200 level, buying pressure returns, forming a solid support zone. Although EMA 34 and EMA 89 are slightly sloping downward, the signals are not strong enough to break the current accumulation structure.
Expected scenario: if the price continues to hold above the 142.200 support zone and forms a solid accumulation pattern, USDJPY is likely to bounce toward the 144.800 area – which may act as the next short-term resistance. On the contrary, if the support breaks, the structure could shift into a more bearish outlook.

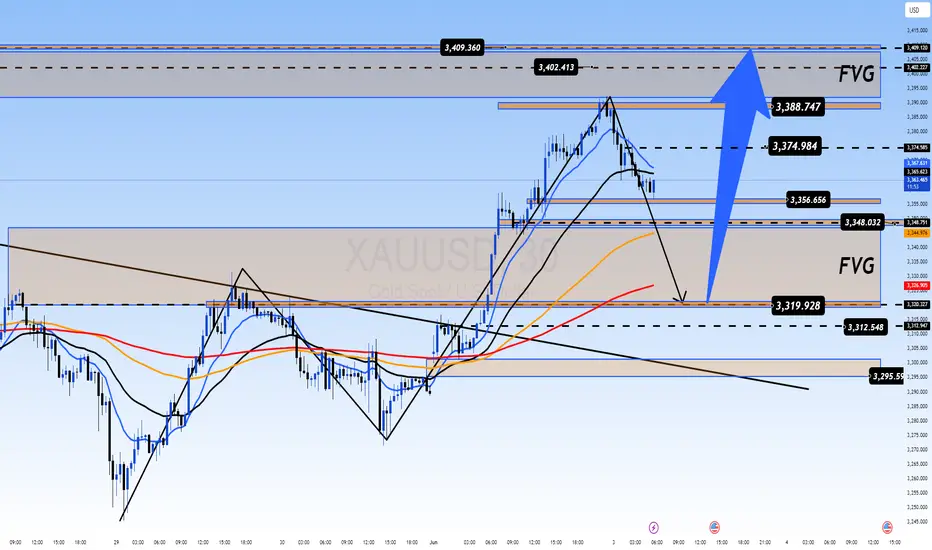
MARKET WAITS FOR TRUMP–XI TRADE CALL XAUUSD PLAN – JUNE 3XAUUSD PLAN – JUNE 3 | GOLD CORRECTS AFTER $100 SURGE | MARKET WAITS FOR TRUMP–XI TRADE CALL
After an explosive $100+ rally earlier this week, gold has entered a sharp correction phase, dropping $30 during the Asian session. This pullback comes as the market anticipates a high-level trade call between former President Trump and President Xi Jinping, which could reshape short-term expectations around US–China relations and global risk sentiment.
🌍 MACRO CONTEXT – POLITICS MEETS FINANCE:
The upcoming Trump–Xi call is expected to guide markets over the next few sessions and may impact trade risk positioning.
Investors have begun profit-taking following the aggressive rally, leading to temporary risk-off sentiment and cash-out flows.
From an Elliott Wave perspective, wave 3 (the strongest wave) may have completed, and price could now retrace into lower FVG zones to gather liquidity for the next upward move.
📈 TECHNICAL STRUCTURE (H1–H4 – EMA 13/34/89/200):
On higher timeframes (H4 and D1), gold maintains a strong bullish structure.
Price appears to have peaked near 3,402 – 3,409, and is now retracing toward the key FVG support zone between 3,320 – 3,310.
EMAs are beginning to compress after a strong expansion – suggesting the market may consolidate or correct further in the short term.
🧭 KEY PRICE LEVELS:
Support: 3,346 – 3,340 – 3,318 – 3,310 – 3,295
Resistance: 3,374 – 3,388 – 3,402 – 3,410
🔍 TRADE SETUPS:
🔵 BUY ZONE: 3,320 – 3,318
Stop Loss: 3,314
Take Profits:
3,324 – 3,328 – 3,332 – 3,336 – 3,340 – 3,344 – 3,350 – 3,360 – 3,374+
Buy on dips into the liquidity zone or after confirmation candles near EMA13–34 support. Ideal entry for positioning ahead of a potential wave 5 continuation.
🔻 SELL ZONE: 3,388 – 3,390
Stop Loss: 3,394
Take Profits:
3,384 – 3,380 – 3,376 – 3,370 – 3,366 – 3,360 – 3,350
Sell only if there is a strong rejection or bearish divergence near the recent highs – this zone marks the top of wave 3 and potential exhaustion.
📌 SUMMARY:
Gold’s macro structure remains bullish, but short-term corrections are expected. Price may dip into FVG zones to absorb liquidity before launching the next move. Avoid FOMO and follow technical zones with disciplined SL.
Support Flips, Trendline Snaps — Weekly Chart Speaks!A counter-trendline breakout (white line) is underway on the Weekly Time Frame (WTF), supported by strong structural confluences:
🔹 Pattern size is substantial, with price consolidating for several months before breakout.
🔹 The yellow zone represents a prior support, which later broke down — now acting as a resistance-turned-breakout zone, a classic supply flip.
🔹 Recent breakout candle shows strength, emerging after taking support from the 200 DEMA, reinforcing the base.
🔹 MTF resistance (dashed yellow line) is marked — remains the next significant obstacle on higher timeframes.
No trading/investment advice. Purely educational .

Gold: Signs of exhaustion after the surge?We’ve just witnessed a fairly impressive rally in gold at the start of the week — not too surprising given that the latest JOLTS data showed a slowdown in U.S. job openings, coupled with a sudden escalation in U.S.–China trade tensions. With growing risk aversion, it’s no wonder investors are turning to gold as a “safe haven.”
But here’s the catch: is this rally sustainable?
On the H4 chart, gold has just revisited the old resistance zone around 3,384 — a level that previously pushed prices sharply lower. As price approached this zone, we started seeing upper wick rejections, signaling that buying momentum is fading.
A possible scenario: If price fails to decisively break above 3,384 and continues to get rejected on subsequent retests, there’s a high chance gold may pull back toward the support area around 3,288. This is also the “lifeline” zone near the EMA 34–89, which may act as short-term support.

BULLISH GAP CONFIRMS BREAKOUT STRUCTUREXAUUSD PLAN – JUNE 2 | BULLISH GAP CONFIRMS BREAKOUT STRUCTURE | GOLD REGAINS SAFE-HAVEN DEMAND
The new trading week kicks off with a strong bullish gap in gold, signaling renewed investor confidence in safe-haven assets amid rising geopolitical tensions. With the US dollar showing early signs of weakness and no clear direction from the Fed, gold is quickly regaining strength as a defensive play.
🌍 MACRO CONTEXT:
US–China trade tensions and renewed Middle East geopolitical risks are pushing capital into gold as a risk hedge.
The US dollar is pulling back slightly, weighed by concerns over the upcoming labor data and persistent inflation.
Institutional portfolios are reportedly increasing exposure to gold as a hedge against macro instability.
➡️ In this context, gold has strong short-term upside potential, especially if price holds above the key breakout zone.
📈 TECHNICAL ANALYSIS (H1 – EMA 13/34/89/200):
Price has broken out above the descending trendline and EMA200, confirming bullish momentum.
All EMAs (13–34–89–200) are aligned upward, supporting continuation of the uptrend.
As long as gold holds above 3,309, bulls will likely target previous highs near 3,348 and 3,361.
🔍 TRADE PLAN – JUNE 2:
🔵 BUY ZONE: 3,295 – 3,293
Stop Loss: 3,289
Take Profit Targets:
3,300 – 3,304 – 3,308 – 3,312 – 3,316 – 3,320
Ideal scenario: wait for a retest of the breakout zone or EMA support (13/34) for a low-risk long entry.
🔻 SELL ZONE: 3,347 – 3,349
Stop Loss: 3,353
Take Profit Targets:
3,343 – 3,340 – 3,336 – 3,332 – 3,328 – 3,324 – 3,320
Only consider SELL if there's a strong rejection or bearish divergence at the highs.
📌 SUMMARY:
The bullish gap at the start of the week is a strong signal of trend continuation. Priority should be given to long setups if the price structure stays above key EMAs. Watch for potential fakeouts during NY session or Fed-related headlines. Stick to tight risk management.

Price Action Case Study: Weekly Price action chart of SIGACHI 🔹 Key Structural Elements:
-White Solid Line: Primary Counter-Trendline (CT) connecting multiple swing highs, acting as dynamic resistance over several months.
-White Dotted Lines: Hidden supply lines derived from intermediary highs, often acting as secondary resistance.
-Yellow Lines: Higher timeframe resistance zones (MTF) — offering confluence markers for potential supply zones ahead.
🔹Volume Expansion:
The breakout candle is supported by significant volume (~36M), indicating strong participation. Volume here acts as a confirmation trigger, suggesting institutional interest or broad-based buying.
🔹Structure:
The breakout occurs after an extended consolidation and a series of higher lows.

XAUUSD Technical Analysis | Week 2nd - 7th JuneHi,
I am sharing my view on gold for week 2nd to 7th June.
Disclaimer: This is only for education purpose.
Thanks

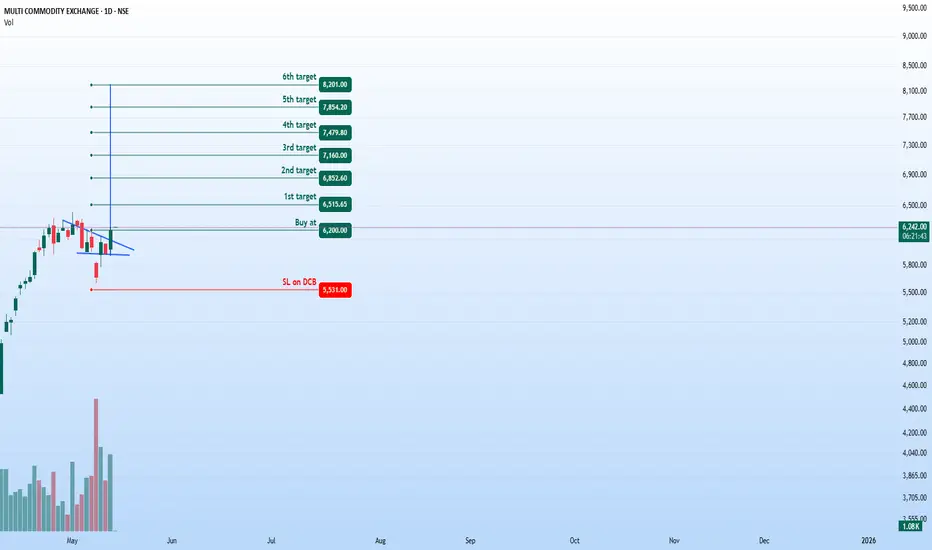
MCX - Bullish Breakout Opportunity (Daily Timeframe)Stock: MCX ( NSE:MCX )
Trend: Bullish Momentum Building 🚀
Risk-Reward Ratio: 1:3 (Favorable Setup)
Trade Parameters
🎯 Entry Zone: ₹6,200 (Breakout Confirmation)
🛑 Stop Loss: ₹5,531 (Daily Closing Basis) (~10.8% Risk)
🎯 Target Levels:
₹6,515.65
₹6,852.60
₹7,160.00
₹7,479.80
₹7,854.20
₹8,200 (Final Target)
Technical Rationale
✅ Bullish Flag Breakout - Price has broken out from consolidation pattern
✅ Strong Momentum - Daily & Weekly RSI >60 (Bullish territory)
✅ Volume Confirmation - Breakout volume 868K vs previous day's 571K (~52% increase)
✅ Technical Structure - Higher highs and higher lows formation
Key Observations
• The breakout comes with significantly higher volume
• Multiple targets allow for progressive profit booking
• Attractive 1:3 risk-reward ratio
• Strong technical structure supporting bullish case
Trade Management Strategy
• Consider partial profit booking at each target level
• Move stop loss to breakeven after Target 1 is achieved
• Trail stop loss to protect profits as price progresses
• Watch for volume confirmation on upside moves
Disclaimer ⚠️
This analysis is strictly for educational purposes and should not be construed as investment advice. Trading in financial markets involves substantial risk and is not suitable for all investors. Past performance is not indicative of future results. Always conduct your own thorough research and consult with a qualified financial advisor before making any investment decisions. The author assumes no responsibility for any trading losses that may occur from using this information.
What do you think? Are you watching this breakout on NSE:MCX ? Share your views in the comments!
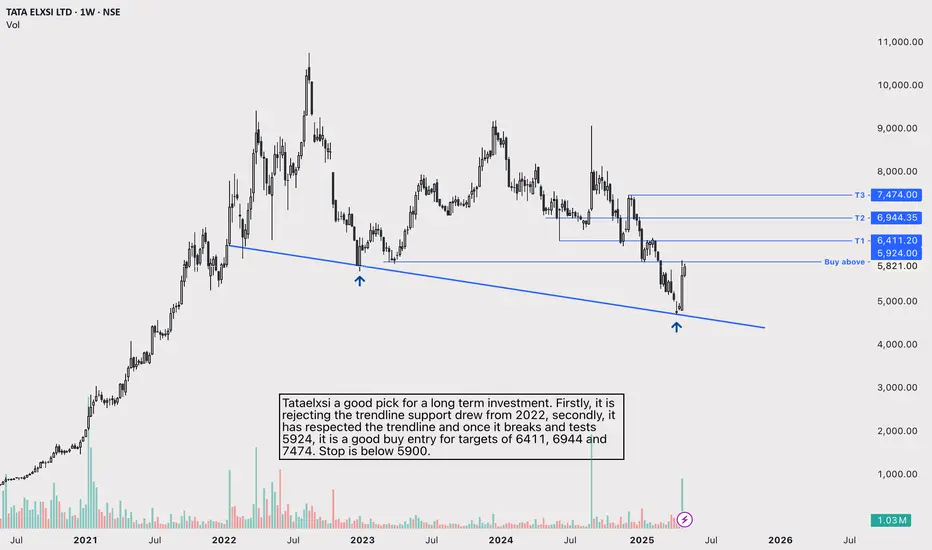
Bullish setup for TATAELXSITataelxsi a good pick for a long term investment. Firstly, it is rejecting the trendline support drew from 2022, secondly, it has respected the trendline and once it breaks and tests 5924, it is a good buy entry for targets of 6411, 6944 and 7474. Stop is below 5900.
XAUUSD PLAN END-OF-MONTH CASHOUT OR TREND REVERSAL? XAUUSD PLAN – MAY 30 | GOLD DROPS SHARPLY IN ASIAN SESSION | END-OF-MONTH CASHOUT OR TREND REVERSAL?
Gold surprised the market this morning with a sharp drop of nearly $30/oz, despite closing yesterday with a strong bullish daily candle. Profit-taking pressure near month-end and uncertainty surrounding US–China trade negotiations have returned gold to a bearish technical structure in the short term.
🌍 MACRO OVERVIEW:
US–China trade talks show no clear progress, with both sides signaling a cautious and non-committal stance.
Hedge funds and large players may be exiting ahead of monthly/weekly candle closes, causing increased volatility.
Meanwhile, investors are waiting for key US PCE inflation data and more Fed speeches, keeping risk sentiment fragile.
➡️ The market remains technically weak and highly reactive. Price is vulnerable to quick liquidity sweeps and false breakouts — best to stay reactive and trade confirmed zones.
📈 TECHNICAL ANALYSIS (H1 – EMA 13/34/89/200):
Gold has broken below EMA89 and is now trading beneath all major EMAs, indicating a strong short-term downtrend.
The resistance zone at 3,322–3,324 aligns with the EMA200 and a descending trendline, making it a prime area for short entries on rejection.
Key support sits at 3,266–3,264. A break below could send price to test deeper levels at 3,235 or even 3,210, following the broader descending channel.
The 3,274–3,276 zone (EMA13 crossing below EMA34) may offer minor reactions for scalpers in the London session.
🔍 TRADE SETUPS FOR TODAY:
🔵 BUY ZONE: 3,266 – 3,264
Stop Loss: 3,260
Take Profits:
3,270 – 3,274 – 3,278 – 3,282 – 3,286 – 3,290 – 3,300
🔻 SELL ZONE: 3,322 – 3,324
Stop Loss: 3,328
Take Profits:
3,318 – 3,314 – 3,310 – 3,306 – 3,300 – 3,295 – 3,290 – 3,280
🎯 INTRADAY SCALPING IDEAS:
BUY SCALP: 3,274 – 3,276 | SL: 3,270 | TP: 1R (50 pips max)
SELL SCALP: 3,302 – 3,304 and 3,310 zone | SL: 50–60 pips | Flexible TP
📌 SUMMARY:
The current momentum is bearish. Focus on short setups unless price clearly reclaims key EMAs. Scalping opportunities exist around reaction zones. With month-end volatility at play, avoid FOMO and stick to strict SL discipline.
💬 Found this plan helpful? LIKE – COMMENT – FOLLOW for daily GOLD strategies from the MMF Team, crafted for serious traders in India and beyond!

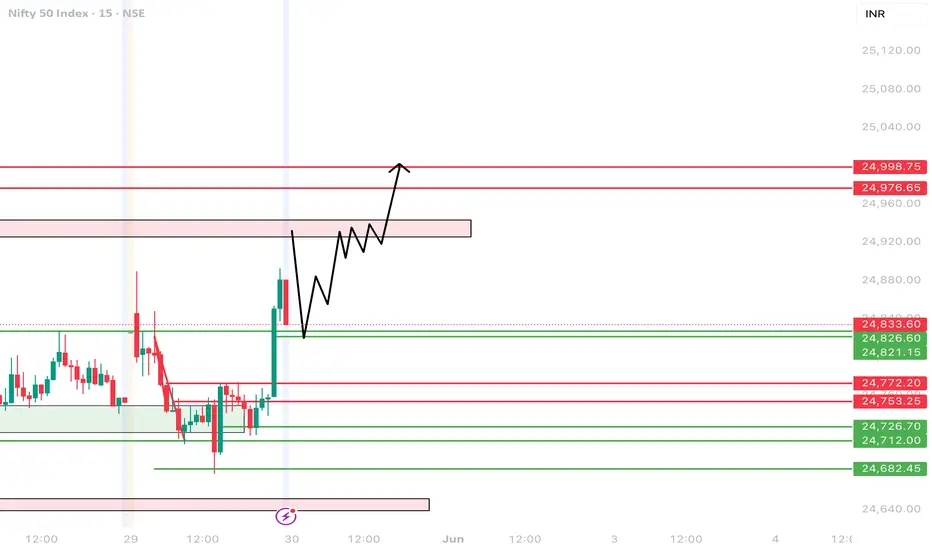
Nifty Technical Analysis | 30 May 2025Hi,
I am sharing my view on Nifty for 30 May 2025.
Disclaimer: This is only for education purpose.
Thanks
XAUUSD Technical Analysis | 29 May 2025Hi,
I am sharing further view on gold for 29 May.
Disclaimer: This is only for education purpose.
Thanks

GOLD RETESTING KEY ZONES AHEAD OF INFLATION DATA XAUUSD PLAN – MAY 29 | GOLD RETESTING KEY ZONES AHEAD OF INFLATION DATA | HOLDING OR BREAKING?
After yesterday’s sharp decline, GOLD is showing signs of stabilization around the 3,270 region. This appears to be a consolidation phase before the market reacts to key macro events — particularly the upcoming Core PCE inflation report and a string of Fed speeches this week.
🌍 MACRO LANDSCAPE:
US 10-year yields are holding steady near 4.5%, continuing to pressure gold in the short term.
Fed officials remain cautious about rate cuts, pushing back against dovish expectations.
However, concerns over structural fiscal pressure (including Fed losses and budget cuts) support the long-term bullish case for gold.
➡️ In the short term, the market remains range-bound, and tactical entries near key zones offer the best opportunities.
📈 TECHNICAL OUTLOOK (H1):
Gold is consolidating below a major resistance zone at 3,308–3,310, which aligns with the descending trendline and 200 EMA.
Fibonacci retracement zones (0.5–0.618) also highlight strong resistance around 3,297–3,309.
On the downside, support at 3,263 is key; a break below may expose the broader demand zone near 3,246.
🔍 TRADE SETUPS – MAY 29:
🔵 BUY ZONE: 3,247 – 3,245
Stop Loss: 3,241
Take Profit Targets:
3,251 – 3,255 – 3,260 – 3,264 – 3,270 – 3,275 – 3,280
🔵 BUY SCALP: 3,263 – 3,261
Stop Loss: 3,257
Take Profit Targets:
3,266 – 3,270 – 3,275 – 3,280 – 3,290 – 3,300
🔻 SELL SCALP: 3,294 – 3,296
Stop Loss: 3,300
Take Profit Targets:
3,290 – 3,286 – 3,282 – 3,278 – 3,274 – 3,270 – 3,260
🔻 SELL ZONE: 3,308 – 3,310
Stop Loss: 3,314
Take Profit Targets:
3,304 – 3,300 – 3,296 – 3,292 – 3,288 – 3,280
📌 STRATEGY TIP:
Price is range-bound ahead of key data. Avoid entering mid-range. Wait for price to reach the edges (BUY/SELL zones) and look for clear rejection or confirmation candles. Stick to strict risk management.

XAUUSD Technical View 29 May 2025Hi,
I am sharing my view on gold for intraday.
Disclaimer: This is only for educational purpose.
Thanks

XAUUSD PLAN – MAY 28 |WATCHING FOMC + EU TRADE TENSIONS XAUUSD PLAN – MAY 28 | GOLD REBOUNDS SLIGHTLY BUT REMAINS UNDER PRESSURE | WATCHING FOMC + EU TRADE TENSIONS
Gold staged a mild technical recovery after last week’s heavy sell-off of nearly $100. While the bounce offers short-term opportunities, overall structure remains under bearish pressure unless bulls can reclaim the upper distribution zone.
🌍 MACRO CONTEXT – TRADE POLICY & MONETARY UNCERTAINTY:
Trump has delayed the 50% tariff on EU goods until July, calling recent trade talks “positive.”
In response, US 10-year yields spiked back above 4.55%, signaling market expectations for prolonged high interest rates.
Meanwhile, the Fed has announced a 10% workforce cut due to ongoing operational losses from interest payments — a rare move that underscores deeper fiscal constraints.
➡️ With mixed risk sentiment and no clear policy direction, Gold remains a safe-haven focus — but vulnerable in the short-term if yields and the dollar continue to rise.
📈 TECHNICAL OUTLOOK (H1):
Gold is currently trading below the 3,335–3,346 resistance zone, which has repeatedly rejected bullish attempts.
If price fails to reclaim this zone, we could see renewed bearish momentum toward the lower FVG support.
The Fair Value Gap near 3,248 remains a major zone of interest if sellers regain control.
🔍 TRADE PLAN – UPDATED LEVELS:
🔻 SELL ZONE: 3,344 – 3,346
Stop Loss: 3,350
Take Profit: 3,340 – 3,336 – 3,332 – 3,328 – 3,324 – 3,320
🔻 SELL SCALP: 3,326 – 3,328
Stop Loss: 3,332
Take Profit: 3,322 – 3,318 – 3,314 – 3,310 – 3,305 – 3,300
🔵 BUY SCALP: 3,278 – 3,276
Stop Loss: 3,272
Take Profit: 3,282 – 3,286 – 3,290 – 3,294 – 3,298 – 3,302 – 3,310
🔵 BUY ZONE: 3,246 – 3,244
Stop Loss: 3,240
Take Profit: 3,250 – 3,254 – 3,258 – 3,262 – 3,266 – 3,270 – 3,280
📌 STRATEGY TIP:
Avoid mid-range entries. Let price come to your zones. Prioritize confirmed reactions, especially near structural levels like 3,335 and 3,248.

INDIAN TELEPHONE INDUSTRIED LTD - NSE | Daily Chart📊 INDIAN TELEPHONE INDUSTRIES LTD (ITI) – NSE | Daily Chart
📅 Date: May 28, 2025
📈 Current Price: ₹309.25 (+9.99%)
📌 Ticker: NSE:ITI
🧠 Technical Analysis Overview
✅ Cup & Handle Breakout 🍵📈
Price action has formed a classic Cup & Handle pattern — a bullish continuation setup indicating a potential uptrend continuation. The breakout is confirmed with a strong bullish candle and significant volume surge today.
✅ Volume Confirmation 📊
Today’s breakout above the ₹288 resistance comes with massive volume (~11.6M), validating strong buyer interest and momentum behind the move.
📍 Key Price Levels
📌 Breakout Level:
✅ ₹288.05 (Previous resistance flipped into support)
📌 Immediate Resistance / Targets
🎯 ₹340 – ₹360 (Short-term target based on pattern projection)
🎯 ₹400+ (Medium-term upside potential if momentum sustains)
📌 Support
🟨 ₹288 (Breakout retest zone)
🟥 ₹270 (Handle support)
📈 Trade Idea
Breakout Entry: ₹290–₹305
Retest Entry: Near ₹288 (if price revisits)
Stop Loss: Below ₹270
Target 1: ₹340
Target 2: ₹360
Target 3: ₹400
⚠️ Disclaimer
This chart analysis is for educational and informational purposes only. Not financial advice. Always do your own research before investing.

Inverted Head & Shoulders Breakout | VIKAS LIFESCIENCES🟡 Structure Breakdown:
Left Shoulder: A lower low, continuing the bearish trend.
Head: A deeper low marking the climax of selling.
Right Shoulder: A higher low—a pivotal sign of accumulation and shifting sentiment.
✅ Supply-Demand Flip Zone Cleared:
Price has convincingly closed above the green zone, which acted as both prior supply and recent demand—now serving as a supportive launchpad.
✅ Counter-Trendline (CT) Breakout:
A clean breakout of the white counter-trendline confirms the structural reversal. This breakout is not only technical—it’s also volume-backed with ~24M shares traded, reinforcing conviction.
✅ Volume Confirmation:
Breakout accompanied by surging volume—an essential ingredient for validating any bullish setup. Indicates institutional activity or broader market participation.
