XAUUSD Pullback to Demand Zone @ 4400 - 4390Gold (XAUUSD) faced a strong rejection from the 4500 supply zone, triggering a healthy corrective move. Price is now approaching a key demand area between 4400 – 4390, where buyers are expected to step in.
If this support holds, we anticipate a bullish bounce with upside targets at 4425, 4435, and 4450.
This zone could offer a high-probability buy setup for short-term to intraday traders, provided bullish confirmation appears.
📌 Disclaimer:
This analysis is for educational purposes only and is not financial advice. Always manage risk and follow your trading plan.
Your feedback drives our content and keeps everyone trading smarter. Let’s make those pips together! 🚀
Happy Trading,
– The InvestPro Team
Technical Analysis

Gold (XAUUSD) Shows Head & Shoulders BreakdownGold on the 1-hour timeframe has formed a clear Head and Shoulders reversal pattern, signaling a potential shift from bullish momentum to a corrective or bearish phase. The structure is well-defined, with a visible left shoulder, a higher head, and a lower right shoulder, indicating weakening buying strength after the recent rally.
The neckline zone, highlighted around the 4,440–4,445 area, acted as a crucial support and demand region earlier. Price has now broken below this neckline and is struggling to reclaim it, which confirms the breakdown of the pattern. This behavior suggests that sellers are gaining control, and any pullback toward the neckline is likely to face selling pressure rather than fresh buying.
As long as Gold remains below the neckline, the bias stays bearish. The projected move, based on the height of the head-to-neckline, points toward a downside target near the 4,380–4,385 zone. Minor pullbacks or consolidations may occur in between, but unless price reclaims and sustains above the neckline, the risk remains tilted toward further downside.
From a trading perspective, this is a classic example of trend exhaustion after a strong upside move. Bulls should be cautious at current levels, while bears can look for continuation setups on weak pullbacks, keeping risk tightly managed. The overall structure clearly indicates that Gold is no longer in a strong bullish phase on the intraday chart and is now transitioning into a corrective move.

SOLARINDS - STWP Equity Snapshot📊 STWP Equity Snapshot – SOLARINDS
(Educational | Chart-Based Interpretation)
Solar Industries India Ltd
________________________________________
📌 Intraday Reference Levels (Structure-based | Observational)
Reference Price Zone: 13,739
Risk Reference (Structure Invalidation): 13,089
Observed Upside Zones (Supply Ahead):
14,518 → 15,039
________________________________________
📌 Swing Reference Levels (Hybrid Model | 2–5 Days | Observational)
Reference Price Zone: 13,739
Risk Reference (Structural Breakdown): 12,764
Higher Range Projection (If structure sustains):
15,689 → 17,151
________________________________________
🔑 Key Levels – Daily Timeframe
Support Zones:
13,290 | 13,129 | 12,904
Resistance Zones:
13,766 | 13,901 | 14,062
________________________________________
🔍 STWP Market Read
SOLARINDS is displaying a strong recovery structure from a well-defined demand zone, following an extended corrective phase. Price has reclaimed intermediate resistance with impulsive candles and expanding volume, suggesting renewed buyer dominance rather than a weak pullback bounce.
Momentum indicators remain supportive, with RSI near 64.7, indicating strength without immediate exhaustion. Volume participation is decisively above average (Vol X ~2.11), highlighting institutional involvement during the recovery leg. Overall structure reflects trend continuation potential, while risk remains elevated due to prior overhead supply zones.
________________________________________
📊 Chart Structure & Indicator Summary
Structure: Demand-led recovery with breakout attempt
Trend: Upward bias developing
Momentum: Strong and expanding
RSI: Bullish zone, not overextended
Volume: High, confirming participation
Volatility: Expanding (normal in trend resumption phase)
________________________________________
📈 Final Outlook (Condition-Based)
Momentum: Strong
Trend: Up
Risk: High (wide range & supply overhead)
Volume: High
________________________________________
💡 STWP Learning Note
Strong moves are sustained by structure and participation, not predictions. The edge lies in risk calibration, patience, and clean post-trade reviews—not forecasting outcomes.
________________________________________
⚠️ Disclaimer
This content is an educational market interpretation based on chart structure and publicly available data. It does not constitute investment advice, a recommendation, or solicitation. Markets involve risk. Please consult a SEBI-registered financial advisor before making any trading or investment decision.
📘 STWP Approach
Observe momentum. Respect risk. Let structure guide decisions.
🚀 Stay Calm. Stay Clean. Trade With Patience.
💬 Did this add value?
🔼 Boost to support structured learning
✍️ Share your views or questions in the comments
🔁 Forward to traders who value disciplined analysis
👉 Follow for clean, probability-driven STWP insights
🚀 Stay Calm. Stay Clean. Trade With Patience.
Trade Smart | Learn Zones | Be Self-Reliant 📊

Nifty Sideways Uptrend 1 HR Timeframe Nifty is currently in a sideways-to-uptrend structure on the 1-hour timeframe. Price is hovering near an important zone which can act as either a breakout or a reversal point. The next upside and downside levels are clearly marked on the chart for reference. A sustained move above resistance can open further upside, while rejection from this zone may lead to a pullback toward support. Watch price action closely around these levels for confirmation before taking trades.

Nifty Near at Make-or-Break ZoneNifty is currently trading near a highly sensitive decision area on the 1-hour timeframe, where a rising support trendline is intersecting with a short-term corrective structure. Price has already formed a sequence of higher highs and higher lows in the recent swing, indicating that the broader intraday trend is still bullish. However, repeated rejection from the rising resistance zone near the recent highs suggests that buyers are losing momentum at higher levels.
The marked “make-or-break” zone around the 26,000–26,050 area is extremely important. This region is acting as a dynamic support, backed by the rising trendline and previous demand. As long as Nifty holds above this support and shows a bullish reaction, a bounce toward the 26,300–26,450 resistance zone remains possible. A sustained move above this resistance would confirm trend continuation and open the path for further upside in the short term.
On the flip side, if Nifty fails to hold this support zone and breaks decisively below it, the structure will weaken significantly. Such a breakdown would invalidate the higher-low formation and could trigger a sharper corrective move toward the 25,700–25,600 area, as indicated by the projected downside path. This would signal a shift from trend continuation to a deeper pullback or short-term trend reversal.
Overall, Nifty is at a point where patience is crucial. Directional clarity will emerge only after price either holds and bounces from the current support or breaks down convincingly below it. Traders should avoid anticipation and wait for confirmation, as this zone is likely to decide the next meaningful intraday move.

#NIFTY Intraday Support and Resistance Levels - 08/01/2026A flat opening is expected in Nifty 50, with the index continuing to trade within the same broader range seen over the last few sessions. Price is currently hovering around the 26,150 zone, which is acting as a short-term balance area after the recent pullback. This indicates that the market is still consolidating, and traders should wait for confirmation before taking aggressive directional trades.
On the upside, a sustained move above 26,250 will be the key bullish trigger. If Nifty manages to hold above this level, long positions can be considered with upside targets at 26,350, 26,400, and 26,450+. A clean breakout above this resistance may lead to renewed buying interest and continuation of the broader uptrend.
On the downside, if the index faces rejection near 26,200–26,180 and slips below this zone, a reversal short setup may come into play. In such a scenario, downside targets would be 26,150, 26,100, and 26,050-, where strong demand and support are expected. Until a clear breakout or breakdown occurs, traders should focus on range-based trading, maintain strict stop losses, and avoid over-leveraging in a sideways market.

[INTRADAY] #BANKNIFTY PE & CE Levels(08/01/2026)A flat opening is expected in Bank Nifty, with price action continuing to respect the same range and structure observed in the previous session. The index is currently trading around the 60,000–60,050 zone, which is acting as a short-term equilibrium area where buying and selling pressure remain balanced. As there are no major changes in key levels, the market sentiment stays neutral, indicating consolidation rather than a trending move.
On the upside, a sustained move above 60,050–60,100 will be the key trigger for bullish momentum. If Bank Nifty holds above this zone, long/CE positions can be considered with upside targets at 60,250, 60,350, and 60,450+. A decisive breakout above this resistance may attract fresh buying and extend the upside.
On the downside, if the index fails to hold 59,950–59,900, selling pressure may increase. In such a scenario, short/PE positions can be considered with downside targets at 59,750, 59,650, and 59,550-, where strong support is expected. Until a clear breakout or breakdown occurs, traders should continue to focus on range-bound trades, keep strict stop losses, and avoid aggressive directional positions.

DMART - Descending Channel💹 Avenue Supermarts Ltd (NSE: DMART)
Sector: Retail | CMP: 3841.6
View: Reaction from Higher-Timeframe Demand | Early Momentum Recovery
Chart Pattern: Descending Channel (Corrective)
Candlestick Pattern: Strong Bullish Marubozu
________________________________________
Price Action
DMART has spent the last few months in a controlled corrective decline after a prior uptrend, respecting a well-defined descending channel marked by lower highs. Price recently reacted sharply from a higher-timeframe demand base in the 3600 region, printing a decisive bullish expansion candle and closing near the session high. This move signals a shift from passive correction to active demand emergence, with sellers losing near-term control at lower levels. While the broader structure is still recovering and overhead resistance remains intact, the latest price behaviour reflects an early change in character rather than a weak bounce.
________________________________________
Technical Analysis (Chart Readings)
Technically, the chart shows improving alignment after prolonged consolidation. The bullish Marubozu indicates strong buyer dominance with minimal intraday supply. This expansion follows a compression phase, suggesting a short-term volatility release. Momentum indicators remain constructive but not euphoric — RSI around 51 reflects healthy recovery without exhaustion, while price reclaiming short-term averages points to stabilisation above demand. Volume participation is meaningfully above recent averages, confirming that the move is supported by participation rather than thin liquidity. Overall, the technical setup reflects a recovery phase with improving momentum but still within a broader corrective framework.
________________________________________
Key Levels (Chart Readings)
On the downside, a strong structural support zone lies in the 3600–3500 region, which has repeatedly absorbed selling pressure and now acts as the primary downside reference. Intermediate supports around 3719 and 3596 provide near-term cushions during pullbacks. On the upside, immediate resistance is visible near 3907–3972, followed by stronger overhead supply near 4095 and above, where prior distribution has occurred. Price is currently positioned between demand and resistance, making acceptance above these levels critical for sustained upside continuation.
________________________________________
Demand & Supply Zones (Chart Readings)
The demand–supply framework offers clear structure across timeframes. On the Daily timeframe, a major demand zone is established between 3680–3605, forming the broader base for the current recovery attempt, while a higher-timeframe supply zone remains active near 4111–4222. On the Swing timeframe, demand is concentrated around 3680–3605, with swing supply visible near 4173–4222. Intraday demand zones are clustered near 3769–3747 and 3743–3720, highlighting immediate buying interest, while short-term supply remains active near 3668–3658 on pullbacks. These zones frame the current recovery phase, with price rotating upward from demand into nearby supply.
________________________________________
STWP Trade Analysis
DMART has initiated a momentum recovery from a higher-timeframe demand base, supported by rising volume and improving price stability. From an intraday perspective, holding above the 3800–3850 zone keeps the bullish bias intact and allows scope for continuation toward upper resistance levels if participation sustains. From a short-term swing (hybrid) standpoint, the same structure supports a broader mean-expansion framework over the next few sessions, provided price does not slip back into the prior demand range. While the trend bias is turning upward, the presence of overhead supply and elevated volatility warrants disciplined execution, controlled position sizing, and strict respect for structural invalidation levels.
________________________________________
Final Outlook
Momentum: Strong
Trend: Up
Risk: High
Volume: High
The structure favours further recovery as long as price sustains above demand zones, but confirmation through acceptance above overhead supply is essential for trend acceleration. This phase rewards structure awareness, patience, and risk discipline over prediction.

TATAELXSI - Descending Triangle💹 Tata Elxsi Ltd (NSE: TATAELXSI)
Sector: IT Services | CMP: 5853
View: Compression Breakout from Higher-Timeframe Demand | Momentum Ignition Phase
Chart Pattern: Descending Triangle
Candlestick Pattern: Strong Bullish Marubozu | Bullish Engulfing
Price Action
TATAELXSI had been trading under sustained selling pressure within a descending structure, characterised by lower highs capped by a falling trendline. This corrective phase gradually transitioned into price compression as volatility narrowed near a well-established higher-timeframe demand base. The recent session marked a clear behavioural shift, with price expanding decisively from the lower boundary of the structure and closing firmly above the immediate resistance band. This move reflects a transition from passive absorption to active demand, indicating that sellers have lost short-term control and buyers are beginning to assert dominance. While the stock is still navigating overhead supply zones, the latest price action signals an early-stage trend revival rather than a mere technical bounce.
Technical Analysis (Chart Readings)
From a technical standpoint, the chart shows a strong momentum inflection supported by volatility expansion and participation. The emergence of a wide-range bullish Marubozu / engulfing candle highlights aggressive buying with minimal intraday supply. This expansion follows a prolonged compression phase, confirming a volatility regime shift. Short-term trend structure has improved meaningfully, with price reclaiming key moving averages and stabilising above VWAP, suggesting acceptance at higher levels. Momentum indicators reinforce this shift: RSI near 72.5 reflects strong upside momentum entering an extended zone, MACD remains firmly positive with acceleration visible, and ROC confirms a sharp improvement in rate-of-change. Volume expansion is exceptional, with participation far exceeding recent averages, indicating institutional involvement rather than a thin, speculative move. Overall, the technical state reflects strength, but also elevated volatility risk.
Key Levels (Chart Readings):
The downside structure is anchored by a strong support base in the 4900–5100 region, which has repeatedly absorbed supply and acted as the foundation for accumulation. Intermediate supports near 5485, 5117, and 4898 provide layered downside reference points. On the upside, immediate resistance is visible around 6072, followed by stronger overhead supply near 6291 and 6659, where prior selling pressure and distribution were observed. The recent breakout attempt from the lower range toward these resistance zones places price in a transition area, where acceptance above supply will be critical for sustained trend continuation.
Demand & Supply Zones (Chart Readings)
The demand–supply framework across timeframes offers clear structural guidance. On the Daily timeframe, a primary demand zone is established between 5398–5292.50, forming the broader base for the current move, while a higher-timeframe supply zone is visible between 6651.50–6735. On the Swing timeframe, demand is concentrated near 5360.50–5309.50, supporting higher-low formation, with swing supply zones located around 5941.50–6014 and 6167–6259.50. From an Intraday perspective, immediate demand is observed near 5352–5336, while short-term supply remains active around 5936–5972 and 6017–6055.50. These zones collectively frame the current price environment, with price rotating upward from demand into overhead supply.
STWP Trade Analysis
TATAELXSI has triggered a sharp momentum expansion from an accumulation base, supported by exceptional volume and improving trend alignment. Holding above the 5850 zone keeps the near-term structure constructive and allows scope for continuation toward higher resistance levels if momentum sustains, while the same structure supports a broader mean-expansion framework on a short-term swing basis as long as price does not slip back into the prior range. The chart also highlights a clear STWP HNI participation zone between 5853–5923 with structural invalidation below 5777, alongside a low-risk entry area near 5733 with invalidation below 5628, where downside risk remains structurally defined. While the broader bias remains constructive, elevated volatility and overbought momentum conditions demand disciplined execution, prudent position sizing, and strict respect for structural levels.
Final Outlook
Momentum: Strong
Trend: Up
Risk: High
Volume: High
The structure favours continuation as long as price sustains above demand zones, but confirmation through acceptance above overhead supply is essential for trend acceleration. This phase rewards structure awareness and risk discipline over prediction.
⚠️ STWP Educational & Legal Disclaimer
This content is shared strictly for educational and informational purposes only. All discussions, illustrations, charts, price zones, and options structures are meant to explain market behaviour and do not constitute any buy, sell, or hold recommendation. STWP does not provide investment advice, trading calls, tips, or personalized financial guidance, and is not a SEBI-registered intermediary or research analyst.
The analysis is based on publicly available market data and observed price–derivatives behaviour, which is dynamic in nature and may change without notice. Financial markets involve inherent risk, and derivatives carry elevated risk, including the potential for significant capital loss. Factors such as option premiums, implied volatility, open interest, delta, and other Greeks can shift rapidly and unpredictably.
All trading and investment decisions, including position sizing and risk management, are solely the responsibility of the reader. Always consult a SEBI-registered investment advisor before taking any financial action. STWP, its associates, or affiliates shall not be liable for any direct or indirect loss arising from the use of this material. Past patterns, structures, or historical behaviour must never be treated as guarantees of future outcomes.
Position Status: No active position in this instrument at the time of analysis
Data Source: TradingView & NSE India
💬 Did this add value?
🔼 Boost to support structured learning
✍️ Share your views or questions in the comments
🔁 Forward to traders who value disciplined analysis
👉 Follow for clean, probability-driven STWP insights
🚀 Stay Calm. Stay Clean. Trade With Patience.
Trade Smart | Learn Zones | Be Self-Reliant 📊

Thangamayil Jewellery Triangle Breakout in Daily TFThangamayil has confirmed a triangle breakout on the daily timeframe, indicating a shift from consolidation to expansion.
🔹 Breakout Level: 3,779
🔹 Upside Target / Next Supply Zone: 4,107
🔹 Key Support (Demand Zone): 3,140
The stock spent multiple sessions compressing within a Ascending triangle, forming higher lows — a classic sign of accumulation.
The breakout came with improved participation, suggesting buyers are gaining control.
As long as price sustains above the breakout zone, the structure remains bullish, and pullbacks may be viewed as retests rather than reversals.
A close back inside the pattern would weaken the breakout setup.
Company Overview
Thangamayil Jewellery Ltd is a well-known South India–focused jewellery retailer, primarily operating in Tamil Nadu.
The company specializes in gold, diamond, and silver jewellery, catering largely to wedding and festive demand.
With a strong regional brand presence and expansion into new stores, Thangamayil benefits from:
Consistent rural & semi-urban demand
High brand trust in South India
Seasonal tailwinds during festivals and marriage seasons
For analysis of any stock, feel free to comment the stock name below.
This analysis is for educational and informational purposes only. It does not constitute investment advice or a recommendation to buy or sell any security. Market investments are subject to risk, and past performance does not guarantee future results. Please consult a SEBI-registered financial advisor before making any investment decisions. The author is not responsible for any losses or gains arising from the use of this information.

XAUUSD (Gold) | Technical Outlook | 7th Jan'2026Gold (XAU/USD) is trading near 4,465, witnessing a healthy pullback after testing the 4,500 resistance zone. Despite short-term consolidation, the overall trend remains strongly bullish across Daily, Weekly, and Monthly timeframes. Price continues to hold above key moving averages, indicating buyers are still in control.
Key Levels
Resistance: 4,500 – 4,525 – 4,550
Support: 4,450 – 4,415 – 4,380
Bullish Scenario:
Holding above 4,450 keeps the upside open toward 4,500+. A breakout above 4,505 may accelerate buying momentum.
Bearish Scenario:
A sustained break below 4,440 could trigger a corrective move toward 4,415–4,380, while the broader trend remains bullish above 4,360.
Intraday Strategy:
✔ Buy on dips near 4,450–4,435
✔ Buy breakout above 4,505
✔ Sell only below 4,440 (short-term)
Macro Triggers to Watch:
• US Dollar Index & Bond Yields
• Inflation data (CPI/PPI)
• Fed speeches & FOMC signals
• Geopolitical developments
⚠️ Disclaimer:
This analysis is for educational purposes only. Gold trading involves risk. Always use proper risk management and consult your financial advisor before taking trades.

BTCUSDT Perpetual – Short Idea (FVG + Supply Rejection)BTC price faced rejection from a higher timeframe resistance zone and left a visible Fair Value Gap (FVG) above. Current structure shows consolidation below supply, increasing the probability of a downside continuation if the zone holds.
Trade Plan
🔻 Short Entry Zone: 93,300 – 93,500
🛑 Stop Loss: 94,000 (above resistance)
🎯 Targets:
• TP1: 92,400
• TP2: 90,500,
Confluence
HTF resistance rejection
FVG acting as supply
Weak follow-through after bounce
Range low liquidity resting below
📌 Risk Management :
Wait for confirmation on lower timeframe. Invalidation only above the marked supply.
⚠️ Not financial advice. Trade responsibly.

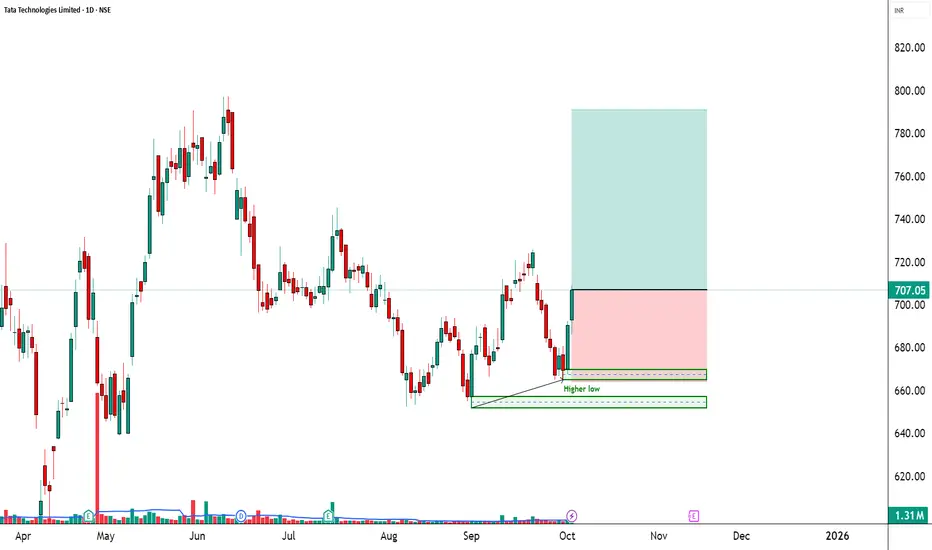
Tata Technologies | EMA50 Breakout + RSI Momentum________________________________________
🚀 Tata Technologies | EMA50 Breakout + RSI Momentum
🔹 Entry Zone: ₹707.05
🔹 Stop Loss: ₹664.20 – ₹664.25 (Risk ~42 pts)
🔹 Supports: 692.47 / 677.88 / 669.62
🔹 Resistances: 715.32 / 723.58 / 738.17
________________________________________
🔑 Key Highlights
✅ Volume Breakout → 1.31M vs avg 1.08M (Smart buying visible)
✅ EMA50 Breakout → trend shift signal
✅ RSI Breakout → momentum favoring bulls
✅ Bollinger Squeeze-Off → volatility expansion expected
________________________________________
🎯 STWP Trade View
📊 Structure shows bullish momentum building. If ₹715.32 is crossed, upside can stretch towards ₹723–738.
⚠️ Supports at ₹692 & ₹678 are crucial for maintaining this momentum.
________________________________________
💡 Learning Note
This setup is a classic example where EMA + RSI + Volume breakout alignment confirms the probability of a short-term bullish rally.
________________________________________
⚠️ Disclosure & Disclaimer – Please Read Carefully
The information shared here is meant purely for learning and awareness. It is not a buy or sell recommendation and should not be taken as investment advice. I am not a SEBI-registered investment adviser, and all views expressed are based on personal study, chart patterns, and publicly available market data.
Trading—whether in stocks or options—carries risk. Markets can move unexpectedly, and losses can sometimes exceed the money you have invested. Past performance or past setups do not guarantee future results.
If you are a beginner, treat this as a guide to understand how the market works and practice on paper trades before risking real money. If you are experienced, always assess your own risk, position sizing, and strategy suitability before entering trades.
Consult a SEBI-registered financial adviser before making any real trading decision. By engaging with this content, you acknowledge full responsibility for your trades and investments.
💬 Found this useful?
🔼 Give this post a Boost to help more traders discover clean, structured learning.
✍️ Drop your thoughts, questions, or setups in the comments — let’s grow together!
🔁 Share with fellow traders and beginners to spread awareness.
👉 “If you liked this breakdown, follow for more clean, structured setups with discipline at the core.”
🚀 Stay Calm. Stay Clean. Trade With Patience.
Trade Smart | Learn Zones | Be Self-Reliant 📊
Northern Arc Capital | Daily Chart | Consolidation Price is consolidating between ₹250–270 after a strong recovery, indicating absorption near resistance rather than weakness.
🔹 Resistance: ₹270–275
🔹 Support: ₹250–255
🔹 Structure: Falling channel / flag after upmove
🔹 EMA Zone: Price holding near EMAs → volatility compression
👉 Sustained breakout above ₹275 with volume can trigger the next leg towards ₹300+.
👉 Breakdown below ₹245 will weaken the bullish structure.

#NIFTY Intraday Support and Resistance Levels - 07/01/2026A flat opening is expected in Nifty 50, with the index continuing to trade within the same price structure seen in the previous session. The market is hovering around the 26,170–26,200 zone, which is acting as an immediate balance area where buyers and sellers are evenly placed. Since there are no major changes in yesterday’s key levels, the overall tone remains range-bound, and the index is waiting for a clear directional trigger.
On the upside, a sustained move above 26,250 will be crucial to revive bullish momentum. If Nifty holds above this level, long positions can be considered with upside targets at 26,350, 26,400, and 26,450+. A clean breakout above this resistance may lead to follow-through buying and expansion of the current range.
On the downside, failure to hold 26,200 can increase selling pressure. A decisive break below this level may open the downside toward 26,150, 26,100, and 26,000, where strong support is placed. Until the index breaks out of this range, traders should focus on range-based setups, avoid over-leveraging, and strictly follow risk management in intraday trades.

[INTRADAY] #BANKNIFTY PE & CE Levels(07/01/2026)Bank Nifty is expected to open flat, continuing to trade within a well-defined consolidation range after recent volatility. The index is currently hovering near the 60,050–60,120 zone, which is acting as a short-term equilibrium area. As long as price holds above 60,050, the bias remains mildly positive, and a sustained move above 60,050–60,100 can trigger fresh upside momentum toward 60,250, 60,350, and 60,450+. On the downside, 59,950–60,000 remains a critical support zone; any decisive breakdown below this level may invite selling pressure, opening the path for 59,750, 59,650, and 59,550. Until a clear breakout or breakdown occurs, traders should expect range-bound movement, focus on level-based entries, and maintain strict risk management in intraday trades.

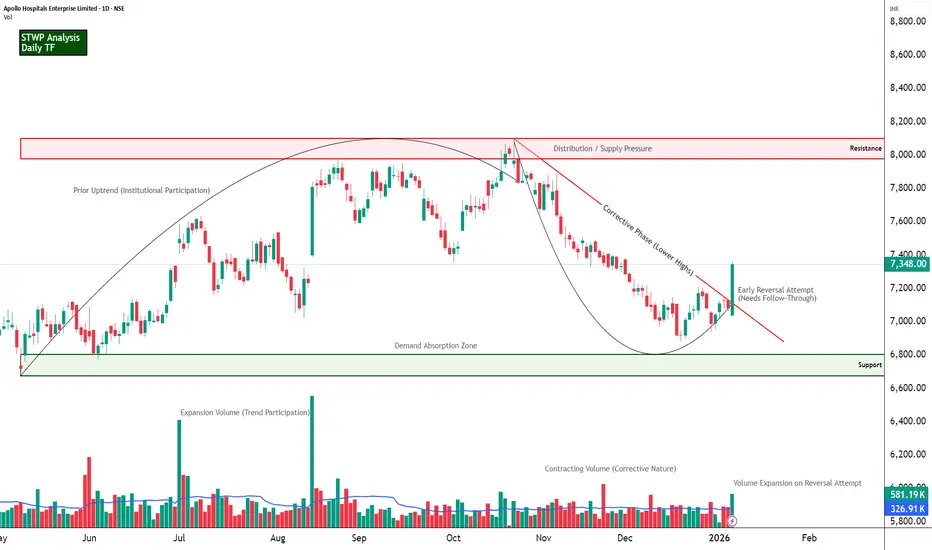
APOLLOHOSP - Range-to-Reversal Attempt from Demand Zone💹 Apollo Hospitals Enterprise Ltd (NSE: APOLLOHOSP)
Sector: Healthcare | CMP: 7348
View: Range-to-Reversal Attempt from Demand Zone | Early Momentum Rebuild
Chart Pattern: Accumulation
Candlestick Pattern: Strong Bullish Marubozu | Bullish Engulfing
Price Action:
APOLLOHOSP has been in a corrective phase after a prior uptrend, trading within a descending structure marked by a clear trendline connecting lower highs. Price recently reacted strongly from a long-term support zone near the lower boundary of the range, forming a decisive bullish candle that signals demand absorption at lower levels. While the broader structure still carries corrective characteristics, the recent move reflects an early attempt at reversal and mean reversion, with price pushing back toward the mid-range as it approaches the declining supply line and overhead resistance zone.
Technical Analysis (Chart Readings):
The chart reflects a high-confluence bullish technical state where multiple indicators are aligning simultaneously. Price has printed a strong bullish Marubozu / engulfing candle, indicating clear buyer dominance with minimal intraday supply, and this move is accompanied by Bollinger Band expansion following a squeeze, pointing to a volatility release after a consolidation phase. Trend alignment is visible through the upward crossover of EMA 9–20 and price holding above the EMA 200, further supported by bullish SuperTrend and VWAP structure, suggesting acceptance of higher price levels. Momentum indicators reinforce this shift, with RSI at 60.52 signalling a breakout into strength territory, MACD remaining positive with an expanding histogram, ADX near 29.87 reflecting a strengthening trend environment, and ROC at 4.17 percent confirming positive rate-of-change momentum. Volume readings show active participation, with current volumes meaningfully above average, highlighting conviction behind the move rather than a low-liquidity spike. Relative strength versus NIFTY at 4.14 percent indicates short-term outperformance, while the mid-range 52-week positioning suggests the move is occurring within structure rather than at an extreme, together portraying a synchronized alignment of price, trend, momentum, volatility, and volume consistent with a developing directional expansion phase.
Key Levels (Chart Readings):
The chart highlights a well-defined demand–supply structure shaping price behaviour. On the downside, a strong demand zone is visible in the 6900–6800 region, from where price has repeatedly found support, indicating sustained buying interest and accumulation at lower levels. This zone is further reinforced by clearly marked support levels around 7138.67, 6929.33, and 6818.67, establishing a layered support base rather than a single-point level. On the upside, price has previously reacted sharply from the overhead resistance band near the 7800–8000 zone, marked as a possible supply area, suggesting distribution and selling pressure at higher levels. Intermediate resistance levels around 7458.67, 7569.33, and 7778.67 indicate zones where price has struggled to sustain upward momentum in the past. The recent bounce from the demand zone back toward the mid-range reflects a range-to-reversion move within structure, while the overhead resistance is still relatively weak but present, implying that acceptance above these zones would be required for sustained upside. Overall, the chart reads as a market transitioning from demand-led support toward a test of overhead supply, with price currently navigating between clearly defined structural boundaries rather than moving in an uncharted zone.
Demand & Supply Zones (Chart Readings)
The chart outlines a clearly defined demand–supply structure guiding near-term price behaviour. A possible swing demand zone is observed between 7091.50–7072.50, where price has previously attracted sustained buying interest, establishing a structural base within the broader range. Nested within this area, a possible intraday demand zone around 7091.50–7077.50 highlights immediate short-term demand, indicating active participation at these levels. On the upside, possible intraday supply zones are identified near 7282.00–7294.50 and 7321.00–7331.50, where prior price reactions suggest the presence of supply and potential short-term resistance. Collectively, these zones frame the current price environment, with price positioned between nearby demand and overhead supply, making them important reference areas for observing future price reactions.
STWP Trade Analysis:
APOLLOHOSP has triggered a decisive bullish expansion, marked by a wide-range green candle supported by high volume, indicating strong demand emergence after a prolonged corrective phase. From an intraday perspective, the stock holds a bullish bias above the 7360 zone, with the structure allowing for momentum continuation toward 7986.88 and 8404.8, while risk remains defined below 6837.6, making this setup suitable only for traders comfortable with volatility. From a swing (hybrid) standpoint, the same entry zone supports a broader mean-expansion framework over the next few sessions, where sustained participation can open upside potential toward 8927.2 and 10102.6, with structural invalidation placed near 6576.4. The STWP view remains constructively bullish, with the trend aligned upward, RSI at 60.52 reflecting healthy strength without exhaustion, and volume expansion (Vol X 2.01) confirming conviction behind the move. The learning takeaway from this setup is to prioritise structure, controlled risk per trade, and post-trade review over prediction, especially during high-momentum phases.
Final outlook remains positive with strong momentum and an upward trend, while risk is elevated due to volatility, making disciplined execution and risk management critical as long as volume support sustains.
⚠️ STWP Educational & Legal Disclaimer
This content is shared strictly for educational and informational purposes only. All discussions, illustrations, charts, price zones, and options structures are meant to explain market behaviour and do not constitute any buy, sell, or hold recommendation. STWP does not provide investment advice, trading calls, tips, or personalized financial guidance, and is not a SEBI-registered intermediary or research analyst.
The analysis is based on publicly available market data and observed price–derivatives behaviour, which is dynamic in nature and may change without notice. Financial markets involve inherent risk, and derivatives carry elevated risk, including the potential for significant capital loss. Factors such as option premiums, implied volatility, open interest, delta, and other Greeks can shift rapidly and unpredictably.
All trading and investment decisions, including position sizing and risk management, are solely the responsibility of the reader. Always consult a SEBI-registered investment advisor before taking any financial action. STWP, its associates, or affiliates shall not be liable for any direct or indirect loss arising from the use of this material. Past patterns, structures, or historical behaviour must never be treated as guarantees of future outcomes.
Position Status: No active position in this instrument at the time of analysis
Data Source: TradingView & NSE India
💬 Did this add value?
🔼 Boost to support structured learning
✍️ Share your views or questions in the comments
🔁 Forward to traders who value disciplined analysis
👉 Follow for clean, probability-driven STWP insights
🚀 Stay Calm. Stay Clean. Trade With Patience.
Trade Smart | Learn Zones | Be Self-Reliant 📊
MarketViewLab | XAUUSD Breakout RetestMarketViewLab | XAUUSD Breakout Retest
XAUUSD (Gold) – 2H Chart Analysis
Structure: Consolidation breakout in progress
Market Bias: Bullish – monitoring continuation potential
Key Levels
• Support Zone: 4,390–4,410
• Resistance Zone: 4,560–4,700
Chart Context:
Price recently broke above a consolidation range after multiple tests of support.
The breakout shows improving momentum with higher lows forming.
Technical View:
• Break above range suggests strength returning to buyers.
• Retest toward 4,430–4,450 could act as a potential support zone.
• Continuation toward 4,560–4,700 remains possible if momentum holds.
(This analysis is for educational purposes only and does not constitute financial advice.)

XAUUSD (Gold) TECHNICAL OUTLOOK | 6th Jan'2026Gold is trading near 4,450, consolidating after a strong bullish rally. Price remains well above key moving averages, keeping the overall trend firmly bullish across intraday to higher timeframes.
Bullish View:
As long as gold holds above 4,445–4,450, upside momentum remains intact. A move above 4,470 can push prices toward 4,490 and 4,505–4,515, with 4,550 as a major resistance zone.
Bearish View:
A break below 4,445 may trigger a short-term pullback toward 4,430 and 4,410–4,395. Unless these levels break decisively, dips are likely corrective.
Intraday Focus:
Prefer buy-on-dips near support, while watching 4,500–4,515 for possible rejection.
Conclusion:
Trend remains strongly bullish. Expect volatility, but bias favors buyers unless key supports fail.

XAUUSD (H2) – Buying priority todayGold holds above 4,400 on safe-haven flows | Trade liquidity, don’t chase
Quick summary
Gold started the week with strong momentum and pushed above 4,400 during the Asian session as global markets rotated into safe-haven assets. Geopolitical risk is the key driver after reports of US ground strikes in Venezuela and the detention of President Nicolás Maduro and his wife. With that backdrop, my plan today is simple: prioritize BUY setups at liquidity zones, and avoid FOMO while the price is elevated.
1) Macro context: Why gold is supported
When geopolitical risk escalates, capital typically flows into gold.
Headline-driven sessions often bring:
✅ fast pumps, ✅ liquidity sweeps, ✅ larger wicks/spreads.
➡️ The safest execution is waiting for pullbacks into predefined buy zones, not chasing highs.
2) Technical view (based on your chart)
On H2, gold has bounced sharply and your chart highlights clear execution areas:
Key levels for today
✅ Buy zone: 4340 – 4345 (trend/structure pullback zone)
✅ Strong Liquidity: lower support band (marked on chart)
✅ Sell zone: 4436 – 4440 (near-term supply / reaction area)
✅ Sell swing / target: 4515 – 4520 (higher objective / profit-taking zone)
3) Trading plan (Liam style: trade the level)
Scenario A (priority): BUY the pullback into 4340–4345
✅ Buy: 4340 – 4345
SL (guide): below the zone (adjust to spread / lower TF structure)
TP1: 4400 – 4410
TP2: 4436 – 4440
TP3: 4515 – 4520 (if momentum continues with headlines)
Logic: 4340–4345 offers a cleaner R:R than chasing above 4,400.
Scenario B: If the price holds above 4,400 and only dips lightly
Look for a buy only on clear holding signals near the closest support/strong liquidity (M15–H1).
Still not recommending FOMO entries in headline volatility.
Scenario C: SELL reaction (scalp) at supply
✅ If price tags 4436–4440 and shows weakness:
Sell scalp: 4436 – 4440
SL: above the zone
TP: back toward 4400–4380
Logic: This is a near-term supply area — good for quick profit-taking, not a long-term reversal call.
4) Notes (avoid getting swept)
The Asian session can spike hard on headlines → wait for pullback confirmations.
Reduce size if spreads widen.
Only execute when price hits the level and prints a clear reaction (rejection / engulf / MSS).
What’s your plan today: buying the 4340–4345 pullback, or waiting for price to push into 4515–4520 before reassessing?

Redington Ltd | Symmetrical Triangle – Breakout AwaitedRedington Ltd is a leading technology distribution and supply chain solutions company, operating across India, the Middle East, Africa, and South Asia. The company specializes in the distribution of IT products, mobility devices, cloud solutions, and emerging technologies, partnering with global brands to deliver end-to-end supply chain and value-added services. With a strong focus on digital transformation, scalability, and efficient logistics, Redington plays a crucial role in enabling technology adoption across multiple markets.
Redington Ltd is currently consolidating within a symmetrical triangle formation, indicating a phase of price contraction and equilibrium between buyers and sellers. The stock has been making lower highs and higher lows, reflecting reduced volatility and a potential build-up for a strong directional move. A decisive breakout with volume confirmation will be crucial to determine the next trend direction.

#NIFTY Intraday Support and Resistance Levels - 06/01/2026A flat to mildly cautious opening is expected in Nifty 50, with price currently trading near the 26,240–26,260 zone, which is acting as a short-term decision area. After the recent up-move, the index has paused near this zone, indicating profit booking and consolidation rather than fresh aggressive buying. This confirms that the market is waiting for a clear directional trigger before committing to the next move.
On the upside, a sustained move above 26,250 will be the key bullish trigger. If Nifty manages to hold above this level, long positions can be considered with upside targets at 26,350, 26,400, and 26,450+. A clean breakout and acceptance above 26,250–26,300 may invite follow-through buying and continuation of the broader bullish structure.
On the downside, if the index fails to sustain and breaks below 26,200, selling pressure may increase. In such a scenario, short trades can be planned with downside targets at 26,150, 26,100, and 26,000-, where strong support is expected to emerge. Until a decisive breakout or breakdown occurs, traders should remain disciplined, focus on level-based execution, and avoid aggressive trades during this consolidation phase.

[INTRADAY] #BANKNIFTY PE & CE Levels(06/01/2026)A flat opening is expected in Bank Nifty, with the index currently hovering around the 60,050–60,100 zone, which is acting as an important intraday balance area. Price action suggests that the market is in a consolidation phase after the recent sharp up-move, indicating temporary equilibrium between buyers and sellers. This zone will remain crucial for deciding the next directional move.
On the upside, if Bank Nifty sustains above 60,050–60,100, fresh bullish momentum can emerge. Holding above this support can trigger long positions, with upside targets placed at 60,250, 60,350, and 60,450+. A breakout above 60,450 would further strengthen the bullish structure and may lead to extended gains toward higher levels.
On the downside, if the index fails to hold 60,050 and slips below 59,950, selling pressure may increase. In such a case, short positions can be considered with downside targets at 59,750, 59,650, and 59,550-, where strong demand is expected. Until a clear breakout or breakdown occurs, traders should focus on level-based trades, keep strict stop losses, and avoid aggressive positions during consolidation.
