[INTRADAY] #BANKNIFTY PE & CE Levels(19/12/2025)A flat opening is expected in Bank Nifty, with the index continuing to trade within a tight consolidation range formed over the last few sessions. Price is currently hovering around the 58,900–59,000 zone, which is acting as a short-term balance area. This indicates hesitation in the market, where buyers and sellers are evenly placed, and a clear directional move is still awaited for conviction.
On the upside, a sustained move above 59,050–59,100 will be the key trigger for bullish momentum. If Bank Nifty manages to hold above this resistance zone, buying can be considered, with upside targets placed at 59,250, 59,350, and 59,450+. A decisive breakout above this level may invite follow-through buying and push the index toward higher resistance levels.
On the downside, if the index fails to hold the 58,950–58,900 support zone, selling pressure may accelerate. In such a scenario, selling can be considered with downside targets at 58,750, 58,650, and 58,550-, where strong demand is expected. Until a clear breakout or breakdown occurs, traders should continue to focus on range-based trading setups, keep strict stop-loss discipline, and avoid aggressive positional trades.
Technical Analysis

HDFCAMC - Demand Reclaim, Institutional Participation Visible💹 HDFC Asset Management Co. Ltd (NSE: HDFCAMC)
Sector: Financial Services – Asset Management | CMP: 2723
View: Bullish — Demand Reclaim, Institutional Participation Visible
HDFCAMC has staged a sharp recovery from its lower demand zone, supported by a strong bullish candle and clear volume expansion, signalling renewed buying interest rather than a dead-cat bounce. The recent move has helped the stock reclaim short-term positional levels after a corrective phase, indicating that supply pressure seen earlier has started to ease. Price behaviour now reflects acceptance above demand, which is a constructive sign for follow-through.
From a structural standpoint, the broader trend remains up, with the recent decline appearing corrective within a larger framework rather than trend-damaging. RSI near 57.5 sits in a healthy zone — comfortably above neutral but well below overbought territory — allowing room for continuation if momentum sustains. Stochastic has reset from elevated levels, while MACD behaviour points toward renewed bullish momentum instead of exhaustion. ADX suggests trend strength is improving, hinting at a possible transition from consolidation back into expansion.
Volume dynamics are a key positive. With Vol-X above 3, participation during the recent up-move reflects institutional involvement rather than retail-led volatility. The absence of panic selling during the prior decline and the presence of strong demand absorption increase the probability that the stock is resuming its primary trend rather than entering a prolonged range.
Key price references indicate immediate overhead resistance clustered around the 2765–2810 zone, with a higher supply band near 2890–3000 acting as a broader ceiling. On the downside, structural supports are placed near 2640, followed by 2558 and 2515, defining the current risk envelope. Sustained acceptance above the near-term resistance band would strengthen bullish confidence, while failure to hold above reclaimed levels could lead to range-bound consolidation.
Demand Reclaim, Institutional Participation Visible
On the derivatives side, near-ATM option activity is referenced strictly for analytical insight into positioning behaviour. CALL-side data shows long build-up with strong volume and open-interest expansion, reflecting directional participation aligned with price. PUT-side activity is largely defensive, with short-covering dominating rather than fresh aggressive bearish positioning. Implied volatility remains in a low-to-moderate band, favouring controlled directional structures over fear-driven trades. Overall, derivatives behaviour aligns with a continuation-biased environment, conditional on price follow-through.
Structure quality metrics reinforce this view. The STWP Edge Score remains high, indicating strong alignment between price action, volume, and options positioning. Liquidity is concentrated near the ATM zone, supporting efficient participation, though directional options remain sensitive to time decay if momentum stalls — reinforcing the need for disciplined risk management.
Overall, HDFCAMC appears to be resuming its primary uptrend after a corrective phase, with improving momentum and visible institutional participation. While overhead resistance may induce short-term pauses, the broader structure remains constructive as long as price holds above key demand levels.
Final Outlook (Educational Snapshot):
Momentum: Moderate| Trend: Developing | Risk: High | Volume: Very High
⚠️ STWP Legal Disclaimer
This document is strictly for educational and informational purposes. All examples, charts, levels, and option structures discussed are illustrative and are not intended as buy, sell, or hold recommendations. STWP does not provide investment advice, trading tips, signals, or personalized financial guidance of any kind, nor is it a SEBI-registered intermediary or research analyst. The analyses, illustrations, and risk–reward structures included here are generic in nature and based on publicly available data and observed market behaviour, which may change without notice. Financial markets involve significant risk; derivatives in particular carry the potential for substantial losses. Option premiums, implied volatility, open interest, delta, and other market variables can fluctuate rapidly and unpredictably.
Readers are solely responsible for their trading decisions, capital management, and risk assessment. Before making any investment or trading decision, please consult a SEBI-registered investment advisor. STWP, its representatives, and affiliates shall not be liable for any direct or indirect loss arising from the use of this material. Historical patterns or past market behaviour do not guarantee future outcomes, nor should any part of this document be interpreted as a promise of performance, accuracy, or returns.
Position Status: No active position in this instrument at the time of analysis.
Data Source: TradingView & NSE India.
💬 Found this useful?
🔼 Boost this post to support structured learning
✍️ Share your thoughts or questions in the comments
🔁 Forward this to traders who value clean technical studies
👉 Follow for disciplined, structured, STWP-style analysis
🚀 Stay Calm. Stay Clean. Trade With Patience.
Trade Smart | Learn Zones | Be Self-Reliant 📊

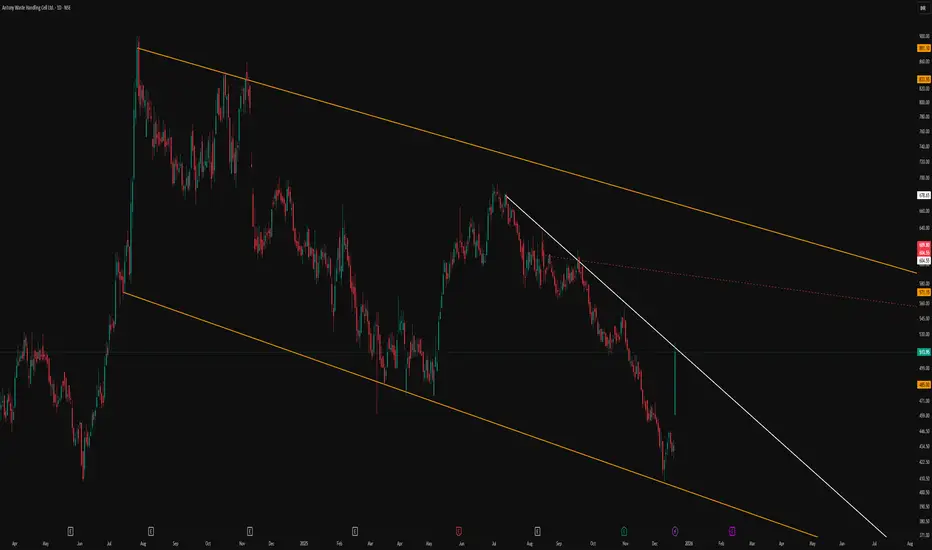
Classic Descending Channel With Clear Structural LevelsThe primary feature of this chart is the broad descending parallel channel marked by the orange lines, which frames the entire corrective phase in a neat, orderly manner. Price has repeatedly respected both the upper and lower boundaries, reinforcing the relevance of this channel as a dominant structure.
A trend‑changing resistance line is drawn in white, connecting swing highs and visually separating the prevailing downtrend from any potential shift in behavior. This line serves as a clear reference for how price has reacted to supply zones within the channel, without implying any future breakout or directional bias.
The red dotted line acts as an internal, hidden line derived from prior price interaction, helping to map out the internal rhythm of the move. Overall, the chart is intended purely as a structural illustration of how price respects channels and internal reference lines, without any forecast or trade signal.
XAUUSD (Gold) Technical Outlook - 18/12/2025📊 XAU/USD Quick Outlook
Gold is trading near 4,326, showing short-term weakness, but the overall trend is still bullish on higher timeframes.
🔑 Key Levels
• Support: 4,320 – 4,300
• Resistance: 4,335 – 4,345
🟢 Bullish: Above 4,320 → targets 4,345 → 4,370+
🔴 Bearish: Below 4,320 → targets 4,300 → 4,260
📌 Intraday Tip:
Sell near resistance, buy near support only after confirmation.
⚠️ Expect volatility during USD news.
⚠️ Disclaimer: This analysis is for educational purposes only. Markets are volatile—trade with proper risk management and at your own risk.

BANKNIFTY at a Make-or-Break ZoneNIFTYBANK is currently trading at a critical confluence zone where a downward-sloping resistance trendline is meeting a well-defined rising support area on the 1-hour timeframe. This price compression indicates indecision and typically precedes a sharp directional move. The index has repeatedly respected both these levels, confirming their importance in the current structure.
On the upside, the falling resistance zone near 59,300–59,500 remains the key hurdle. A sustained breakout and close above this trendline would signal a shift in short-term momentum, opening the door for a recovery move toward 59,800 initially, followed by a potential extension toward the 60,400–60,600 zone. Such a breakout would also indicate that buyers are regaining control after the recent corrective phase.
On the downside, the green support zone around 58,700–58,850 is the immediate demand area to watch. This zone has acted as a base multiple times, and as long as Bank Nifty holds above it, pullbacks may continue to attract buyers. However, a decisive breakdown below this support would invalidate the bullish bounce scenario and could accelerate selling pressure toward 58,300 first, with a deeper downside extension possible toward the 57,200 region.
Overall, BANKNIFTY is trading inside a tightening range, signaling an imminent volatility expansion. Directional clarity will emerge only after a confirmed breakout or breakdown. Traders should remain cautious at current levels and wait for confirmation, as this is a classic decision zone where false moves are also common.

#NIFTY Intraday Support and Resistance Levels - 18/12/2025A flat opening is expected in Nifty 50, with the index continuing to trade inside a well-defined consolidation range formed over the last few sessions. Price is currently hovering near the 25,800–25,850 zone, which is acting as a short-term balance area. This indicates that the market remains range-bound, with traders waiting for a decisive breakout or breakdown before committing to a strong directional move.
On the upside, a sustained move above 26,050 will be the key trigger for fresh bullish momentum. If Nifty manages to hold above this resistance level, long positions can be considered, with upside targets placed at 26,150, 26,200, and 26,250+. Additionally, a reversal long trade can be considered near the 25,750–25,800 support zone, provided price shows stability, targeting 25,850, 25,900, and 25,950+.
On the downside, if the index faces rejection near 25,950–25,900, selling pressure may emerge. In such a case, short positions can be initiated with downside targets at 25,850, 25,800, and 25,750-. A stronger bearish continuation will be confirmed if Nifty breaks below 25,700, which may open further downside toward 25,650, 25,550, and 25,500-. Until a clear directional breakout occurs, traders are advised to trade within the range, maintain strict risk management, and avoid over-leveraging.

[INTRADAY] #BANKNIFTY PE & CE Levels(18/12/2025)A flat opening is expected in Bank Nifty, with the index continuing to trade within a defined consolidation range seen over the last few sessions. Price is hovering near the 58,950–59,000 zone, which is acting as an important short-term balance area. This indicates indecision in the market, where both buyers and sellers are waiting for a clear directional trigger before committing aggressively.
On the upside, a sustained move above 59,050–59,100 will be crucial to revive bullish momentum. If Bank Nifty manages to hold above this resistance zone, buying positions can be considered. In such a scenario, the upside targets are placed at 59,250, 59,350, and 59,450+. A clean breakout above this level may attract fresh buying and push the index toward the upper resistance band near 59,450.
On the downside, if the index fails to hold the 58,950–58,900 support zone, selling pressure may intensify. A breakdown below this area opens up opportunities to selling, with downside targets at 58,750, 58,650, and 58,550-, where strong support is expected. Until a decisive breakout or breakdown occurs, traders are advised to stick to range-bound strategies, maintain strict stop-loss discipline, and avoid aggressive directional trades.

Nifty50 at a Crucial Inflection Zone:Break Will Decide DirectionNifty 50 is currently trading near a well-defined horizontal support zone around 25,750–25,800, which has acted as a demand area multiple times on the 2-hour timeframe. After facing repeated rejection from the falling trendline resistance, the index has moved back into this support cluster, making the current zone extremely important from a short-term perspective.
The broader structure shows a sequence of lower highs, with price respecting the descending trendline marked as resistance. Until this trendline is decisively broken, upside moves may face supply pressure near the 25,950–26,000 region. A clean breakout and sustained close above this resistance would signal a shift in momentum and can trigger a pullback-to-breakout move toward 26,200–26,300 in the next leg.
On the downside, the support zone remains the key line of defense for bulls. If Nifty fails to hold the 25,750 area and breaks below it with conviction, the structure opens up for a deeper retracement toward 25,500 initially, followed by the broader downside target near 25,300. This would confirm continuation of the short-term corrective phase.
Overall, Nifty is currently in a compression phase between falling resistance and horizontal support. A breakout on either side will define the next directional move. Traders should remain patient and let price confirm the bias, as this is a classic “decision zone” where volatility expansion is likely once the range resolves.

HEROMOTOCO - Rejection From Strong Resistance, Momentum Cooling💹 Hero MotoCorp Ltd (NSE: HEROMOTOCO)
Sector: Automobiles | CMP: 5817
View: Bearish — Rejection From Strong Resistance, Momentum Cooling
HEROMOTOCO has recently faced a sharp rejection from its upper resistance zone near the 6100–6200 region after a strong prior rally, indicating supply emergence at higher levels rather than healthy consolidation. The subsequent decline has been decisive, with price slipping back below key short-term levels, suggesting that the recent upswing may have been a momentum-driven leg rather than the start of a sustained trend. Current price behaviour reflects a cooling phase following distribution near the highs.
From a structural perspective, the stock remains within a broader developing framework, but near-term momentum has weakened. RSI around 42.6 sits in a neutral-to-healthy zone, indicating that the stock is neither oversold nor displaying reversal exhaustion. Stochastic has cooled from elevated levels, while MACD signals point to loss of bullish momentum rather than aggressive bearish acceleration. ADX suggests the trend is still developing, though recent behaviour highlights a transition from expansion to consolidation or pullback.
Volume participation remains moderate (Vol-X ~0.83), confirming that the recent decline is orderly and controlled, not panic-driven. This reduces the probability of sharp capitulation but keeps downside risk open as long as price fails to reclaim overhead supply. The current structure favours patience, with markets reassessing value after a strong prior move.
Key price references show strong overhead resistance clustered near 5931–6045 and further up around 6120, while immediate structural supports are placed near 5742, followed by 5668 and 5553, defining the current risk-reward envelope. Sustained acceptance above the resistance band would be required to restore bullish confidence, while continued trade below this zone keeps the bias tilted to the downside or range-bound with elevated volatility.
On the derivatives side, near-ATM CALLs and PUTs are referenced strictly for analytical insight into positioning behaviour. CALL-side data shows rising open interest with moderate volume expansion, indicating short build-up rather than directional strength, while PUT-side activity reflects short-covering-led participation, suggesting defensive repositioning rather than fresh aggressive bearish bets. Implied volatility remains in a relatively low-to-moderate band, pointing to measured risk pricing rather than fear-driven expansion. Overall, derivatives behaviour aligns with a cooling, non-trending phase, where conviction remains mixed and momentum-dependent.
Structure quality metrics reflect this balance. The STWP Edge Score in the moderate range highlights tradability but not high-conviction trend alignment. Liquidity remains concentrated near ATM strikes, supporting participation, but directional option structures remain sensitive to time decay and price stalling, reinforcing the importance of confirmation through price acceptance or rejection at key levels.
Overall, HEROMOTOCO is currently in a post-rally digestion phase, with bearish pressure emerging near resistance and momentum moderating. While deeper downside is possible if supports fail, the absence of capitulation volume suggests that the stock may oscillate within a defined range unless fresh directional conviction develops.
Final Outlook (Educational Snapshot):
Momentum: Neutral| Trend: Developing / Cooling | Risk: Low | Volume: Normal
⚠️ STWP Legal Disclaimer
This document is strictly for educational and informational purposes. All examples, charts, levels, and option structures discussed are illustrative and are not intended as buy, sell, or hold recommendations. STWP does not provide investment advice, trading tips, signals, or personalized financial guidance of any kind, nor is it a SEBI-registered intermediary or research analyst. The analyses, illustrations, and risk–reward structures included here are generic in nature and based on publicly available data and observed market behaviour, which may change without notice. Financial markets involve significant risk; derivatives in particular carry the potential for substantial losses. Option premiums, implied volatility, open interest, delta, and other market variables can fluctuate rapidly and unpredictably.
Readers are solely responsible for their trading decisions, capital management, and risk assessment. Before making any investment or trading decision, please consult a SEBI-registered investment advisor. STWP, its representatives, and affiliates shall not be liable for any direct or indirect loss arising from the use of this material. Historical patterns or past market behaviour do not guarantee future outcomes, nor should any part of this document be interpreted as a promise of performance, accuracy, or returns.
Position Status: No active position in this instrument at the time of analysis.
Data Source: TradingView & NSE India.
💬 Found this useful?
🔼 Boost this post to support structured learning
✍️ Share your thoughts or questions in the comments
🔁 Forward this to traders who value clean technical studies
👉 Follow for disciplined, structured, STWP-style analysis
🚀 Stay Calm. Stay Clean. Trade With Patience.
Trade Smart | Learn Zones | Be Self-Reliant 📊

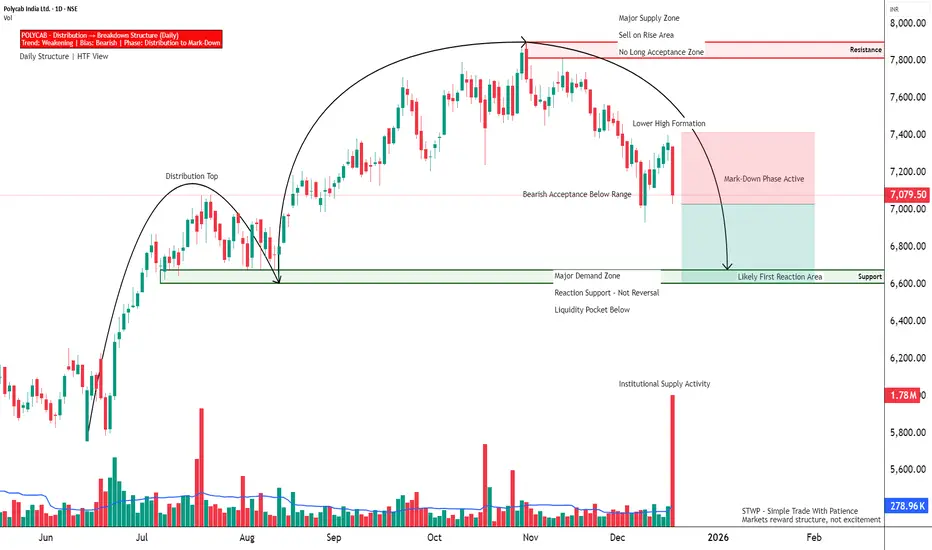
POLYCAB - Breakdown From Distribution Range💹 Polycab India Ltd (NSE: POLYCAB)
Sector: Electricals / Cables | CMP: 7079.5
View: Bearish — Breakdown From Distribution Range
POLYCAB has decisively slipped below its short-term consolidation zone, following a failed attempt to sustain above the 7600–7800 supply region. The rejection from this upper band was sharp and volume-backed, confirming distribution at higher levels rather than healthy consolidation. Recent candles show downside continuation with expanding volatility, keeping the immediate bias tilted to the downside.
Structurally, the stock has transitioned from an uptrend into a lower-high formation, with price now trading below key short-term averages. RSI around 38 reflects weak but not oversold momentum, indicating that downside pressure still has room to play out. MACD remains in bearish territory, while ADX suggests the trend is developing rather than exhausted. This combination favours continuation moves over mean-reversion bounces.
Volume behaviour is a key tell. The recent sell-off has come with very high participation (Vol-X ~9+), signalling active institutional repositioning rather than retail-driven noise. Importantly, selling has not yet shown capitulation characteristics, implying that weakness may persist until a stronger demand pocket is tested.
Key Support & Resistance Zones (Chart-Based)
Resistance Zones:
• 7270 (near-term supply / pullback cap)
• 7460.5 (intermediate resistance)
• 7580 (major overhead resistance, prior distribution zone)
• 7800–7900 (weak but broad HTF supply band)
Support Zones:
• 6960 (Support 1 – immediate reaction level)
• 6840.5 (Support 2 – intermediate demand)
• 6650 (Support 3 – major structural demand zone)
The 6960 level may offer a temporary pause or short-lived bounce, but it is not a trend-defining support. A sustained break below this zone increases downside probability toward 6840.5 and 6650, where stronger demand is likely to emerge. Any pullback toward 7270–7460 is expected to face supply unless accompanied by clear volume contraction and structural improvement.
From a broader risk perspective, POLYCAB is now in a sell-on-rise environment, with trend strength favouring bears and volatility elevated. Long exposure remains high-risk until price reclaims and sustains above the lower resistance band with improving momentum metrics.
Options activity shows increasing alignment with the mark-down structure. Near-ATM PUTs are referenced purely for positioning insight, with balanced-to-negative delta indicating sensitivity to further downside. Rising open interest alongside strong volume points to fresh bearish participation rather than short-covering, while implied volatility remains in a controlled mid-range, suggesting measured risk pricing.
Derivatives participation broadly confirms the cash-market breakdown, with liquidity concentrated near ATM levels and behaviour consistent with informed repositioning. Directional structures remain sensitive to time decay and consolidation, making continued downside acceptance and momentum follow-through essential for validation.
Final Outlook (Educational Snapshot):
Momentum: Weak | Trend: Developing| Risk: High | Volume: Very High
⚠️ STWP Legal Disclaimer
This document is strictly for educational and informational purposes. All examples, charts, levels, and option structures discussed are illustrative and are not intended as buy, sell, or hold recommendations. STWP does not provide investment advice, trading tips, signals, or personalized financial guidance of any kind, nor is it a SEBI-registered intermediary or research analyst. The analyses, illustrations, and risk–reward structures included here are generic in nature and based on publicly available data and observed market behaviour, which may change without notice. Financial markets involve significant risk; derivatives in particular carry the potential for substantial losses. Option premiums, implied volatility, open interest, delta, and other market variables can fluctuate rapidly and unpredictably.
Readers are solely responsible for their trading decisions, capital management, and risk assessment. Before making any investment or trading decision, please consult a SEBI-registered investment advisor. STWP, its representatives, and affiliates shall not be liable for any direct or indirect loss arising from the use of this material. Historical patterns or past market behaviour do not guarantee future outcomes, nor should any part of this document be interpreted as a promise of performance, accuracy, or returns.
Position Status: No active position in this instrument at the time of analysis.
Data Source: TradingView & NSE India.
💬 Found this useful?
🔼 Boost this post to support structured learning
✍️ Share your thoughts or questions in the comments
🔁 Forward this to traders who value clean technical studies
👉 Follow for disciplined, structured, STWP-style analysis
🚀 Stay Calm. Stay Clean. Trade With Patience.
Trade Smart | Learn Zones | Be Self-Reliant 📊
BDL - Breakdown With Reactive Oversold Conditions💹 Bharat Dynamics Ltd (NSE: BDL)
Sector: Defence | CMP: 1324.3
View: Bearish — Breakdown With Reactive Oversold Conditions
BDL has decisively broken below its recent consolidation structure near the 1350–1380 zone, confirming a bearish continuation phase rather than a routine pullback. The breakdown candle is wide-ranged and supported by above-average volume, signalling active supply dominance and institutional distribution. This move has pushed price into lower demand territory, invalidating earlier stabilization attempts and keeping the broader structure tilted to the downside.
From a structural standpoint, the stock remains firmly in a lower-high, lower-low sequence, with price trading well below its short- and medium-term moving averages. RSI has slipped to around 29.8, placing the stock in an oversold zone, but this should be read as exhaustion within a downtrend, not as a reversal signal. Stochastic is deeply oversold, while MACD remains negative with expanding bearish momentum, indicating sellers continue to control price discovery. ADX suggests the trend phase is still active, though volatility is beginning to rise as price approaches nearby demand.
Volume behaviour adds important context. While participation is above average (Vol-X ~1.06), it is not climactic, implying that selling pressure is orderly and controlled, not panic-driven. This keeps the door open for short-term reactive bounces, but does not yet support a structural trend change.
Key Support & Resistance Zones (Chart-Aligned)
Resistance Zones:
• 1348–1373 (broken base, now supply)
• 1387 (upper supply / rejection zone)
Support Zones:
• Support 1: 1309.93 (minor demand, reaction-level support)
• Support 2: 1295.57 (intermediate demand)
• Support 3: 1271.03 (next structural support)
Support 1 at 1309.93 is expected to act as a pause or bounce zone, not a reversal base. A sustained breakdown below this level increases downside probability toward 1295.57 and 1271.03, while any bounce into the 1348–1373 region is likely to face renewed supply unless accompanied by clear structural improvement.
On the derivatives side, the 1320 PUT is referenced purely for analytical insight. The option shows an LTP near 25 with a delta of about -0.45, offering balanced directional sensitivity. A sharp OI contraction of over 30 percent alongside a strong volume expansion highlights short-covering-led activity, not aggressive fresh bearish positioning. IV remains in a mid-range band, consistent with reactive price behaviour rather than sustained trend acceleration.
Overall, BDL remains in a bearish structural phase with weak momentum and elevated risk. Short-term oversold bounces are possible near Support 1, but the larger framework continues to favour sell-on-rise behaviour unless price reclaims resistance with strong follow-through and volume confirmation.
Final Outlook (Educational Snapshot):
Momentum: Weak | Trend: Down | Risk: Low| Volume: Normal
⚠️ STWP Legal Disclaimer
This document is strictly for educational and informational purposes. All examples, charts, levels, and option structures discussed are illustrative and are not intended as buy, sell, or hold recommendations. STWP does not provide investment advice, trading tips, signals, or personalized financial guidance of any kind, nor is it a SEBI-registered intermediary or research analyst. The analyses, illustrations, and risk–reward structures included here are generic in nature and based on publicly available data and observed market behaviour, which may change without notice. Financial markets involve significant risk; derivatives in particular carry the potential for substantial losses. Option premiums, implied volatility, open interest, delta, and other market variables can fluctuate rapidly and unpredictably.
Readers are solely responsible for their trading decisions, capital management, and risk assessment. Before making any investment or trading decision, please consult a SEBI-registered investment advisor. STWP, its representatives, and affiliates shall not be liable for any direct or indirect loss arising from the use of this material. Historical patterns or past market behaviour do not guarantee future outcomes, nor should any part of this document be interpreted as a promise of performance, accuracy, or returns.
Position Status: No active position in this instrument at the time of analysis.
Data Source: TradingView & NSE India.
💬 Found this useful?
🔼 Boost this post to support structured learning
✍️ Share your thoughts or questions in the comments
🔁 Forward this to traders who value clean technical studies
👉 Follow for disciplined, structured, STWP-style analysis
🚀 Stay Calm. Stay Clean. Trade With Patience.
Trade Smart | Learn Zones | Be Self-Reliant 📊

ETHUSD: Reversal or Another Bull Trap?Look at this:
ETH played the trap perfectly. After pushing into the 3200–3400 resistance zone, price failed to sustain above it and rolled over, confirming that the move was distribution, not strength. Sellers stepped in exactly where a Wave 4 rally should fail.
The rejection was followed by a clean breakdown of the parallel rising channel, which shifts the short-term bias back in favor of the bears. That channel was the last structure holding the corrective bounce together. Once it broke, the bullish case weakened sharply.
This drop reinforces the view that the move up from 2620 was only a Wave 4 correction, not the start of a new trend. With Wave 4 likely complete, ETH appears to be transitioning into Wave 5 of the broader corrective decline.
As long as price remains below the broken channel and prior resistance, downside continuation remains the dominant scenario. The structure opens the door for a retest of 2620 , with a deeper extension toward 2465 if selling pressure accelerates.
Until ETH reclaims the channel with strength and acceptance, this remains a sell-the-bounce environment. The warning came at the trap zone, and the market is now following through.
Stay Tuned!
Money Dictators,
R.D :)

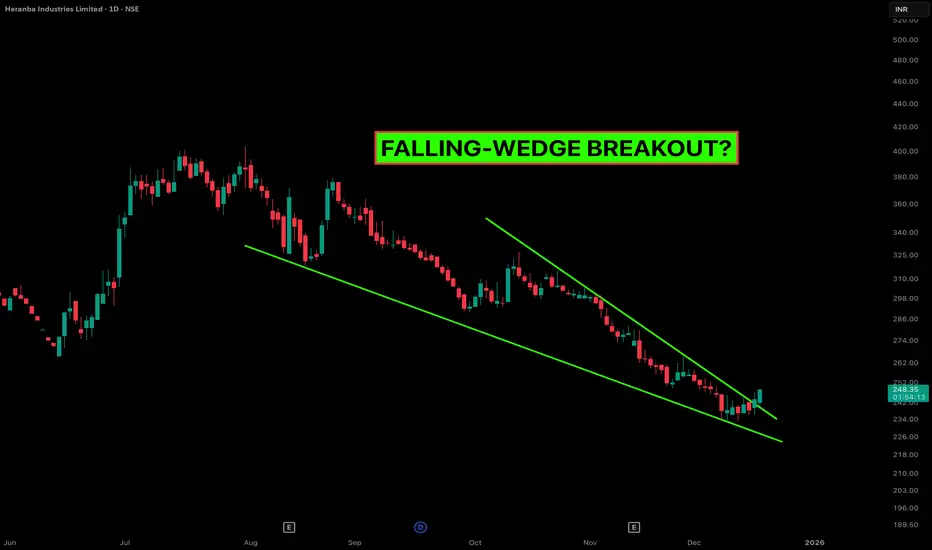
Heranba Industries: Why Falling Wedges Often Mark the BottomThe Setup Heranba Industries (NSE: HERANBA) has been in a corrective phase for months, but the structure has now matured into a classic Falling Wedge Pattern on the Daily timeframe.
For those new to this pattern: A Falling Wedge is a bullish reversal pattern. It is characterized by "Lower Highs" and "Lower Lows" contracting into a narrower range. This contraction signals that selling pressure is exhausting and buyers are stepping in at higher relative lows.
Technical Breakdown:
Price Action: The price has respected the upper trendline resistance multiple times. The recent breakout candle suggests a shift in momentum.
The Psychology: Notice how the selling waves are getting shorter? This "compression" usually precedes an expansion in volatility (the breakout).
Volume Profile: We are looking for a spike in volume to confirm the breakout validity. A low-volume breakout is often a trap, so watch the close.
Trade Management (Educational View):
Aggressive Entry: On the immediate break of the upper trendline (Current Levels: ~247-248).
Conservative Entry: Waiting for a "Retest" of the trendline around 240-242 to confirm support.
Stop Loss: Strictly below the recent swing low (invalidate the pattern if price falls back into the wedge).
Targets: The theoretical target of a wedge is often the top of the wedge structure (the origin of the pattern).
Risological Note: We track these compression patterns because they offer high Risk-to-Reward ratios. We are not predicting the future; we are reacting to probability.
XAUUSD (Gold Spot) Technical Outlook - 17/12/2025XAU/USD – Technical Update
Gold trades near $4,332 and remains in a strong bullish trend across all timeframes, supported by price holding well above key moving averages. Momentum is strong, though short-term indicators are overbought, hinting at minor pullbacks.
Key Levels:
Support: 4300–4305 | 4290 | 4270
Resistance: 4335 | 4367 | 4400
Intraday Strategy:
Buy dips: 4300–4310
Targets: 4335 → 4365
SL: Below 4270
Fundamentals:
US macro data & Fed expectations keep gold supported amid cautious risk sentiment.
Bias: 📈 Bullish trend | Buy on dips
Disclaimer:
For educational purposes only. This is not financial advice. Trading in Forex, Gold, Crypto, and markets involves high risk. Do your own research and trade at your own risk.

Gold Bulls Eye Major Resistance – Can They Break Through?Gold continues to trade in an upward trend, recovering strongly from recent lows. On the 4-hour chart, price is moving closer to a falling resistance trendline, which has acted as a major barrier in the past. This makes the upcoming resistance zone very important for short-term traders.
The next key resistance lies between $4250–$4265, where profit booking can be expected. This area has multiple technical confluences, and traders should monitor how price reacts here. A successful breakout and close above this zone could lead to an extended rally toward $4320–$4350.
However, if price faces rejection from this trendline, a short-term pullback toward the $4120–$4080 support zone would be normal and healthy for the trend. Despite the short-term caution, the overall market structure for Gold remains bullish as long as the price stays above support.
Disclaimer: This analysis is for educational purposes only and should not be taken as financial advice. Please do your own research or consult your financial advisor before investing.
Analysis By @TraderRahulPal | More analysis & educational content on my profile.
If you found this helpful, don’t forget to like and follow for regular updates.

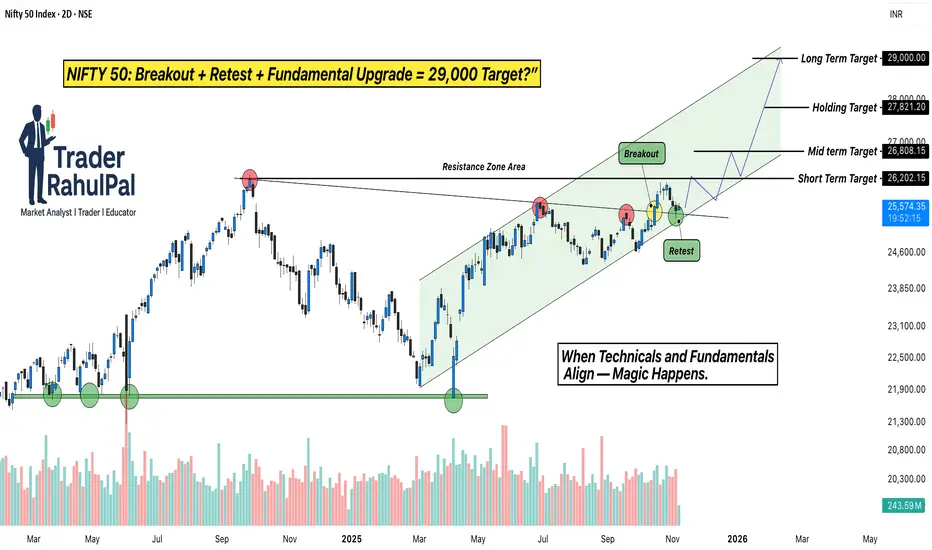
NIFTY Breakout + Goldman Sachs Upgrade = 29,000 Target?Hello Traders!
Today’s analysis is on NIFTY 50 Index, which has recently given a strong Breakout and Retest setup after months of consolidation. The index broke out from its Resistance Zone , retested the breakout area perfectly, and is now holding firmly inside a rising Trend Channel .
This move is not just technical, it’s being backed by major institutional optimism. According to a recent Goldman Sachs report , India’s stock market has been upgraded to “Overweight”, with NIFTY 50 projected to reach 29,000 by 2026 .
Why this setup is special?
Perfect breakout and retest structure with strong volume confirmation.
Channel trend remains intact, showing controlled accumulation at higher levels.
Institutional support from Goldman Sachs aligns with the technical breakout, adding conviction to the rally.
Levels to Track:
NIFTY is holding above the breakout zone near 25,000 , with immediate support seen at 24,600 . As long as the index sustains above this level, the short-term upside remains open toward 26,800 , followed by the next leg around 29,000 , matching Goldman Sachs’ longterm projection.
Rahul’s Tip:
When technicals and fundamentals align, the results are often explosive. A clean retest like this, supported by global institutional confidence, can lead to a powerful trend extension. Traders who position early usually ride the strongest part of the move.
(Analysis By @TraderRahulPal | More analysis & educational content on my profile. If this helped you, don’t forget to like and follow for regular updates.)
Disclaimer:
This analysis is for educational purposes only and should not be taken as financial advice. Please do your own research or consult your financial advisor before investing.
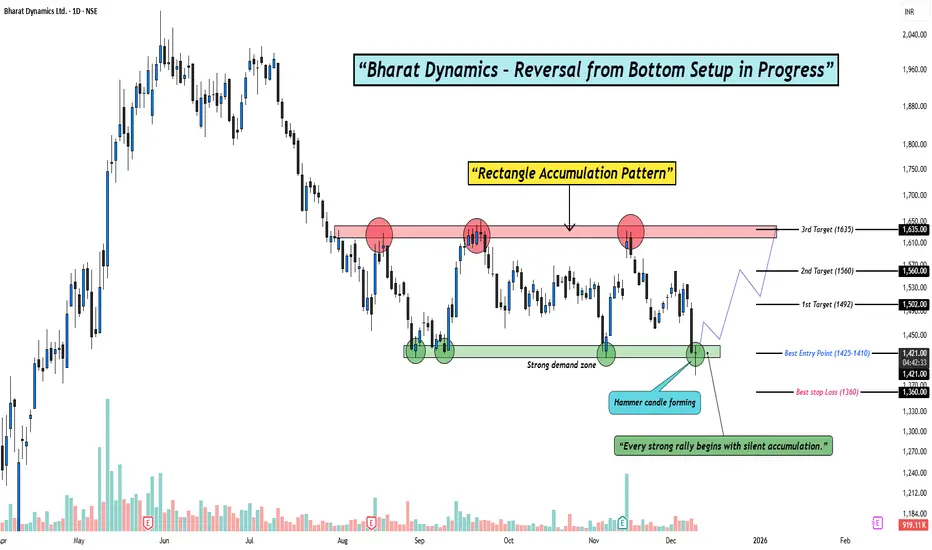
Smart Money Accumulating BDL — Are You Watching This Setup?Hello Traders!
Today’s analysis is on Bharat Dynamics Ltd. (BDL) where a clear Reversal from Bottom Setup is developing. After weeks of sideways consolidation, the stock has formed a clean Rectangle Accumulation Pattern right above a strong demand zone. The latest Hammer candle appearing inside this zone adds strong confirmation that buyers are stepping in again.
Why this setup is special?
Multiple rejections from supply and repeated buying from demand create a classic accumulation range.
The recent hammer candle shows rejection of lower prices and signals potential reversal strength.
Sideways accumulation after a downtrend often leads to strong breakout rallies when demand overpowers supply.
Levels to Track:
The best entry zone lies between 1425–1410, aligning perfectly with demand. As long as price stays above 1360, the structure remains intact. On the upside, the first target sits near 1492, followed by 1560, and finally a breakout extension target around 1635, where previous supply reacts strongly.
Rahul’s Tip:
Every strong rally begins with silent accumulation. Patterns like this look slow at first, but once the breakout hits, momentum often surprises traders who were waiting too long.
(Analysis By @TraderRahulPal | More analysis & educational content on my profile. If this helped you, don’t forget to like and follow for regular updates.)
Disclaimer:
This analysis is for educational purposes only and should not be taken as financial advice. Please do your own research or consult your financial advisor before investing.
INFOBEANINFOBEAN gave breakout of the resistance, there was gap up, then price retraced and tapped at the support-20ema.
Now price is contracting near 620 zone, a breakout from here may give a good upside move.
Keep it in your watchlist for paper trading.
✅ If you like my analysis, please follow me here as a token of appreciation :)
in.tradingview.com/u/SatpalS/
📌 For learning and educational purposes only, not a recommendation. Please consult your financial advisor before investing.

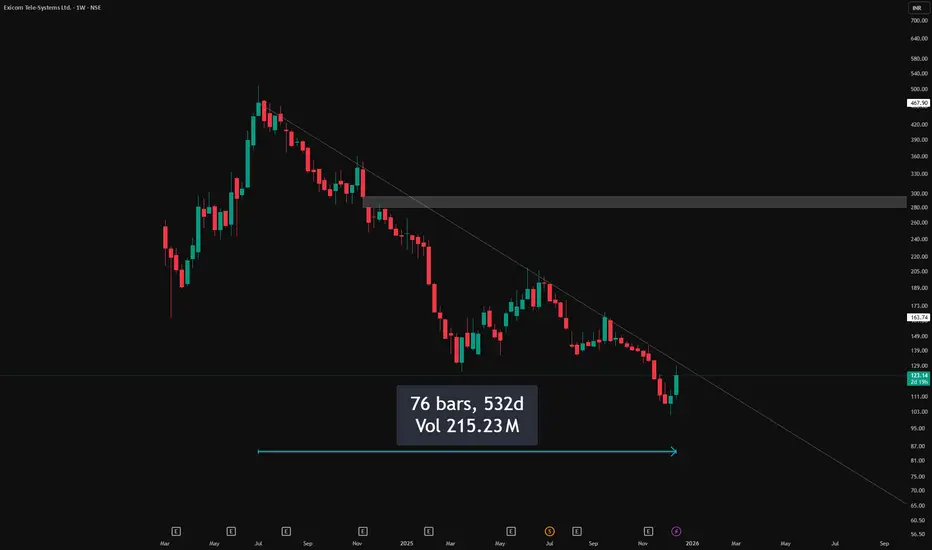
Clean Trendline Respect on Weekly Chart – 500 DaysPattern Context
Price has been respecting a well-defined descending trendline on the weekly timeframe, with each rally stalling below the previous swing high and reinforcing the broader lower‑high, lower‑low sequence.
Candlestick Behavior
Showing how supply continues to respond at the same diagonal zone. This reaction visually confirms how aggressively the market has been defending the pattern’s upper boundary without implying what comes next, keeping the focus strictly on how price has behaved historically around this line.
Observational Takeaway
This chart serves as a clear example of how a simple, clean trendline can organize price behavior over multiple months and frame where participation repeatedly shifts. The emphasis here is on observing how consistently the structure has been respected and how each touch has shaped the ongoing sequence, allowing traders to study price interaction with a dominant trend rather than anticipate future outcomes.
Disclaimer
This post is for educational and informational purposes only and is not investment advice, stock tips, or a recommendation to buy or sell any security. Readers should do their own research, consider their personal risk tolerance, and consult a registered financial professional if needed before making any trading or investment decisions.
XAU/USD Quick Analysis (Gold) 16/12/2025Gold is trading near the 4280–4285 zone, which is the key decision level for today. On lower timeframes, price is weak and range-bound, while higher timeframes remain bullish, indicating a short-term pullback within a larger uptrend.
As long as gold stays below 4285, intraday bias remains bearish, with selling pressure likely near 4290–4310. Downside targets and buy-on-dip zones are 4275, 4260–4255, and 4245–4240. A strong hold above 4290 can flip intraday bias back to bullish, targeting 4305–4320.
For swing trades, the trend stays bullish above 4205–4210. Only a break below 4200 would weaken the bigger picture.
⚠️ Disclaimer: This is for educational purposes only, not financial advice. Trade with proper risk management.

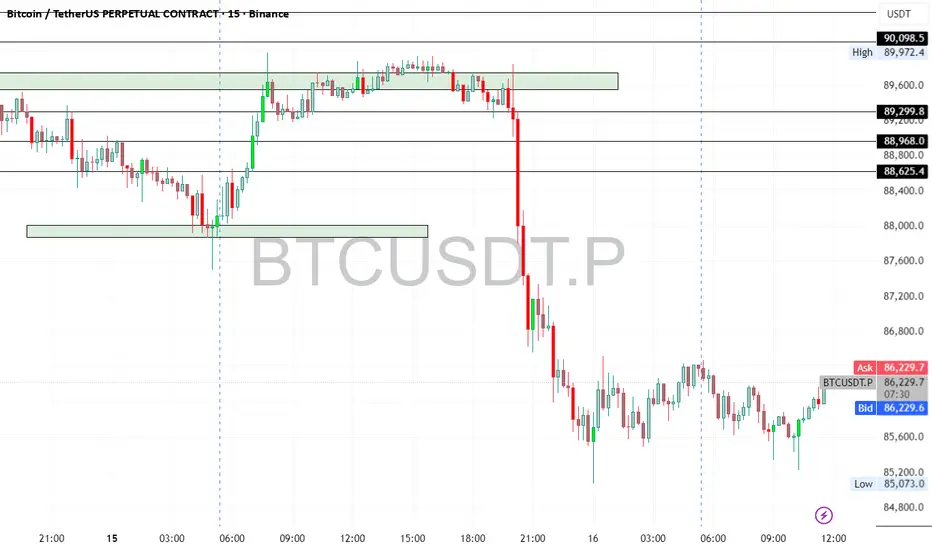
Bitcoin UpdateBTC is down ~2% today but has recovered from the lows and is holding above key support at $86,180 — showing strong respect for the trendline.
Key Levels:
🟢 Support: $86,180 → if this breaks, next major support is $75,000
🔵 Resistance: ~$92,000
🟩 Major Resistance: ~$100,000
Positioning:
I remain long from $86.2K and plan to add near $75K if price drops.
Trend structure remains intact.
#NIFTY Intraday Support and Resistance Levels - 16/12/2025A flat opening is expected in Nifty 50, with price continuing to respect the same consolidation structure observed over the last few sessions. The index is trading near 26,000, which is acting as a short-term equilibrium zone where buying and selling pressure are evenly matched. This confirms that the market is still in a wait-and-watch mode, requiring a clear breakout for directional conviction.
On the upside, a sustained move above 26,050 will be the key trigger for bullish momentum. Holding above this level can open the path for long trades, with upside targets placed at 26,150, 26,200, and 26,250+. A clean breakout above this resistance may invite follow-through buying toward higher levels.
On the downside, if the index fails to hold 25,950–25,900, selling pressure may increase. In such a scenario, short positions can be considered with downside targets at 25,850, 25,800, and 25,750-, where strong demand is expected. Until a decisive breakout occurs, traders should continue to focus on range-based trades, using strict risk management and avoiding aggressive directional bets.

[INTRADAY] #BANKNIFTY PE & CE Levels(16/12/2025)A flat opening is expected in Bank Nifty, with the index continuing to trade within the same defined range seen over the last few sessions. Price is currently hovering around 59,450, which remains a key pivot area where repeated rejections and short-term buying have occurred. This clearly highlights a consolidation phase, suggesting that the market is waiting for a decisive breakout to establish direction.
On the upside, a sustained move above 59,550 will be a positive signal. Holding above this level can trigger buying, with upside targets placed at 59,750, 59,850, and 59,950+. A breakout above this zone may gradually shift momentum toward the psychological 60,000 level.
On the downside, failure to sustain above 59,450–59,400 may invite fresh selling pressure. In that case, selling positions can be considered, with downside targets at 59,250, 59,150, and 59,050-, where strong support is placed. Until price breaks decisively on either side, traders should expect range-bound movement, focusing on level-based trades and strict risk management rather than directional aggression.
