Gold Rebuilds Structure Above $3940, Eyeing $4030 Liquidity Pool🔍 Market Context
Gold is attempting to regain bullish momentum as safe-haven demand remains supported by rising geopolitical tensions and uncertainty around the upcoming US ADP employment data.
The market continues to oscillate between risk aversion and rate expectations — with the Fed’s hawkish tone keeping the Dollar capped but steady.
At the same time, capital flow rotation from equities into defensive assets is quietly supporting the metal’s structural recovery, with gold holding above key liquidity levels despite intraday volatility.
📊 Technical Analysis (H1–H4)
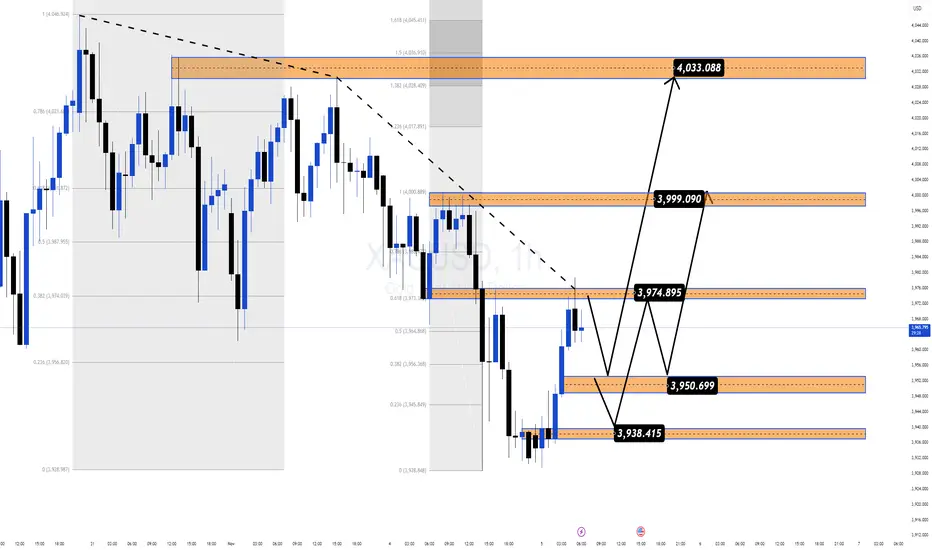
After forming a double-bottom structure near $3,938, XAU/USD has reclaimed the 38.2% retracement zone (3,974–3,975) from its previous bearish leg.
This area now acts as a pivot zone, separating short-term bullish continuation from potential retracement.
The chart reveals a classic liquidity cycle shift:
Phase 1: Sweep of downside liquidity below 3,930, marking an internal structural low.
Phase 2: Expansion leg reclaiming short-term FVGs, signaling a potential smart money accumulation phase.
Phase 3: Repricing toward upper liquidity targets aligned with Fibonacci extensions.
Key Technical Zones:
• 💎 Liquidity Base: 3,938 – 3,950 (recent demand re-entry area)
• 🎯 Rejection Zone 1: 3,974 – 3,999 (previous inefficiency block)
• ⚙️ Target Zone: 4,033 – 4,045 (1.272–1.618 Fibo extensions, liquidity pool)
• ⚠️ Invalidation: Break below 3,920 would shift structure back to distribution.
🎯 MMFLOW Scenario
If gold sustains above the 3,950 support cluster, buyers are likely to extend the retracement toward 3,999–4,033 where resting liquidity sits.
A clean rejection from 4,000 could trigger an intraday pullback — but as long as price holds above the 3,938 OB base, the bullish recovery structure remains intact.
The short-term narrative favors controlled accumulation, suggesting that smart money is building positions into liquidity zones before the next impulsive move.
⚜️ MMFLOW Insight:
“Liquidity isn’t random — it’s engineered. Every move leaves a footprint, and gold is tracing its next one above $3,950.”
Technicalindicators
Gold Pauses Below $4,000 as Markets Digest Hawkish Fed Tone🔍 Market Context
Gold struggles to find direction in early Asia, hovering just below the $4,000 psychological level after the Fed’s hawkish remarks dampened bullish momentum.
Chair Jerome Powell reaffirmed that another rate cut this year is “not a given”, keeping yields supported and safe-haven demand balanced.
Meanwhile, ISM Manufacturing PMI fell to 48.7, signalling cooling momentum but not enough to alter the Fed’s cautious stance.
With odds of a December rate cut near 70%, gold remains trapped between policy uncertainty and soft macro sentiment.
📊 Technical Outlook (H1–H4)
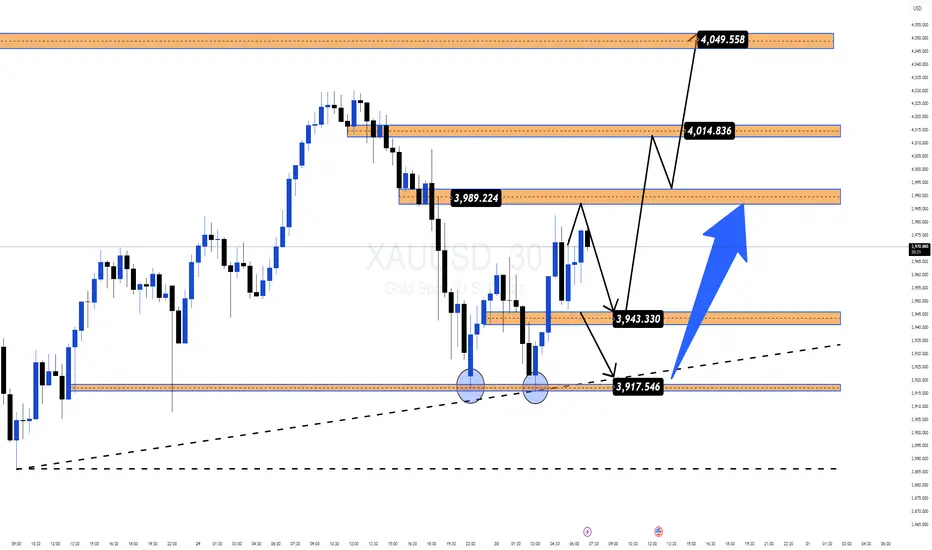
Price is consolidating within a tight structure between 3,963$ and 4,024$, showing compression before a potential expansion move.
The 3,984$–3,963$ zone acts as short-term liquidity support, aligning with the rising intraday trendline.
Key Levels
• 💎 Liquidity Support: 3,963$ – 3,984$
• 🎯 Immediate Resistance: 4,024$
• ⚙️ Bullish Target: 4,046$ (liquidity sweep + expansion zone)
• ⚠️ Invalidation: Below 3,923$, bias shifts to neutral
A clean breakout above 4,024$ could trigger a move toward 4,046$, while failure to hold above 3,963$ may invite another liquidity grab before buyers re-enter.
🎯 MMFLOW View
Smart money remains patient.
As long as 3,963$ holds, dips are seen as accumulation rather than weakness.
But conviction only returns when liquidity confirms above 4,024$ — that’s where momentum aligns with intent.
⚜️ MMFLOW Insight:
“Liquidity doesn’t chase price — it creates the path for it.”

Gold Extends Decline Below $4,000 as Risk Appetite Returns🔍 Market Context
Gold continues to weaken as renewed optimism over US–China trade relations reduces safe-haven demand.
Despite the Fed’s dovish tone after the latest FOMC meeting, the Dollar remains relatively capped, offering limited support to bullion.
However, the technical landscape remains bearish — the decisive break below the $4,000 handle signals a continuation of the downside structure that’s been unfolding since early in the week.
📊 Technical Analysis
• Structure: Clear downtrend across H1–H4, with consistent lower highs and controlled liquidity sweeps.
• Key Resistance: 3,985 – 4,000 (former support now turned supply).
• Short-Term Targets:
– 3,925 – 3,930 → initial liquidity pocket.
– 3,880 – 3,860 → extended bearish target aligned with Fibo 1.618 extension.
• Invalidation: Only a confirmed break & hold above 4,020 – 4,030 would shift bias neutral-to-bullish.
🎯 Trading Outlook
If gold retests the 3,985–4,000 zone and fails to reclaim it, sellers are likely to extend control toward 3,920 or lower ahead of the FOMC-driven volatility.
Momentum remains bearish as long as the market trades below the 4,000 pivot — liquidity below 3,900 may attract smart money before any meaningful rebound.
⚜️ Summary
This decline isn’t random — it’s a structural reset.
The market is rebalancing after months of overextended bullish sentiment.
Watch how price reacts between 3,920–3,880 — this zone could define the next shift in gold’s short-term direction.
📊 MMFLOW TRADING Insight:
“Smart money doesn’t chase candles — it waits for liquidity to shift.”
GOLD (XAU/USD) — Calm Before the FOMC Storm Gold is currently consolidating above $3,950, signaling a pause in volatility as traders await the FOMC decision for the next directional move.
1️⃣ Macro Outlook & Core Bias – FOMC in Focus 🔑
Market Pause: After rebounding during the Asian session, Gold’s upside momentum remains limited. Market participants are cautious ahead of the Fed’s policy update.
Headwinds: Renewed optimism on US–China trade and a slightly stronger USD are capping Gold’s advances.
Game Plan: Stay tactical — identify scalp zones and prepare for a major breakout once the FOMC event unfolds.
2️⃣ Technical Setup – Descending Channel in Play 📉
Structure: Price action is holding above $3,950, but movement remains confined within a descending channel/flag.
Bias: Short-term demand persists, yet the broader structure still favors bears.
Preferred Setup: Watch for BUY scalps from lower demand zones toward the Fibo/channel resistance area.
3️⃣ Trading Plan – Precision & Patience 💰
🟩 BUY Scenario (Long Scalp)
Buy Zone: $3,939.468
Strategy: Look for long scalps targeting the Fibo 0.5 resistance.
Stop-Loss: Tight SL just below the $3,939 level.
🟥 SELL Scenario (Short Setup)
Scalp Sell Zone: $4,015.646 (Fibo 0.5)
→ Short scalps targeting a retest of the channel midline.
Main Sell Zone: $4,046.448 (Fibo 0.618 / Channel Ceiling)
→ Ideal entry for a continuation short, aligning with the overall bearish channel.
4️⃣ Trader’s Take 🚀
The FOMC decision will set the tone —
Are you eyeing a bounce from $3,939, or waiting for the $4,046 rejection to ride the next wave down?

Gold Extends Decline Below $4,000 as Risk Appetite Returns🔍 Market Context
Gold continues to struggle amid renewed optimism around US–China trade talks.
The shift in sentiment has reduced safe-haven demand, while softer expectations of further Fed rate cuts keep the US Dollar capped — offering limited downside support for XAUUSD.
However, the technical landscape remains clearly bearish.
The break below the ₹4,000 handle confirms continuation of the downtrend first outlined in early-week plans.
📊 Technical Analysis
Structure: Gold maintains a clean bearish channel on the H1–H4 frame.
Immediate resistance: ₹3,985 – ₹4,000 (former support, now supply zone).
Target zones:
• Short-term liquidity area near ₹3,925–₹3,930
• Extended target sits around ₹3,880–₹3,860, aligning with Fibo 1.618.
Invalidation: Only a sustained break and hold above ₹4,020–₹4,030 would neutralize this short-term bearish bias.
🎯 Trading Outlook
If gold retests the broken ₹4,000 zone and fails to regain it,
expect sellers to extend control toward ₹3,920 or lower ahead of the FOMC meeting.
That event may later define the next recovery point — but for now, momentum remains firmly on the downside.
⚜️ Summary
Gold’s recent slide isn’t random — it’s structural.
The market is rebalancing after excessive bullish sentiment,
and liquidity below ₹3,900 is likely to attract attention before any significant rebound.
Watch the reaction near ₹3,920–₹3,880 —
that’s where the next meaningful decision for gold may emerge.
📊 MMFLOW TRADING Insight:
Smart money doesn’t chase candles — it waits for liquidity to shift.

GOLD DIP ALERT! Sniping the $3,89x FIBO Floor Ahead of FOMC!FranCi$$_FiboMatrix Quick Insight (H1/M30 Focus)
Welcome Traders! Gold paused its sell-off near $4,065 as safe-haven demand returned pre-FOMC. Dovish Fed expectations are weakening the USD, setting the stage for a major rally. This is the final BUY ON DIPS setup!
🧠 INSIGHT & LOGIC
Fundamental Anchor: Weak US inflation and strong expectations for a Fed rate cut are the key drivers limiting downside. Long-term bias is Bullish.
Technical Focus: We are tracking the final deep correction to the $3,89x zone (Fibo 1.5 - 1.618 Extension). This is the ultimate technical floor for the ATH rally.
Action Plan: WAIT for the price to hit this extreme zone and confirm reversal (H1/M30).
🎯 KEY ACTION ZONES
🔥 CRITICAL BUY: $3,89x region ($3,881.435$).
Strategy: BUY on confirmation here.
TP TARGET 1: $4,037.647 (Immediate Resistance).
TP TARGET 2: $4,232.374 (Major Structural Resistance).
SL MANDATE: Place SL safely below the 1.618 Fibo zone.
Patience is key. Do NOT rush the entry! Is the $3,89x$ floor strong enough for the ATH rally? 👇

🇮🇳 LiamTrading – XAUUSD: Dual Strategy Ahead of FOMC🇮🇳 LiamTrading – XAUUSD: Dual Strategy Ahead of FOMC | Focus on Buying the Retracement near $3914
Hello Traders,
After a strong sell-off, Gold (XAUUSD) is showing early signs of recovery, building a minor upward structure.
We continue to focus on buying the pullback, viewing this move as a short-term correction within the broader downtrend.
Expect higher volatility as the FOMC decision approaches.
📰 MACRO CONTEXT & FUNDAMENTALS
The market is holding steady ahead of the FED announcement:
🟢 Technical Recovery:
Gold reversed part of its decline during the Asian session, bouncing slightly from a 3-week low as traders await the FOMC rate decision.
🔴 Headwinds:
However, optimism around US-China trade talks and a stronger USD continue to limit the upside momentum.
📊 TECHNICAL VIEW & TRADING PLAN
We are focusing on high-probability liquidity zones for both long and short opportunities:
🟢 Primary BUY Setup (Retracement Buy)
Looking for a retest of the key buy-side liquidity zone to trigger the next recovery wave.
Entry Zone (Buy): $3914
Stop Loss: $3906 (Tight SL recommended)
Take Profit: TP1 $3933 | TP2 $3956
🔴 SELL Setup (Retest / Short-Term Scalping)
Using the broken trend area for short opportunities.
Entry Zone (Sell): $4048
Stop Loss: $4056
Take Profit: TP1 $4035 | TP2 $4022
🧭 SUMMARY & TRADER’S NOTE
Gold is now in a decision zone — volatility will spike around FOMC.
Trade with discipline:
✅ Enter only at confirmed liquidity zones.
✅ Always respect your Stop Loss.
✅ Manage your capital carefully before the news release.
Wishing everyone a profitable and disciplined session!

GOLD DIVE—Sniping the $405x Dip Before FOMC!Welcome Traders! Gold (XAU/USD) is correcting sharply, dropping 1.10% towards $4,065. This weakness is driven by trade optimism, but the underlying Fed rate cut expectation keeps our BUY ON DIPS strategy highly profitable!
🧠 MARKET PSYCHOLOGY (MIND)
Bears' Power: Trade optimism is pushing safe-haven assets down. Sellers are targeting the recent uptrend structure.
Bulls' Anchor: Weak US inflation data means a Fed rate cut is almost certain (25 bps expected). This long-term USD weakness acts as a floor for Gold.
Action Bias: BUY THE DIP at critical Fibo supports, anticipating the Fed decision to fuel the next rally.
📊 KEY LEVELS & ACTION ZONES (H1)
We are using the Fibo retracement from the recent high to define our optimal entry points.
🎯 SELL TARGET / CEILING: $4,164.938 (Zone 416x). This is the immediate resistance and the ultimate target for the Long trade.
🔥 HIGH-CONVICTION BUY ZONE: $4,048.493 (Fibo 0.5 Zone 405x). The optimal entry to maximize risk/reward.
Strategy: Wait for a clean tag and H1/M30 reversal signal here.
⚡️ SCALP BUY REACT ZONE: $4,077.605 (Zone 407x). A quick bounce area for aggressive buyers.
❌ INVALIDATION: SL must be placed safely below the 0.618 Fibo level of the 405x zone.
📈 TRADING PLAN SUMMARY (DIP BUY)
Entry Focus: Prioritize the $4,048.493 (405x) Fibo Zone for a high-quality Long entry.
SL Placement: Strict SL below the 0.618 Fibo of the 405x zone.
TP Target: Aim for the recent high at $4,164.938 (416x).
💬 TRADER'S QUESTION
The drop is here! Are you buying the aggressive 407x level or patiently waiting for the optimal 405x Fibo zone before the expected Fed cut rally?

Plan |Gold Gradually Accumulating, Ready for a Rebound Wave?🔍 Market Context
After reaching the historical peak ATH GOLD 4,371 USD , gold underwent a deep correction, breaking the short-term bullish structure (BoS) and retesting the OB Bearish zone above .
However, since the price returned to the 4,040 – 4,060 USD area, the market has clearly shown signs of liquidity absorption ($$$) and maintained an internal uptrend line, indicating that buying momentum is returning.
The current structure suggests gold is in a re-accumulation phase before forming a medium-term rebound wave towards the 4,185 → 4,243 USD zone.
The buyers hold the advantage as long as the price does not break the main support trendline.
💎 Key Technical Structure
Support Zone: 4,040 – 4,060 USD → a strong support zone confluencing with the trendline, where institutional buying forces have appeared.
Support Trendline: connecting the series of higher lows from 15/10 → the short-term trend remains bullish.
Liquidity Zone $$$: 4,060 – 4,080 → supply absorption zone, confirming its role as a “price base”.
Resistance Zone: 4,149 – 4,185 → the first resistance zone to break to confirm the recovery momentum.
Target FVG / Supply Zone: 4,243 – 4,250 → potential profit-taking zone or point to consider reversal.
Current structure:
→ Short-term: bullish corrective move.
→ Medium-term: potential for forming an extended recovery wave if it holds above 4,040 USD.
📈 Trading Scenarios
1️⃣ BUY Setup – Retest Trendline / Liquidity Zone 4,060 USD
Entry: 4,060 – 4,070
SL: 4,035
TP1: 4,149
TP2: 4,185
TP3: 4,243
✅ Condition:
Price touches the trendline or liquidity zone 4,060 and shows a bullish reversal signal (rejection / bullish engulfing).
➡️ This is a high-probability setup, confluencing the trendline structure + liquidity support zone, often where large buyers re-enter the market.
2️⃣ BUY Setup – Break & Retest resistance zone 4,149 USD
Entry: 4,149 – 4,155
SL: 4,130
TP1: 4,185
TP2: 4,243
✅ Condition:
Wait for the price to break the resistance zone 4,149 with strong volume, then lightly retest without closing the candle below 4,130.
➡️ Trend-following setup – confirms the return of buying momentum and extends the target to the FVG zone 4,243 USD.
3️⃣ SELL Setup (Scalp Reaction) – FVG 4,243 USD
Entry: 4,240 – 4,245
SL: 4,255
TP: 4,185 → 4,150
✅ Condition:
Only execute if there is a strong reaction at FVG 4,243 without a continuation break signal.
➡️ Short-term technical sell – exploiting the supply zone reaction, do not hold the position long.
⚠️ Risk Management
Prioritise trading in the buy direction, avoid selling against the main trend.
If H2 closes the candle below 4,035 → bullish scenario invalid, wait for a new structure.
Do not FOMO buy in the middle range (4,090–4,130).
Keep moderate volume, move SL to breakeven when the price exceeds 4,149.
💬 Conclusion
Gold is in an ascending re-accumulation phase after a strong decline.
As long as the price holds the trendline and support zone 4,040 – 4,060 USD, there is a high chance gold will rebound following the liquidity + breakout retest model, with the main target being 4,185 → 4,243 USD .
If it breaks through 4,243 USD, the market may trigger a stronger recovery momentum towards 4,300 – 4,340 USD .
👉 Reasonable Strategy:
Buy 4,060–4,070 → TP 4,185 / 4,243 USD
Add Buy when breaking 4,149 USD with volume confirmation.
Technical Sell 4,243 USD if there is no signal to break higher.
🔥 “As long as 4,040 holds, gold remains in accumulation — patience will pay.”
⏰ Timeframe: 2H
📅 Update: 27/10/2025
✍️ Analysis by: Captain Vincent

Gold Stuck Near ₹4,100 Ahead of CPIMarket Pulse:
Gold is holding steady around ₹4,100, caught between uncertainty and opportunity as traders brace for the US CPI release and new developments in US–China trade talks.
The yellow metal has paused its recovery from ₹4,050 → ₹4,160, while the US Dollar and bond yields edge higher amid renewed geopolitical tension and surging oil prices.
This is the classic “calm before volatility” moment — the market is simply waiting for data to decide the next wave.
If CPI comes in softer or trade talks disappoint, liquidity could flood back into gold, breaking above ₹4,155–₹4,160 and opening the path toward ₹4,215 → ₹4,261.
But a strong CPI surprise could flip sentiment fast — dragging price back into the ₹4,056 and ₹4,018 buy zones, where the next reaction will decide direction.
📊 Technical Outlook (M30)
Price continues to coil within a tight structure between ₹4,100 – ₹4,155, forming a “spring compression” right below trendline resistance.
Market flow suggests accumulation beneath ₹4,100, hinting that liquidity is building before the next expansion.
Key Structure Zones:
Resistance Pivot: ₹4,154 – ₹4,155 → Key breakout level
Breakout Support (CP Zone): ₹4,056 – ₹4,060
Liquidity Buy Zone: ₹4,018 – ₹4,020
Sell Zone (Fibo Reaction): ₹4,215 – ₹4,261
🎯 Trading Plan – MMFLOW Style
🔹 BUY PLAN – Reaccumulation Base
Entry: ₹4,056 – ₹4,060
Stop Loss: ₹4,045
Targets: ₹4,100 → ₹4,140 → ₹4,155
Focus on reaction candles & liquidity grab confirmation.
🔹 BUY PLAN – Liquidity Sweep Setup
Entry: ₹4,018 – ₹4,020
Stop Loss: ₹4,005
Targets: ₹4,056 → ₹4,100 → ₹4,150
If liquidity sweeps this zone clean, watch for a sharp recovery flow.
🧭 Summary – MMFLOW View
Gold is in “decision mode”, waiting for CPI and macro catalysts to trigger the next trend.
The structure stays neutral-bullish as long as price holds above ₹4,056.
A confirmed breakout above ₹4,155 may unlock a fast rally toward ₹4,215–₹4,260, while a break below ₹4,018 could open the door for one more liquidity flush.
⚜️ MMFLOW Bias: No need to predict the move — just follow the flow when liquidity confirms.
📊 Do you expect gold to break higher after CPI, or trap traders before reversing?

XAU/USD – Gold Completes Liquidity Sweep Phase🔍 Market Context
After a prolonged decline from the peak ATH GOLD 4,371 USD , gold has formed a Liquidity Sweep around the 4,010 USD zone, where the selling side was completely absorbed by strong buying pressure from the demand zone below.
The price structure shows signs of a Change of Character (ChoCH) for the first time since the peak, along with the appearance of an Order Block (OB) 4,081 USD – the starting point for a new upward momentum.
This indicates a high possibility that the market is entering a technical retracement phase , aiming to retest the FVG resistance zone above, or even expand back to the ATH zone if buying pressure continues.
💎 Key Technical Structure
Liquidity Sweep: 4,010 – 4,020 USD → liquidity sweep bottom zone, increased volume appears, confirming absorption of sell orders.
Order Block (OB): 4,081 – 4,090 USD → starting zone for recovery momentum; if the price retests this zone and holds → confirmation signal for an upward phase.
Fair Value Gaps (FVG):
• FVG1: 4,196 – 4,210 USD → first target for the recovery wave.
• FVG2: 4,234 – 4,250 USD → next target, confluence of medium-term resistance.
OB | ATH GOLD: 4,370 – 4,380 USD → major resistance zone, previous peak; if the price surpasses → confirmation of a new upward trend.
Current market structure:
→ Short-term: bullish recovery (recovering from the bottom zone).
→ Medium-term: waiting for confirmation to break 4,234 to transition to a complete bullish structure.
📈 Trading Scenarios
1️⃣ BUY Setup #1 – Retest the Order Block 4,081 USD
Entry: 4,081 – 4,085
SL: 4,060
TP1: 4,196
TP2: 4,234
TP3: 4,370
✅ Conditions:
Wait for the price to retest the OB 4,081 zone, a confirmation signal for an increase appears (rejection / engulfing bullish) or a small BoS on M15.
➡️ This is a classic buy-the-dip setup after a Liquidity Sweep – high probability due to the confluence of OB + ChoCH + strong demand zone.
2️⃣ BUY Setup #2 – Break & Retest FVG 4,196 USD
Entry: 4,196 – 4,200
SL: 4,180
TP: 4,234 → 4,370
✅ Conditions:
The price breaks up the first FVG with good volume, then lightly retests without closing candles below 4,180.
➡️ Trend-following setup, following the money flow when the price confirms breaking the short-term resistance zone.
📉 Alternative Scenario – SELL reaction at 4,234 USD (Short-term Scalp)
Entry: 4,234 – 4,240
SL: 4,255
TP: 4,196 → 4,100
✅ Conditions:
If the price reacts strongly and fails at the second FVG without follow-up volume increase → a short adjustment phase may appear.
➡️ Short-term sell, only execute if there is no continuation confirmation at FVG2.
⚠️ Risk Management
Prioritise BUY according to the main recovery trend, only SELL when there is a clear reaction.
Do not FOMO buy in the middle range (4,130–4,180).
If the price closes H1 candles below 4,060 → invalidate the recovery trend, pause all buy orders.
💬 Conclusion
Gold has completed the Liquidity Sweep phase and is signaling a sustainable technical reversal .
Two important zones to monitor:
4,081 USD (OB Zone): first rebound support zone.
4,234 USD (FVG Zone): zone confirming a new upward structure.
If the price holds OB and breaks through FVG, there is a high chance gold will resume its upward momentum towards the 4,370 USD (ATH GOLD) zone.
👉 Reasonable Strategy:
Buy 4,081 USD → TP 4,234 / 4,370 USD.
Sell reaction 4,234 USD only when a clear reversal signal appears.
🔥 “Liquidity has been swept — now it’s time to ride the recovery wave.”
⏰ Timeframe: 1H
📅 Updated: 23/10/2025
✍️ Analysis by: Captain Vincent

XAU/USD – Gold Tests Final Structure Before Deciding New Wave“If the 3,950 USD zone is breached, the long-term uptrend may end.”
🔍 Market Context
After reaching the historic peak ATH GOLD 4,381 USD , gold has sharply corrected and formed a clear Change of Character (ChoCH) on the H1 timeframe.
Currently, the price is technically recovering to the Resistance – FVG – Fibonacci 4,216 USD zone, which was previously a distribution peak.
The sellers are regaining short-term dominance, while the Order Block zone (3,953–3,960 USD) — which was the starting point of the strongest growth on H4/Daily — is becoming the most critical defense line of the uptrend.
If this zone is decisively broken, it is highly likely that the medium-term bullish structure will break and trigger a bearish expansion towards deeper liquidity zones like 3,689 USD.
💎 Technical Analysis
Resistance – FVG – Fib Zone: 4,216 – 4,228 → confluence resistance zone FVG + Fibo 0.618, suitable for sell reaction.
Liquidity Sweep Zone: 4,043 – 4,006 → intermediate liquidity sweep zone, may see a temporary pause.
Order Block | Structural Base: 3,953 – 3,960 → H4 momentum creation zone → ATH; if breached, long-term bullish structure is invalidated.
Liquidity Zone $$$: 3,689 – 3,685 → deep liquidity zone, potential target if OB is broken.
Overall Structure:
→ Short-term: bearish corrective phase.
→ Medium-term: bullish remains if 3,950 is not broken.
📉 Trading Scenarios
1️⃣ SELL Setup – Reaction at 4,216 – 4,228 USD zone
Entry: 4,216 – 4,228
SL: 4,240
TP1: 4,043
TP2: 3,956
TP3: 3,689
✅ Condition:
Wait for a clear reversal signal (strong rejection or bearish engulfing) on H1/M15 at the FVG resistance zone.
➡️ Classic “Sell the Rally” setup – follow the flow post-ChoCH, targeting the key OB zone 3,953 USD.
2️⃣ BUY Setup – Reaction at Order Block 3,953 – 3,960 USD
Entry: 3,956 – 3,953
SL: 3,940
TP: 4,043 → 4,216
✅ Condition:
Price holds OB and a strong reversal signal appears (bullish engulfing / increased volume / small BoS structure turns bullish again).
➡️ This is the decisive zone for the medium-term trend: if it bounces strongly, buyers will regain control; if it breaks, gold enters a new deep decline cycle.
⚠️ Risk Management
Prioritise SELL when price retraces to 4,216 – 4,228 with reversal signals.
BUY at 3,953 only with a clear reaction; if broken, cease all buy orders.
When price closes H4 candle below 3,950 → confirm bearish break, extend target to 3,689 USD.
💬 Conclusion
Gold is testing the Order Block foundation of the long-term uptrend (3,953–3,960 USD) .
If this zone holds, the market may rebound to 4,216 – 4,280;
but if breached, gold is likely to open a deep decline phase towards 3,689 USD – where a large liquidity pool is concentrated at the bottom.
👉 Reasonable Strategy:
Sell 4,216 – 4,228 USD if clear reversal signals appear.
Buy 3,953 – 3,960 USD if strong reaction;
If 3,950 is breached → confirm extended downtrend, prioritise SELL continuation.
🔥 “This Order Block built the last gold rally — if it breaks, the next leg down will be brutal.”
⏰ Timeframe: 1H – reference H4/Daily
📅 Update: 22/10/2025
✍️ Analysis by: Captain Vincent

XAUUSD – Awaiting a Breakout to Confirm the Next Bullish WaveGold remains under pressure, trading slightly below 4,100 USD/oz despite ongoing geopolitical tensions and weak global sentiment.
On the higher timeframe, the structure still respects its ascending channel, showing no signs of a deep breakdown yet.
During the early Asian session, renewed buying interest has started to emerge, supported by a stable inflow of safe-haven demand.
Technically, price is attempting to form a bullish continuation structure (Dow wave) around the 4,110 zone.
If a breakout above this key level occurs, gold could accelerate toward 4,155, and potentially extend into a corrective bullish wave targeting 4,220–4,260, aligning with the Fibonacci retracement confluence and the CP/OBS sell zone on the chart.
Technical Outlook (M30):
Price action suggests a potential wave recovery structure forming after last week’s steep decline.
The 4,155 level acts as a key inflection point — it will decide whether bulls regain control or bears push for another correction.
Key Levels:
CP Zone Up / Breakout Base: 4,053 – 4,055
Short-Term Key Level: 4,110 – 4,115
Mid-Level Resistance: 4,155 (structure pivot)
Fibo Sell Zone / Wave End Target: 4,220 – 4,263
Trading Plan:
🔹BUY Setup #1
💥Entry: 4,020 – 4,018
❌Stop Loss: 4,010
✔️Take Profit: 4,030 → 4,035 → 4,040 → 4,050 → 4,060 → 4,100
⏸Bias: Reaccumulation Phase (structure support)
🔹BUY Setup #2 (Scalp Play)
🔔Entry: 4,053 – 4,051
❌Stop Loss: 4,043
✔️Take Profit: 4,060 → 4,070 → 4,080 → 4,090 → 4,100 → 4,150
⏸Note: Ideal for intraday traders watching the breakout base.
🔹SELL ZONE (Liquidity Reaction Zone)
📊Entry: 4,263 – 4,265
❌Stop Loss: 4,273
✔️Take Profit: 4,255 → 4,250 → 4,240 → 4,230 → 4,220 → 4,210 → 4,200
⭐️Summary:
Gold continues to consolidate above 4,050, showing signs of early recovery after the recent 3,000-pip correction.
The 4,155 level remains the key pivot for short-term direction — a breakout here could confirm a Wave 3–5 recovery structure, while rejection could bring one more pullback.
Macro and geopolitical uncertainty still favour safe-haven flows, keeping the bullish scenario valid as long as 4,000–4,020 holds.
📊What’s your take — will gold break above 4,155 to start a new bullish wave, or reject and extend the correction further?

GOLD PULLBACK: $4330 SLIDE! Sniping the Fibo BUY Zone🎯 Macro Summary & Bias: USD Stability Triggers Profit-Taking
Gold is extending its corrective slide from the all-time high zone, hitting around $4,331 - $4,330.
Primary Headwind: The US Dollar (USD) attracted buyers for three consecutive days, causing stability which triggered profit-taking in the overbought Gold market.
Long-Term Support: DXY trades slightly negatively due to the US government shutdown and trade tensions, keeping the long-term bullish outlook intact.
Technical Bias: The market is in a deep correction/profit-taking phase. Our focus is strictly on finding the FIBO BUY REACT ZONES to join the underlying bullish trend. DO NOT CHASE THE SELL MOVE.
📊 In-Depth Technical Analysis (H1): Pinpointing the FIBO Reaction Levels
Based on the current corrective structure and the Fibo/Volume zones defined on image_ddd575.png, we have our strategic levels:
1. Strategic SELL Zones (FIBO SELL REACT ZONES):
These are current resistance areas for short-term rejection or supply zone testing:
REACTION FIBO SELL ZONE 4340 - 4320: Current resistance. Look for a SCALP SELL opportunity if the price rejects this zone.
REACTION SELL ZONE - Big Volume for Sell Side 435x: Major supply/liquidity zone if price attempts a deeper retracement.
2. Strategic BUY Zones (FIBO BUY REACT ZONE):
These are the most critical Fibo support zones for initiating Long entries:
REACTION FIBO BUY ZONE 4270 - 4265: The first crucial Fibo Retracement support.
REACTION BUY ZONE - Big Volume For Buy Side 4230 - 4220: The high-volume demand zone and optimal entry point for the major Long trade.
📈 TODAY'S ACTION PLAN
Primary Action (Prioritize BUY): Wait for the price to correct to the REACTION FIBO BUY ZONE 4270 - 4265 or 4230 - 4220.
Long Entry: Execute the BUY entry only upon confirmed reversal candles (H1/M30/M15).
Scalp SELL Action: If the price strongly rejects the 4340 - 4320 zone, a quick SCALP SELL targeting the nearest BUY ZONE can be considered.
Targets (TP): Aim for the highs and the 435x Sell Zone for the Longs.
⚠️ Risk Warning
Risk Management: Always place a safe Stop Loss (SL) below the nearest active BUY ZONE. DO NOT OVERLEVERAGE in this corrective phase.
Wishing all FranCi$$_FiboMatrix traders a disciplined and victorious day!

Entry: Near $4,320 – $4,325 (Buy Zone) Stop-Loss: Below $4,310 Market Structure Overview
The price is currently moving inside a descending channel (marked as TRADE LINE).
A Buy Zone is identified between $4,315 – $4,325, which acts as a strong support area.
Price has touched the lower channel line and rebounded upward, indicating buyer interest around that zone.
📉 Short-Term Trend
The short-term trend is bearish due to lower highs and lower lows inside the channel.
However, momentum shows weakening selling pressure near the buy zone.
🟢 Bullish Scenario
If price holds above the Buy Zone and forms bullish candles, expect a potential reversal toward the upper channel line.
A breakout above the upper channel would signal a trend shift, targeting:
Target: $4,381 – $4,385 (as marked on your chart).
🔴 Bearish Scenario
If price breaks below $4,315, it would invalidate the buy zone setup.
Next potential support could be around $4,300 or lower.
📊 Trade Plan Example
Entry: Near $4,320 – $4,325 (Buy Zone)
Stop-Loss: Below $4,310
Take-Profit: $4,380 – $4,385
Risk-to-Reward: Approximately 1:4
⚙️ Summary
Gold is currently consolidating within a descending channel.
A bullish breakout from this structure could open the path toward the $4,381 target zone, confirming short-term bullish reversal momentum. LME:SC1! TMX:SXF1! TMX:CGB1! TMX:CGZ1! TMX:CGF1! TMX:LGB1! TMX:BSF1! TMX:FBA1! TMX:FCN1! TMX:FDO1! TMX:FEB1! TMX:FER1! TMX:FEB1! TMX:FHO1!

XAUUSD PLAN | When balanced breaks, strength leaves its mark.🔍 Market Context
After setting a short-term peak at the 4,385 – 4,372 USD zone, gold has entered a strong technical correction phase, with a series of consecutive red candles breaking the short-term upward structure.
The sellers temporarily dominate, pushing the price through the H1 upward trendline. However, the support zone below (Liquidity Zone + Order Block Bullish) is beginning to show absorption, indicating that buyers might return at discounted price zones.
💎 Technical Analysis
Previous Bullish BoS: confirms the main trend is still long-term bullish .
FVG Down Zone: 4,285 – 4,260 USD → a price imbalance zone left in the downtrend, possibly where the price may retrace to “fill the gap” before choosing a direction.
Liquidity Zone $$$: 4,222 – 4,218 USD → a short-term support zone where new buying liquidity appears.
Order Block Bullish: 4,203 – 4,185 USD → a confluence area between OB and Fibo 0.786, where large capital might return.
Deep Bullish OB: 4,142 – 4,128 USD → the last defensive zone for the main upward trend.
Order Block Bearish: 4,372 – 4,385 USD → a critical resistance zone, likely to react if the price retraces.
The current structure shows gold is in a retracement – liquidity rebalancing phase, with insufficient signals to reverse the trend.
📈 Trading Scenarios
1️⃣ Main Scenario – Buy reaction at Liquidity zone 4,222 – 4,203 USD
Entry: 4,222 – 4,203
SL: 4,185
TP: 4,260 → 4,318 → 4,372
✅ Condition: Strong rejection candle (rejection / engulfing bullish) appears at the support zone or small reversal BoS.
➡️ This is a “buy the dip” setup following the main trend, leveraging the liquidity zone and confluence OB.
2️⃣ Secondary Scenario – Sell reaction at FVG Down 4,285 – 4,260 USD
Entry: 4,260 – 4,285
SL: 4,300
TP: 4,222 → 4,203
✅ Condition: Strong bearish candle or rejection signal appears at the FVG zone.
➡️ This setup is for scalping traders or short-term shorts in the unfilled price balance zone.
⚠️ Risk Management
Do not FOMO buy when the price has not confirmed the 4,222 zone.
If the price breaks below 4,185 → wait for a re-test to continue selling towards the 4,128 zone.
Keep moderate volume, as the market is in a rebalancing phase – liquidity remains noisy.
💬 Conclusion
Gold is in a transitional phase after a strong decline .
The 4,222 – 4,203 USD zone will be key to determining whether the medium-term upward trend continues.
If this zone holds, gold is likely to retest the 4,318 – 4,372 USD zone.
👉 Reasonable Strategy:
Buy reaction at 4,222 – 4,203 USD when confirmed.
Technical Sell at FVG 4,260 – 4,285 USD if a clear rejection appears.
🔥 “When the market is unbalanced, the strongest side will leave a mark – and this time, the mark is around the 4,220 USD zone.”

GOLD Accumulates Above $4200 Which Fibo React Zone Fires First ?🎯 Macro Summary & Bias: The Calm Before the Geopolitical Storm
Gold is trading above the psychological $4,200 mark but struggled to gain meaningful traction on Monday due to mixed forces.
Driving Forces: Increased geopolitical tensions and trade uncertainty act as tailwinds for the safe-haven asset.
USD Weakness: Expectations for more Fed rate cuts and the US government shutdown weaken the USD, providing support for XAU/USD. Traders have fully priced in two more rate cuts this year, which continues to pressure the US Dollar.
Technical Outlook: Gold is currently consolidating above $4,200, signaling that the bullish structure remains intact. We are now watching for confirmation at key Fibo levels before the next breakout.
📊 In-Depth Technical Analysis (H1): Pinpointing the FIBO Reaction Levels
Our core strategy is to BUY ON DIPS at the identified Fibo Reaction Zones and look for short-term Sells only as resistance tests (Referencing image_58f686.png).
1. Strategic BUY Zones (FIBO BUY REACT ZONE):
These are the crucial support zones for initiating Long entries:
Reaction Fibo Buy Zone 4230 - 422x. This is the immediate, primary support zone where we anticipate the first bounce.
Big Volume For The BUY Side 4205 - 4200. This is the major demand zone and the ultimate pullback point to catch the large growth wave.
2. Strategic SELL Zones (FIBO SELL REACT ZONES):
These are high-volume resistance areas for potential Take Profit (TP) or short-term Scalp Sells:
Reaction Fibo Sell Zone 4280 - 4285. The first key resistance level where the price may encounter selling pressure.
Reaction Fibo Sell Zone 4315 - 4320. The next significant resistance and TP level.
Big Volume For The Sell Side 4356 - 4360. The major supply and long-term TP target.
📈 TODAY'S ACTION PLAN
Primary Action (Prioritize CHỜ ĐỢI BUY): The market is consolidating. Do NOT FOMO. Patiently wait for the price to correct to the Reaction Fibo Buy Zone 4230 - 422x.
Long Entry: Upon confirmation (H1/M30/M15 reversal candles) at the BUY Zones, confidently activate the Long (BUY) entry.
Targets (TP): Aim for the successive SELL Zones: 428x, 431x, and the ultimate target at 4356 - 4360.
⚠️ Risk Warning
Risk Management: Always place a safe Stop Loss (SL) below the nearest active BUY ZONE. Monitor trade talks closely as they could trigger sharp volatility.
Wishing all FranCi$$_FiboMatrix traders a disciplined and victorious week!

4,200 or 4,285? Gold’s Next Move Decides It All📊 Market Overview
Gold remains under pressure at the start of the week, trading below last week’s record highs, after a sharp correction from the 4,380s down to the 4,240 zone.
Investor sentiment is cautious as the market navigates a mix of uncertain U.S. economic data, a still-closed U.S. government, and renewed geopolitical tensions across multiple regions — all of which are fueling both fear and indecision in the market.
During early Asian hours, gold showed a mild recovery but continues to move sideways in a tight consolidation range, reflecting indecisive liquidity buildup before the next major move.
🧠 Technical Structure (MMFLOW View)
Gold is consolidating between short-term support near 4,206–4,204 and resistance around 4,285–4,287.
Liquidity has started to cluster above and below the current range, suggesting that a breakout is imminent.
The 4,166 – 4,140 region remains a major Smart Money re-entry zone, aligned with the CP BUY ZONE + OBS demand block.
On the upside, 4,313 – 4,342 stands as a key supply zone where large sellers previously stepped in.
Until price breaks out decisively, traders should expect choppy intraday conditions with limited follow-through.
🔑 Key Levels to Watch
🟢 BUY ZONE (Liquidity Re-entry Zone)
Zone: 4,206 – 4,204
SL: 4,200
TP: 4,210 – 4,215 – 4,220 – 4,230 – 4,240 – 4,250 – ???
🔴 SELL ZONE (Liquidity Reaction Zone)
Zone: 4,285 – 4,287
SL: 4,292
TP: 4,280 – 4,275 – 4,270 – 4,260 – 4,250 – ???
⚙️ MMFLOW Scenarios
1️⃣ Bullish Scenario:
If gold sustains above the 4,200 – 4,210 support area, a short-term rebound toward 4,270 – 4,285 can be expected.
Breaking above 4,287 would open room toward 4,313 – 4,342 (OBS Sell Zone), where Smart Money may begin distributing again.
2️⃣ Bearish Scenario:
A clean break below 4,200 could trigger a deeper retracement toward 4,166 – 4,140 (CP BUY ZONE).
This would still represent a healthy correction within the broader bullish macro structure.
⚡️ MMFLOW Insights
Market remains neutral-to-bullish, but current movement reflects accumulation within a compression range.
Sideway structure indicates the market is loading liquidity for the next impulsive leg.
Patience is key — traders should wait for clean breakout confirmations before scaling positions.
⚠️ Trading Notes
✅ Use tight Stop Losses — gold’s volatility remains unpredictable during macro uncertainty.
✅ Avoid over-leveraging while price stays inside the sideway channel.
✅ Focus on reaction zones (CP, OBS, and liquidity sweeps) for precise entries.
🧭 Quick Summary
Gold trades sideways below record highs.
Key support: 4,206 – 4,204, key resistance: 4,285 – 4,287.
Short-term bias: Range-bound with bullish undertone.
Best approach: Buy dips at liquidity zones; wait for breakout confirmation before trend trades.

Fibo BUY Zone Mandatory for Trend Continuation.🎯 Macro Summary & Bias: The Bulls Are Unstoppable!
Gold is the most sought-after asset as XAU/USD aims directly for the $4,300 mark and further.
Primary Catalyst: Financial markets remain cautious amidst the ongoing US government shutdown.
Driving Force: Widespread USD weakness—fueled by the funding battle in the US government—strengthens the bullish case for Gold.
Record Strength: XAU/USD is maintaining positive upward momentum despite extreme overbought conditions.
Technical Focus: In this continuous Bull market, FIBO is the paramount tool for identifying the critical pullback points to initiate BUY entries.
📊 In-Depth Technical Analysis (H1): Pinpointing the FIBO Reaction Levels
Our core strategy remains BUY ON DIPS at the most precise Fibo levels, leveraging the strong Parabolic structure.
1. Strategic BUY Zone (FIBO BUY REACT ZONE):
This is the most crucial Fibo support zone where we anticipate a high-probability pullback:
4,321.332 The REACTION FIBO BUY ZONE 0.5.
This is the most vital retracement point to catch the next growth wave.
2. Sell/Take-Profit Targets (FIBO SELL TARGETS):
These are the Fibo extension targets where the Longs are aiming:
TP Target 1 (Extension) 4,436.179 The REACTION FIBO SELL ZONE 1.5 - 1.618. The next immediate target for the rally.
TP Target 2 (Deep Extension) 4,538.394 The REACTION FIBO SELL ZONE 2.5 - 2.618. The long-term target if momentum remains unchecked.
📈 TODAY'S ACTION PLAN
Primary Action (Prioritize BUY): Patiently wait for the price to correct to the REACTION FIBO BUY ZONE 0.5 at 4,321.332.
Upon confirmation (H1/M30/M15 reversal candles), confidently activate the Long (BUY) entry.
Targets (TP): Aim for TP Target 1 (4,436.179) and further to TP Target 2 (4,538.394).
⚠️ Risk Warning
Risk Warning: Given the extreme overbought conditions, always place a safe Stop Loss (SL) below the Fibo BUY ZONE and maintain stringent risk management!
Wishing all FranCi$$_FiboMatrix traders a disciplined and victorious day!

Gold Pulls Back From All-Time High – Correction Looks Limited📊 Market Overview
Gold slightly corrected from its all-time high near $4,239, showing early signs of a short-term pullback, but the overall trend remains bullish.
Despite the correction, fundamental sentiment still supports Gold:
💬 US–China trade tensions and geopolitical risks continue to fuel demand for safe-haven assets.
💵 The US Dollar remains under pressure amid expectations of a Federal Reserve rate cut later this year.
⚖️ Ongoing concerns about a possible US government shutdown further enhance Gold’s attractiveness.
These factors suggest that the current dip is likely a healthy correction within a strong uptrend, not a reversal.
🧠 Technical Structure (MMFLOW Wave View)
Gold has likely completed a minor Wave (V) on the M30 chart, forming a new ATH Zone near 4,239.
Currently, price is unfolding a corrective A–B–C pattern, expected to find support at key liquidity zones before resuming the uptrend.
Our model highlights two potential BUY setups and a short-term SELL scalp opportunity for today’s trading session.
🔑 Key Levels to Watch
🔵 BUY Setup 1
Zone: 4,184 – 4,182
SL: 4,178
TP: 4,188 – 4,192 – 4,196 – 4,200 – 4,210 – 4,220 – ???
🟢 BUY Setup 2 (Deeper Retrace)
Zone: 4,148 – 4,146
SL: 4,140
TP: 4,152 – 4,156 – 4,160 – 4,170 – 4,180 – 4,190 – 4,200
🔴 SELL SCALP Opportunity
Zone: 4,230 – 4,234
SL: 4,238
TP: 4,220 – 4,215 – 4,210 – 4,200 – 4,190 – ???
⚙️ MMFLOW Trading View
📈 Price is currently respecting Wave (A) of the correction.
We expect a possible (B) retracement toward 4,220 – 4,230, followed by (C) decline completing near 4,147 – 4,150 (Fibo 0.618 / CP Buy Zone).
From there, Smart Money may re-enter long positions targeting a fresh liquidity sweep toward the 4,285 SELL ZONE.
In short:
The uptrend remains intact, only a short-term correction is unfolding.
Patience is key — best opportunities will likely appear around 4,150 – 4,180 range.
The structure aligns perfectly with both technical confluence (Elliott + Liquidity Zones) and macro sentiment.
If the market holds above 4,140, Gold could aim for new highs toward 4,285 – 4,300 in the next few sessions.
However, traders should:
✅ Always use Stop Loss — volatility is high near record highs.
✅ Avoid overtrading in narrow pullback zones.
✅ Focus on reaction at key liquidity levels before entering.
⚡️ Summary
Gold remains technically bullish with limited downside correction.
Watch for price reaction around 4,184 and 4,147 — both zones represent strong liquidity areas where Smart Money may look to buy again.
After completing this correction, a new impulsive leg up toward 4,285+ could unfold, potentially marking the next all-time high.

XAUUSD – Safe-Haven Flows Continue to Support GoldMarket Context:
Gold has attracted strong buying for the fourth consecutive session, supported by a mix of global risk factors: renewed US–China trade tensions, rising geopolitical uncertainty, and growing fears of a prolonged US government shutdown.
Meanwhile, dovish expectations from the Federal Reserve are keeping the USD under pressure — further enhancing the appeal of gold as a non-yielding safe-haven asset.
During the Asian session, XAU/USD printed a fresh all-time high, with bulls now eyeing a potential extension toward the 4,200 USD/oz region amid escalating global concerns.
Technical Outlook (M30):
Gold continues to respect its ascending channel structure, maintaining dynamic support between 4,167 – 4,154.
As long as price holds above 4,139, the broader trend remains bullish, with the next liquidity target sitting at 4,240 – 4,241.
Key Zones to Watch:
Liquidity Sell Zone: 4,240 – 4,242
ATH Zone / Short-Term Resistance: 4,190 – 4,200
OBS Buy Zone – CP Trendline Support: 4,141 – 4,139
Secondary Buy Zone: 4,114 – 4,112
Trading Plan:
🔹 BUY Zone
Entry: 4.141 – 4.139
SL: 4.134
TP: 4.145 → 4.150 → 4.155 → 4.160 → 4.170 → 4.180
🔹 BUY Zone
Entry: 4.114 – 4.112
SL: 4.106
TP: 4.120 → 4.125 → 4.130 → 4.140 → 4.150
🔹 SELL Zone (Scalp Reaction)
Entry: 4.240 – 4.242
SL: 4.248
TP: 4.235 → 4.230 → 4.225 → 4.220 → 4.210 → 4.200
Summary:
The bullish market structure remains intact as long as price holds above the 4,139 zone.
Watch for potential long opportunities from 4,141 – 4,139, where the confluence of trendline and order block support could trigger fresh demand.
Bulls remain in control, targeting the 4,240 – 4,241 liquidity area in the coming sessions.
📊 What’s your take — will gold break above 4,200 or pause for a correction first?
👉 Follow MMFLOW TRADING for daily market structure insights and institutional-style setups.
🟣 Chart: XAUUSD M30 – Smart Money Flow structure highlighting liquidity pools, CP confluence and key buy/sell zones.

GOLD CRASH ALERT: +60 PRICES DUMP! Waiting for the Ultimate Fibo React BUY Zone.
FranCi$$_FiboMatrix Emergency Action Plan
Gold just suffered a brutal 60-point plunge from 416x to 411x, triggered by mounting geopolitical tensions. The market is volatile, and deep correction is highly likely. We must trade smart, not emotionally.
🎯 EMERGENCY ACTION ZONES (H1/M30)
Avoid chasing! We only trade when price hits our calculated FIBO REACTION ZONES.
1. SCALP SELL RETRACEMENT:
Zone 1 (High): Watch the 407x area (4,077.605).
Zone 2 (Key Fibo Resistance): The 405x area (4,048.493).
Action: If price bounces back into either zone, look for strong bearish rejection to execute a SCALP SELL.
2. CRITICAL BUY REACT ZONE (The Lifeline):
Zone: We are waiting for the AD's updated FIBO REACTION zones that conform to the new deep trend.
Action: DO NOT BUY BLINDLY. Only enter a Long when the price reaches these deeper support levels and gives a strong, confirmed BUY REACT signal.
⚠️ Immediate Focus: OBSERVE & WAIT. The AD will provide continuous updates. Manage risk strictly—this volatility demands discipline!

XAUUSD – Sharp Pullback After Hitting New ATHMarket Context:
Gold has seen a steep intraday drop after hitting a fresh all-time high at 4,179 USD/oz, extending beyond the morning target of 4,170–4,172.
The move likely reflects profit-taking amid broader market caution, as the US Dollar strengthened and GBP fell sharply, indirectly weighing on XAUUSD.
Silver also followed the correction, down over 2%, trading near 51 USD/oz after peaking at 53.60 earlier.
Despite this drop, the overall market sentiment remains defensive — both metals are still up about 2% for the week, suggesting this is a technical retracement, not a full trend reversal.
Technical Outlook (M30):
Price has broken below the short-term rising channel and is now retesting key liquidity areas.
Watch the 4,134 – 4,135 zone for a potential retest (50% pullback) before continuation toward lower buy zones.
End Liquidity Sell Zone: 4,165 – 4,170
Retest Zone (50% Down): 4,134 – 4,135
CP Buy Zone / Fibo 0.618: 4,052 – 4,054
OBS Buy Zone: 4,000 – 4,005
Trading Plan:
🔹 Sell Setup (Correction Play):
Entry: 4,134 – 4,136
Stop Loss: 4,142
Take Profit: 4130 - 4125 - 4120 - 4110 - 4100 - ???
🔹 Buy Setup (Reaction Zone):
Entry 1: 4,052 – 4,054 (Fibo 0.618 Confluence)
Stop Loss: 4,044
Take Profit: 4056 - 4060 - 4065 - 4070 - 4080 - 4090 - ???
Summary:
Gold’s sharp drop after a new ATH signals a short-term correction phase while the broader bullish trend stays intact.
A pullback toward 4,052 or even 4,000 could attract buy-side liquidity before any recovery.
Keep an eye on 4,135 for a potential retest before continuation.
📊 What’s your view — is this just a healthy retracement or the start of a deeper correction?
👉 Follow MMFLOW TRADING for precise intraday setups and structure-based analysis.
