EUR/USD Bearish Rejection at Resistance Zone – Target 1.15392📉 EUR/USD 1H Chart Analysis
Trend: The chart is showing a clear bearish trend inside a descending channel (support & rejection lines). Price continues to respect this downward structure.
Resistance Zone: A strong supply/resistance area is marked at 1.16148 – 1.16307 (highlighted in pink). Sellers are likely to defend this zone.
Indicators:
Price is trading below the 70 EMA and 200 EMA, confirming bearish momentum.
EMA crossover suggests continued downward pressure.
Price Action: Recently, a small pullback (yellow highlight) is visible after touching the lower boundary of the channel, indicating a short-term retracement before another bearish push.
Strategy:
📍 Entry: Look for short entries near the resistance zone (1.16148 – 1.16307).
⛔ Stop Loss: Above 1.16456 (previous high / EMA resistance).
🎯 Target: First target 1.15392, aligning with the projected channel support and marked demand area.
✅ Summary:
EUR/USD remains bearish as long as price stays below the EMAs and inside the descending channel. Expect rejection from the resistance zone and continuation to the downside toward 1.15392.
Technicalindicators

Gold Outlook After FOMC NewsGold Outlook After FOMC News
The recent FOMC meeting did not bring any new policy measures to support the economy. Chair Powell stated that conditions remain stable, and interest rates were kept unchanged. As a result, markets stayed quiet, with expectations now shifting towards September for potential updates.
On the charts, gold completed wave A after reacting strongly to the trendline on the daily timeframe. I expect the market to now form an ABC corrective structure, which would complete a medium-term Elliott cycle. The recent rally also broke above the descending trendline on H4, confirming that the bullish momentum could be more sustainable.
Currently, price is showing a mild pullback since the Asian session. A retracement of around 40–50% on the recent H4 candle would be a healthy move, and it could retest the broken descending trendline. If confirmed, this would establish a stronger bullish Dow structure, opening room for a longer cycle, at least until wave C completes.
The H4 chart also supports this view, with MACD averages pointing upward and trading volume showing steady growth.
Buy Zone: Around 3334 on the H4 candle, in line with the trend for holding medium- to long-term positions.
Sell Zone: Around 3365, once wave C completes and a new cycle begins.
Gold is now showing clearer technical direction. I hope this scenario helps traders align with the market trend. Wishing you all successful trades.
#XAUUSD #Gold #TechnicalAnalysis #PriceAction #ElliottWave #Fibonacci #MACD #CommodityTrading #FOMC

HEROMOTOCO Breakout Alert: Inverted Head & Shoulder PatternHero MotoCorp Ltd has formed a classic Inverted Head and Shoulders pattern on the daily timeframe, a strong indication of a potential bullish trend reversal. This pattern, combined with a breakout above the neckline and support from the 200 EMA, presents a high-probability long setup. This post details the trade plan, key levels, and conditions to validate or invalidate the move.
Chart Analysis Summary:
The stock closed at ₹4,535.90 with a powerful bullish candle, up by 5.20% for the day. This breakout move has occurred after months of consolidation and pattern development. The 200 EMA, which acted as dynamic resistance around ₹4,294, has now been breached with strong momentum, adding further bullish confidence.
The left shoulder of this pattern formed around November–December 2024, the head bottomed out near April 2025, and the right shoulder was developed during June–July 2025. The neckline, placed between ₹4,500 and ₹4,550, was the final resistance, which has now been broken decisively.
Trade Plan & Entry Strategy
If you’ve missed the breakout candle, don’t worry. The ideal approach now is to wait for a retest of the neckline zone, which lies around ₹4,500–₹4,550. If price comes down and finds support here, then traders should watch for bullish candlestick patterns on lower timeframes (like 1H or 4H) before entering. This ensures a high-probability entry with manageable risk.
For aggressive traders, early entries can be considered at current levels, but only with strict risk management and stop-loss placement below the neckline or the last swing low. If the retest holds and bullish momentum continues, this setup has the potential to deliver a clean rally.
Target Zones
The first target for this setup is ₹5,000, which acts as an important psychological and technical resistance. It’s a good point for partial profit booking or trailing stop adjustments. The final projected target based on the height of the pattern is ₹5,480. This level marks the completion of the measured move and can be used for full profit booking if the trend remains intact.
Risk & Invalidation Level
This setup will be considered invalid if the price drops and closes below ₹4,200, which is the base of the right shoulder. A breakdown below this support would indicate that the bullish structure has failed, and the stock may revisit lower zones.
Why This Setup is High-Quality
The Inverted Head & Shoulders is one of the most reliable reversal patterns in technical analysis. In this case, the breakout is supported by strong volume (not shown in the chart), a decisive close above the neckline, and a 200 EMA crossover, all of which provide strong technical confluence. The structure is clean, and the breakout level is clearly defined. Risk is limited and reward is substantial — a great setup for swing or positional trades.
Hero MotoCorp is showing early signs of a potential trend reversal after months of correction and consolidation. The breakout from the Inverted Head & Shoulders pattern offers a golden opportunity for traders looking for bullish setups. If the neckline retest confirms, this trade can offer a great reward-to-risk ratio targeting 5,000 and beyond. As always, patience and disciplined execution are key.

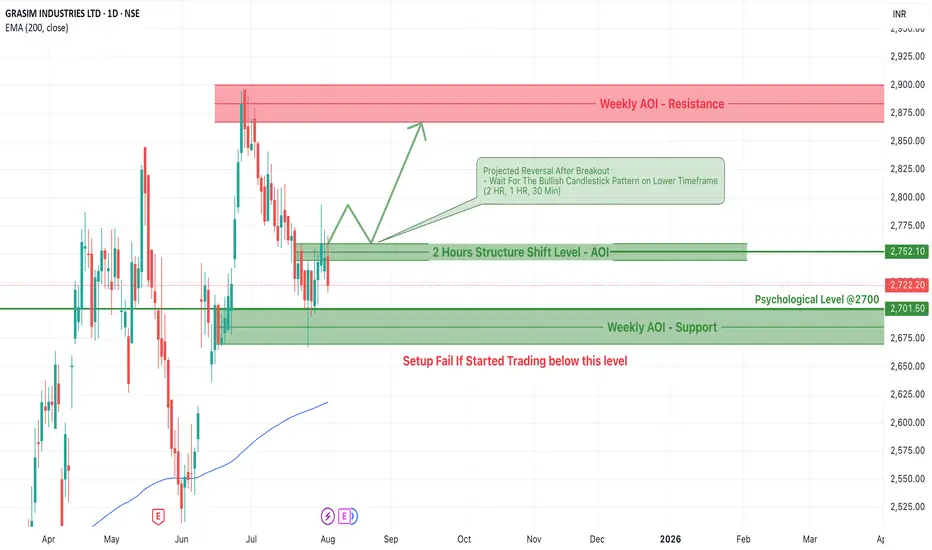
GRASIM Bullish Setup: Key AOI Levels and Reversal Trade PlanGRASIM Industries Ltd is currently forming a potential bullish reversal structure as it approaches a key structural AOI (Area of Interest) zone on the daily chart. This post outlines the complete trade setup, including price action analysis, important zones to monitor, trade plan, and conditions under which the setup could fail.
Key Observations
1. Weekly AOI – Support Zone
Range: Around ₹2,675 to ₹2,701
This green zone represents a strong weekly demand area, acting as a base for potential reversal.
Aligned with the psychological level of ₹2,700, this zone has historically acted as a strong pivot.
2. 2H Structure Shift AOI Zone
Level: ₹2,752.10
This level marks the intraday structure breakout zone on the 2-hour chart.
A successful breakout followed by a retest and bullish candlestick pattern may trigger confirmation for a long position.
Suggested lower timeframes for confirmation: 2HR, 1HR, and 30 Min.
3. Weekly AOI – Resistance Zone
Range: ₹2,875 to ₹2,925
The upside potential is capped at this resistance area, making it an ideal zone for partial or full profit booking.
Trade Plan Breakdown
Projected Move:
Price is currently hovering below the intraday structure shift.
If the price breaks above the ₹2,752 level, traders should wait for a pullback and confirmation in the form of a bullish candle on lower timeframes.
Post-confirmation, an upward move toward the weekly resistance zone is projected.
Entry Strategy
Trigger: Break and retest of the ₹2,752.10 level.
Confirmation: Bullish candlestick pattern (Pin Bar, Engulfing, or Morning Star) on 30 Min – 2HR timeframe.
Stop-Loss: Below the structure AOI or below ₹2,700.
Target 1: ₹2,875 (Near top of Weekly AOI – Resistance)
Target 2: ₹2,900+ (Aggressive target within resistance zone)
Setup Invalidation Level
If the price starts trading below ₹2,700, especially with strong bearish momentum, the setup fails.
In that case, price may revisit lower zones, and traders should refrain from taking long positions.
Technical Confluence
EMA 200 Support: Current price is significantly above the EMA 200 (₹2,618), indicating long-term bullish momentum.
Psychological Level ₹2700: Key psychological round number acting as a magnet and support.
Intraday structure shift: The break of lower timeframe structure adds strength to the setup
Risk Management Guidelines
Position Sizing: Do not risk more than 1-2% of capital per trade.
Wait for Confirmation: Avoid premature entries without bullish candlestick confirmation.
Trail Your Stop-Loss: After price moves into profit zone, trail SL to protect capital.
GRASIM Industries is showing signs of potential reversal and strength near the ₹2,700 zone. The structure shift on the 2-hour chart provides a bullish opportunity, but entry must be cautious and confirmation-based. With a solid risk-to-reward ratio, this could be a textbook breakout-retest trade if conditions align.
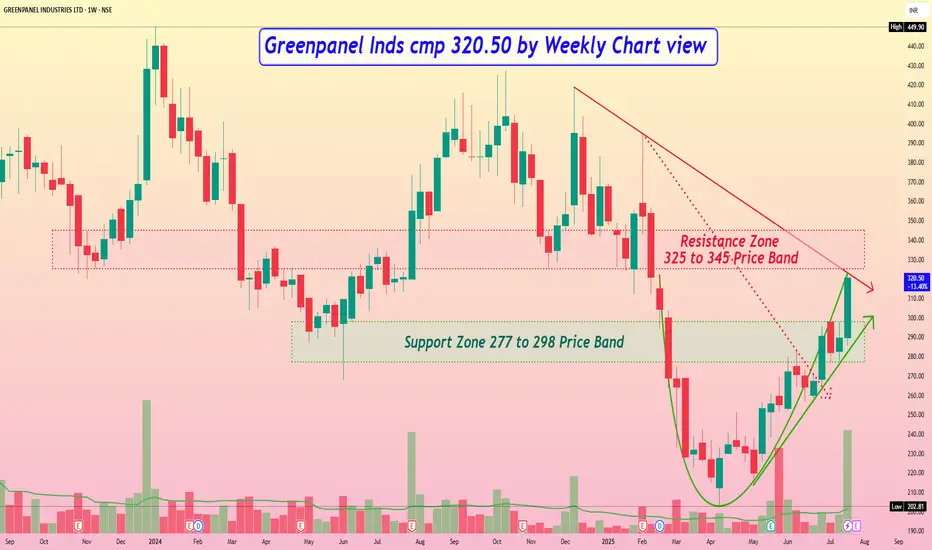
Greenpanel Inds cmp 320.50 by Weekly Chart viewGreenpanel Inds cmp 320.50 by Weekly Chart view
- Support Zone 277 to 298 Price Band
- Resistance Zone 325 to 345 Price Band
- Bullish Rounding Bottom with Resistance Zone neckline
- Rising Support Trendline seems well respected by price momentum
- Volumes have surged very heavily over past week by demand based buying
- 1st Falling Resistance Trendline Brake out done and 2nd Trendline Breakout attempted
- Most common Technical Indicators like BB, EMA, MACD, RSI, SAR are showing positive trend
“Still losing? It’s not your system – it’s your state of mind.”Still Losing Money? It's Not Your Strategy – It’s Your Mind That’s Failing You
Let’s be brutally honest.
Have you been repeating the same mistakes over and over… even though you know they’re wrong?
You know you shouldn’t enter trades without confirmation – but you do.
You know your stop-loss should be fixed – yet you keep moving it.
You know your mental state isn’t stable today – but you open the chart anyway and… trade again.
Don’t blame the market.
You’re not losing because it’s “manipulated.”
You’re losing because your emotions are in control – not your logic.
💣 The most dangerous mindset: Knowing it’s wrong… and still doing it
It’s not about lacking knowledge.
It’s not about having a weak strategy.
It’s about being hijacked by your own emotional reactions.
Ask yourself sincerely:
Are you trading to avoid boredom, anxiety, or emotional pain?
Do you open charts just to escape from real-life stress?
Are your trades a form of self-soothing rather than strategic action?
If yes, then it’s no longer about technical skills.
It’s about emotional management – and inner healing.
👹 Three psychological traps that silently ruin your trading every day:
1. FOMO – Fear of Missing Out
You see price running.
You see others winning.
You panic – “I cannot miss this one!”
→ You enter the trade impulsively, not logically.
FOMO means you don’t trust yourself to wait for better chances.
It’s fear-driven, not system-driven.
2. Revenge Trading – You just can’t stand losing
One loss and your ego is bruised.
You want to "get it back" instantly.
So you fight the market like it owes you something.
But the market doesn’t care.
You’re just venting your frustration – and losing even more in the process.
3. Overtrading – You tie your self-worth to every single trade
You feel valuable only when you’re placing trades.
Doing nothing feels like failure.
So you keep clicking – even without a plan.
Overtrading reflects your need to feel in control, even if it costs you your capital.
🔍 Harsh truth: You’re not losing to the market – you’re losing to your expectations
You expect to win fast.
To become rich fast.
To prove something to others – or to yourself.
And when that doesn’t happen, you spiral.
You're not really trading the charts.
You're trading your emotions.
✅ So what’s the solution?
Stop immediately when you feel emotionally unstable – no matter if you're in profit or loss.
Maintain a journal for your thoughts, not just your trades – track what you feel, not just what you did.
Ask yourself honestly:
Am I trading for profit, or to escape something?
Is this setup real, or am I afraid of missing out?
Invest in your inner self: meditation, walks, talking to a coach or mentor, resting properly.
💬 Final message:
Losing is not the problem.
Refusing to confront the real reason behind your losses – that’s the real danger.
You don’t need a new indicator.
You don’t need a magical strategy.
You need one decent system – and a calm, emotionally neutral mind to execute it.
The game is not on the screen.
It’s inside your head.
#TradingPsychologyIndia #MindsetForSuccess #FOMOTrading #RevengeTrading #OvertradingIssues
#ForexIndia #NSETrader #DisciplineInTrading #TradingStruggles #EmotionalAwareness #TradeLikeAPro
#MentalStrengthInMarkets #TradingMindsetMatters #ConsistencyInTrading
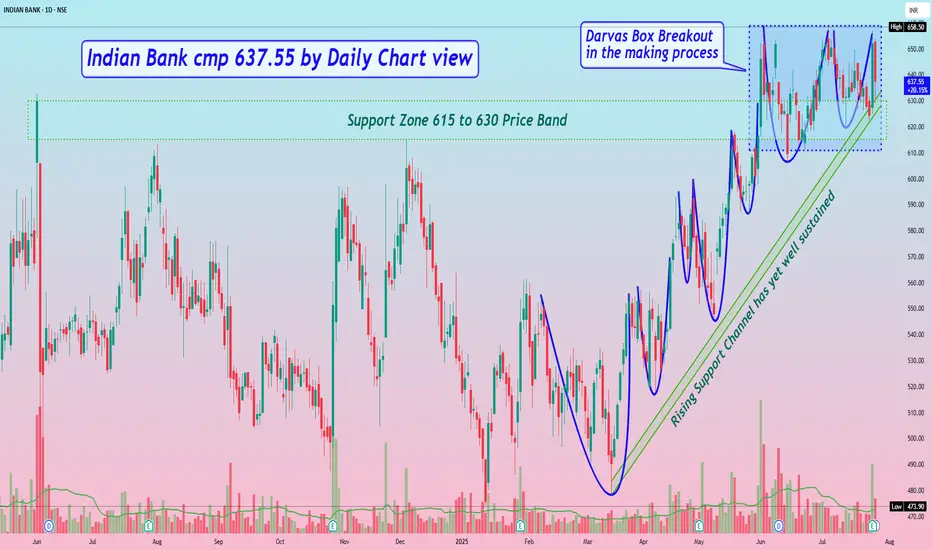
Indian Bank cmp 637.55 by Daily Chart viewIndian Bank cmp 637.55 by Daily Chart view
- Support Zone 615 to 630 Price Band
- Resistance only at ATH 658.80 price level
- Darvas Box Breakout in the making process
- Rising Support Channel has yet well sustained
- Support Zone has been tested retested well enough
- Repeated Bullish Rounding Bottoms at Support Zone neckline
- Considerate VCP pattern formed from Rising Price Channel start point
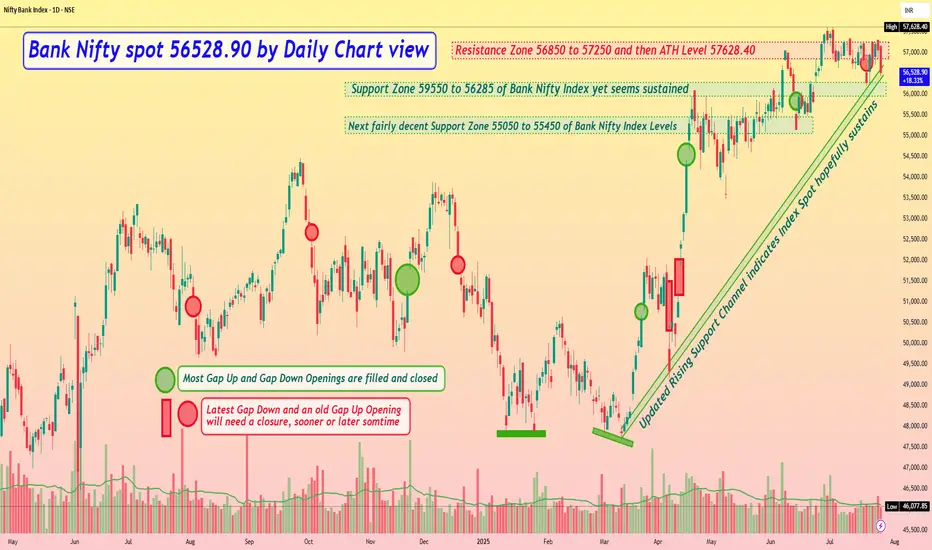
Bank Nifty spot 56528.90 by Daily Chart view - Weekly updateBank Nifty spot 56528.90 by Daily Chart view - Weekly update
- Resistance Zone seen at 56850 to 57250 and then ATH Level 57628.40
- Updated Rising Support Channel indicates Index Spot hopefully sustains
- Support Zone seen at 59550 to 56285 of Bank Nifty Index yet seems sustained
- Next fairly decent Support Zone seen at 55050 to 55450 of Bank Nifty Index Levels
- *Multiple reasons attribute for weakness and breakdown and that is how Markets show their Supremacy*
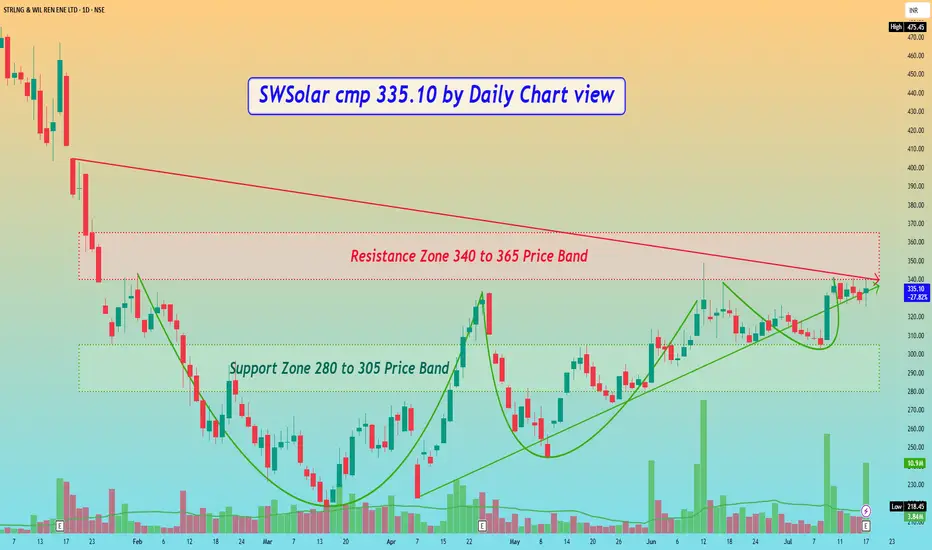
SWSolar Sterling & Wilson cmp 335.10 by Daily Chart viewSWSolar cmp 335.10 by Daily Chart view
- Support Zone 280 to 305 Price Band
- Resistance Zone 340 to 365 Price Band
- Bullish VCP Pattern completed on stock chart
- Volumes spiking heavily at regular intervals by demand based buying
- Resistance Zone Neckline Breakout maybe seen unfolding in the near future
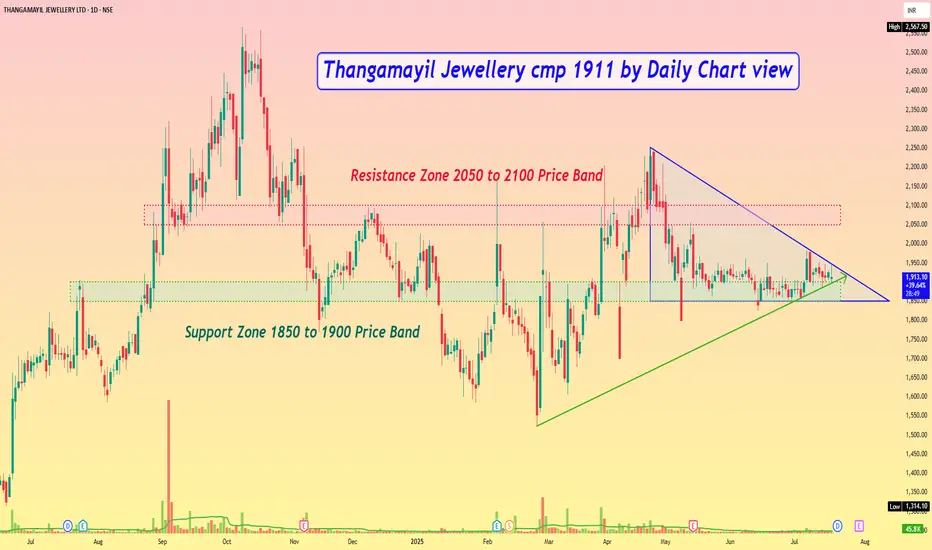
Thangamayil Jewellery cmp 1911 by Daily Chart viewThangamayil Jewellery cmp 1911 by Daily Chart view
- Support Zone 1850 to 1900 Price Band
- Resistance Zone 2050 to 2100 Price Band
- Symmetrical Triangle Breakout in the making process
- Price is currently testing retesting the Support Zone band
- Price action momentum respecting Rising Support Trendline
- Volumes are flat and need to increase for the upside momentum
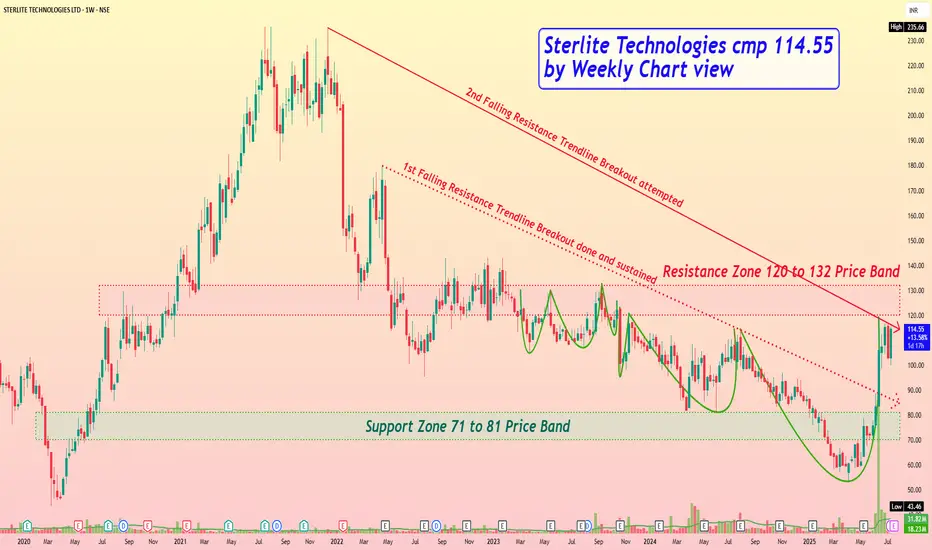
Sterlite Technologies cmp 114.55 by Weekly Chart viewSterlite Technologies cmp 114.55 by Weekly Chart view
- Support Zone 71 to 81 Price Band
- Resistance Zone 120 to 132 Price Band
- 2nd Falling Resistance Trendline Breakout attempted
- 1st Falling Resistance Trendline Breakout done and sustained
- Volumes spiked heavily over past few days by demand based buying
- Repeated Bullish Rounding Bottoms indicate probable Breakout above Resistance Zone neckline
Vascon Engineers cmp 55.70 by Weekly Chart viewVascon Engineers cmp 55.70 by Weekly Chart view
- Support Zone 49.50 to 53.50 Price Band
- Resistance Zone 49.50 to 53.50 Price Band
- Volumes are getting close to average traded quantity
- Common Technical Indicators BB, EMA, SAR, MACD, RSI indicating positive trend
- Multiple Bullish Technical Chart patterns have emerged on the Daily and Weekly Charts
- Rounding Bottom, Head & Shoulders, Cup & Handle, VCP, as one may observe and interpret

Option TradingInvesting Approach by Institutions
✅ Investment Philosophy:
Long-term horizon
Focus on fundamentals (P/E, ROE, growth)
Sector rotation and macro trends
✅ Allocation Strategies:
Strategic Asset Allocation (SAA)
Tactical Asset Allocation (TAA)
Smart Beta and Factor Investing
Trading Strategies by Institutions
🔹 High-Frequency Trading (HFT)
Executes thousands of trades in milliseconds
Relies on arbitrage, price inefficiencies
🔹 Statistical Arbitrage
Mean-reversion strategies using historical patterns
🔹 Swing & Trend Trading
Use technical indicators like MACD, Moving Averages, RSI

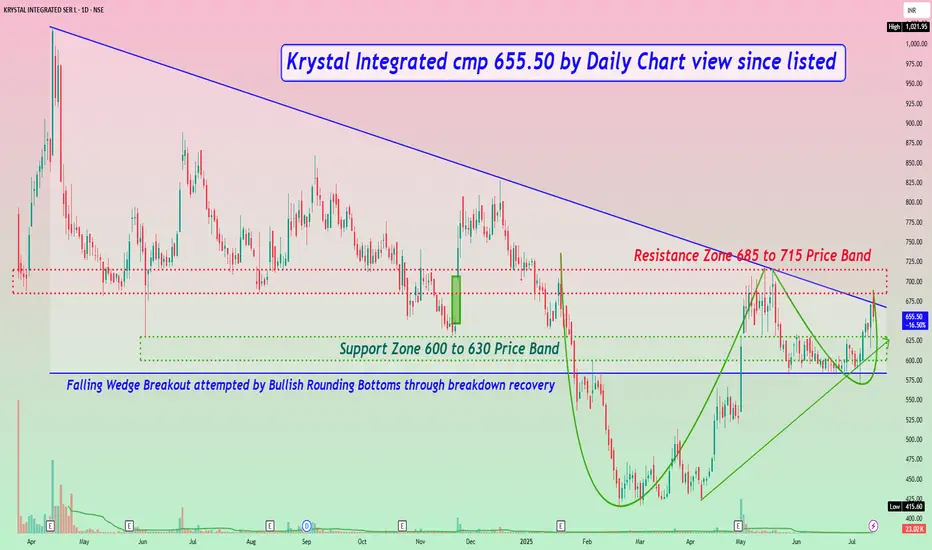
Krystal Integrated cmp 655.50 by Daily Chart view since listedKrystal Integrated cmp 655.50 by Daily Chart view since listed
- Support Zone 600 to 630 Price Band
- Resistance Zone 685 to 715 Price Band
- Support Zone tested, retested and broken out, was resistance earlier
- Volumes are flat, need to increase for the Resistance Zone neckline crossover
- Most common Technical Indicators are seen to be turning out with positive trend
- Rising Support Trendline seems been well respected by the price action momentum
- Falling Wedge Breakout attempted by Bullish Rounding Bottoms through breakdown recovery
NYKAA - Breakout from DTFNYKAA has resistance weakening on the Daily charts and has given a breakout with good volume.
The target of this pattern signals an upside potential of 10% from the current price level in the medium term.
The stock is trading above its 50- and 100-day simple moving averages (SMAs). The range is more than >1.2X, and the Volume is also >2X the average.
CMP- Rs. 108
Target Price- Rs228 ( 10% upside)
SL -202
Disclaimer: This is not a buy/sell recommendation. For educational purpose only. Kindly consult your financial advisor before entering a trade.

Option Trading The stock market is a platform where shares of publicly listed companies are bought and sold. It serves two primary functions: providing companies with capital to grow and giving investors the opportunity to share in the profits of publicly traded companies.
Key Components:
Stocks: Ownership shares in a company.
Stock Exchanges: Platforms like the NYSE, NASDAQ, and BSE where trading occurs.
Indices: Benchmarks like the S&P 500 or Nifty 50 that track the performance of groups of stocks.

Learn Option TradingOption trading is buying and selling contracts that give you the right (but not the obligation) to buy or sell a stock at a specific price before a certain date.
There are two types:
Call Option: You expect the stock price to go up.
Put Option: You expect the stock price to go down.
It’s like booking a movie ticket in advance—you can go if you want, but you don’t have to.

Learn Institutional Option Trading Part-2Option Greeks in India:
Delta: Measures sensitivity to price changes.
Theta: Measures time decay.
Vega: Measures sensitivity to volatility.
Gamma: Measures change in Delta.
Indian traders use these Greeks to manage risk and optimize strategies.
Risks in Indian Option Trading:
Premium Decay: Loss in value as expiry approaches.
High Volatility: Can cause sudden losses.
Liquidity Risk: Some options have low trading volume.
Complexity: Requires deep market knowledge.

RAJRATAN (Rajratan global wire ltd.)RAJRATAN is consolidating, making higher lows and equal highs, above 20-50ema.
Breakout may give a good upside move.
✅ If you like my analysis, please follow me as a token of appreciation :)
in.tradingview.com/u/SatpalS/
📌 For learning and educational purposes only, not a recommendation. Please consult your financial advisor before investing.

Learn Institution Trading What is Institutional Option Trading?
It refers to large-scale option strategies used by hedge funds, banks, and FIIs to manage risk, hedge portfolios, or create directional bets with high precision.
🔹 Key Institutional Strategies:
Buy-Write (Covered Call):
Holding stocks and selling calls to earn premium.
Protective Put:
Buying puts as insurance to hedge stock positions.
Multi-leg Spreads (Iron Condor, Butterfly):
Neutral strategies to profit from range-bound markets.
Put-Call Ratio Analysis (PCR):
Gauging market sentiment from institutional flow.

Advanced Institutions Option Trading - Part 5Institutional Tools & Platforms
Bloomberg Terminal / Reuters Eikon: Institutional-grade data
FIX Protocols: For high-frequency option order routing
Quant Models: Statistical arbitrage using Python/R
Option Analytics Engines: Measure IV Skew, Smile, Surface modeling
Institutions don’t just trade options—they engineer risk-managed portfolios using AI and predictive analytics.
Option Chain Analysis for Traders
Option Chain provides a list of all available option contracts for a stock/index.
Key Elements:
Strike Prices
Call & Put Prices
Open Interest (OI)
Volume
Implied Volatility (IV)
Change in OI
Interpretation:
High OI + Rising Price = Strong Trend
IV Surge = High Volatility Expectation
PCR (Put-Call Ratio) = Market Sentiment Indicator
PCR > 1: Bearish sentiment
PCR < 1: Bullish sentiment

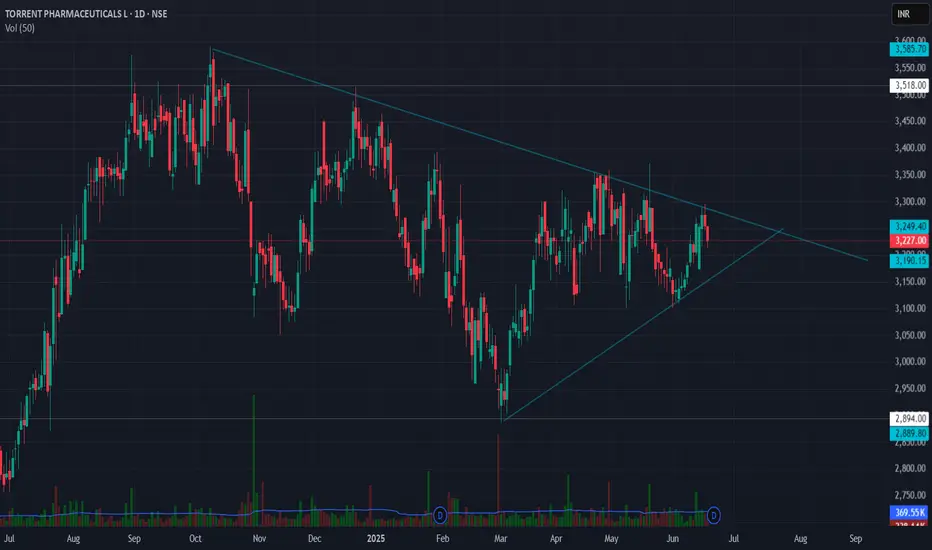
Symmetrical Triangle pattern in Torrent Pharma Symmetrical Triangle Breakout Setup
Torrent Pharmaceuticals Ltd (TORNTPHARM)
Breakout Level: ₹3,300
Stop Loss: ₹3,150 (below triangle support)
Target: ₹4,000 (based on height of triangle)
Risk:Reward: ~2.8:1
✅ Technical Confirmation:
RSI near 52 — momentum shifting bullish above 55.
MACD positive crossover, rising histogram — trend strength improving.
Volume: Awaiting breakout candle with above-average volume for confirmation.
EFI (Elder Force Index) turning positive — signals potential surge in buying force.
📌 Strategy Insight:
A breakout above ₹3,300, backed by volume and momentum, could lead to a sharp trend continuation toward ₹4,000. The symmetrical triangle represents consolidation after trend — a potential bullish continuation pattern.
EUR/GBP 4H Bullish Breakout Trade Setup – Demand Zone to 0.85250📉 Trendline Break
🔵 A key trendline was broken 🔽 (bearish ➡️ bullish shift).
✂️ This break signals potential upside movement as sellers lose control.
🟦 Demand Zone (BUY Area)
📍 Zone: 0.83967 – 0.84249
🛒 Buyers expected here!
🟢 Price may pull back here before heading up.
🟡 This is marked as the ENTRY POINT zone.
🔴 Stop Loss Zone
📍 Level: 0.83977
❌ Place stop loss just below the demand zone.
🛡️ Protects against downside breakout risk.
🟧 Resistance Zone
📍 Around: 0.84500 – 0.84600
⚠️ Price may face resistance temporarily before continuing the upward move.
📏 Testing this area confirms strength.
🟩 Target Zone
🎯 Target Point: 0.85250
💸 If the trade plays out, this is where profit is expected.
🚀 Bullish target above the resistance zone.
✅ Trade Setup Summary
🧩 Details
🟦 Entry 0.84240 (inside demand zone)
🔴 Stop Loss 0.83977 (below demand zone)
🟩 Target 0.85250 (above resistance)
📈 R/R Ratio ~1:4 (great risk/reward!)
🔍 Final Outlook:
🟠 Watch for: Pullback to entry zone
🟢 Then look for: Bullish candlestick confirmation
🚀 Goal: Ride it up to 0.85250 with strong momentum
