BTC/USD 4H Trade Setup – Demand Zone Reversal Play🔵 1. Demand Zone 🧲💎
📍 Range: 100,418.83 – 102,253.51
🟦 Strong support zone
💡 This is where buyers are expected to step in
📉 Price is currently testing this zone — potential reversal area
🚀 2. Entry Point 🎯
📍 Zone: 102,232.52 – 102,264.33
✅ Just above demand zone for safe entry
🧘♂️ Wait for bullish confirmation (wick rejections, engulfing candles)
🛑 3. Stop Loss 🔻
📍 Zone: 100,498.77 – 100,538.74
🔒 Below demand zone — protects you from false breakouts
⛔ Invalidates setup if price breaks below this level
🎯 4. Target Point 💰
📍 Target: 108,800.00
🧱 Major resistance zone
📈 Offers a solid Risk/Reward setup (approx. 1:4)
🪜 Possible take-profit scaling around 108,656.78 – 109,256.50
🔁 5. CHoCH – Change of Character 🔄
📍 Confirmed structural break above a lower high
🕵️♂️ Indicates shift from bearish to bullish
🔁 Needs confirmation with higher low near demand zone
📏 6. EMA 70 (Exponential Moving Average) 📉
📍 Level: 106,849.30
🔴 Price is currently below EMA = short-term bearish
🧗♂️ Reclaiming the EMA will strengthen the bullish bias
✅ Quick Summary with Emojis
📌 Plan:
🔵 Buy near: 102,250
🛑 Stop Loss: 100,500
🎯 Take Profit: 108,800
📊 Trend:
🔻 Bearish short-term (below EMA)
🔁 Potential reversal from demand zone
⚠️ Watch For:
🔍 Bullish confirmation at demand zone
🔄 Reclaim of EMA (106.8k)
🧱 Resistance near 108.8k
Technicalindicators

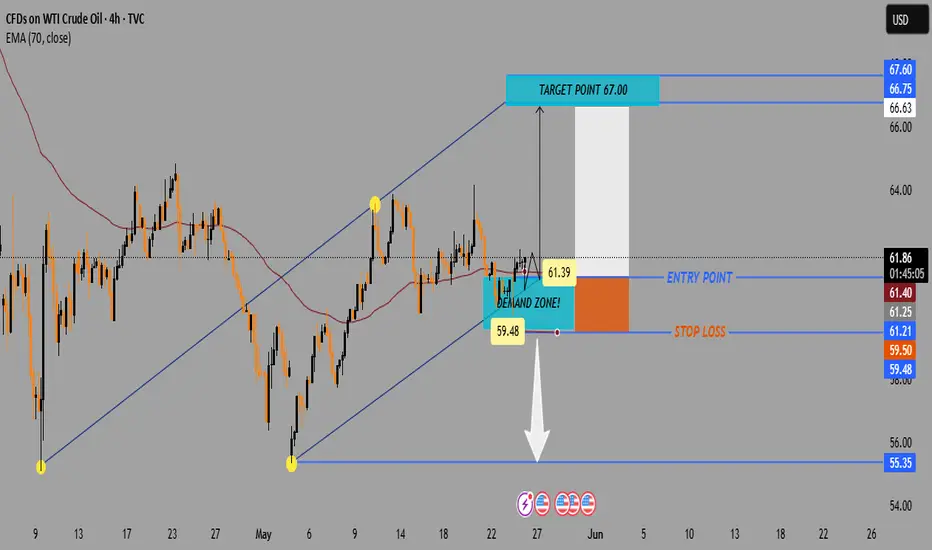
WTI Crude Oil 4H Chart – Bullish Setup from Demand Zone📈 Current Price: $61.74
🔵 Key Zones & Levels
🔹 Demand Zone (Buy Area):
🟦 $59.48 – $61.39
→ Price expected to bounce here
→ 🔄 Potential reversal zone
🔹 Entry Point:
🎯 $61.39
→ Ideal level to enter LONG
→ Just above demand zone
🔹 Stop Loss:
🛑 Below $59.48
→ Exit if price drops here
→ Protects capital
🔹 Target Point:
🚀 $67.00
→ Profit-taking zone
→ Strong resistance zone nearby:
* 66.63
* 66.75
* 67.60
📊 Indicators
📍 EMA (70): 🔴 61.40
→ Price trading above = bullish signal
→ EMA acting as support
📏 Trendline Channel:
🔼 Higher highs & higher lows
→ Supports uptrend continuation
📌 Trade Plan Summary
* Bias: 📈 Bullish
* Buy: At 61.39
* Stop: Below 59.48 🛑
* Target: 67.00 🎯
* Risk-Reward: ✔️ Favorable (~1:3)
🔍 What to Watch
* ✅ Bullish candles in demand zone
* 🔁 Retest of EMA or lower channel
* ❌ Avoid if it breaks below $59.48
Bitcoin (BTC/USD) 1H Chart Analysis – Double Top Signals BearishPattern Formed: DOUBLE TOP
⚠️ Bearish Reversal Pattern Spotted!
📍 Formed near 111,794.8
⬆️ Price tested the top twice and failed – strong resistance confirmed!
Key Zones:
🔶 SUPPLY ZONE (Resistance):
🟧 111,794.8 - 111,829.8
🔼 Expect selling pressure here!
🔷 SUPPORT Zone (Broken!):
🔻 Price fell below this level, confirming a bearish breakout
🟩 TARGET ZONE:
🎯 102,500.0
✅ This is the likely drop target based on the pattern
🧊 Other minor supports:
* 102,820.6
* 102,750.8
* 102,227.0.
Indicators:
📈 Trend Line
* Supported the price during the uptrend
* ❌ Now broken — indicates momentum shift
📉 EMA 70 (Red Line)
* Current Price (108,238.6) is below EMA 70 = 109,245.0
* Indicates bearish pressure.
Trade Setup:
🔽 Short Entry Idea: After support break
🛑 Stop Loss: 111,829.8
🎯 Take Profit: 102,500.0
⚖️ Risk-Reward looks attractive!
Summary:
📉 Bearish bias confirmed by:
* Double Top pattern
* Supply zone rejection
* Support break
* EMA crossover
🚨 Traders Watch Out: Bears are in control — next major stop likely at 102,500.0!

Silver (XAG/USD) Bullish Breakout Setup – 4H Chart Analysis📈 Bullish Setup
Key Zones & Levels:
🔵 Current Price: 33.48
🟣 EMA 70 (Support): 32.83
🔻 Acting as dynamic support
🟦 Demand Zone:
📍 32.54 - 32.83
🟢 Strong buying interest expected here
🟥 Resistance Zone:
📍 Around 33.48 - 33.60
⚠️ Breakout above this zone could trigger buying momentum
Trade Setup:
🚀 Entry Point:
🔵 33.11 - 33.12
🛑 Stop Loss:
🔻 32.54 (Just below demand zone and EMA)
🎯 Target (Take Profit):
🎯 35.50
✨ Potential gain if breakout confirms
Price Path Projection:
🔹 Scenario 1: Bounce from demand zone → Break resistance → Hit target
🟢➡️📈➡️🎯
🔸 Scenario 2: Immediate breakout above resistance
📈⚡➡️🎯
Summary:
Trend: Bullish
EMA and trendline support price
Risk/Reward is favorable
Watch for confirmation before entry

EUR/AUD Bullish Channel Trade Setup –Demand Zone Bounce Strategy📉 1. Downtrend Ends
🔽 Price was falling earlier (left side of chart)
🔄 Then it reversed at the bottom of the channel (yellow dot)
➡️ Trend Change Begins
📈 2. Uptrend Channel Forms
📊 Channel consists of:
🔵 Resistance Line (upper blue)
🟢 Support Line (lower blue)
🔁 Price is bouncing between these two lines like a pinball:
🔵 Resistance Line
| 🔼
🟢 Support Line
💠 3. Key Trading Zone
🔷 DEMAND ZONE: (Bright blue box)
🟦 Between 1.74697 and 1.75349
👉 Buyer interest expected here
🎯 4. Trade Setup (Bullish Idea)
🟢 Entry Point:
📍 1.75349
✨ Near support zone and channel bottom
🔻 Stop Loss:
🚫 1.74710
📉 Below the demand zone, protects from downside
🎯 Target Point:
🎯 1.77800
📈 Near the resistance line at the top of the channel
📊 Strategy Flow (Emoji Dots Path)
📉 🔽 🔽 🔽
🟡 Bottom found
⬆️ 🔼 🔼 🔼
📈 Enters channel
🟦 Price enters DEMAND ZONE
🔽
🔵 Entry: 1.75349
🔼
🎯 Target: 1.77800
✅ Final Thoughts
This is a clean bullish setup within a rising channel
✅ Wait for price action confirmation (like a bullish candle 🕯️) in the demand zone
🔒 Protect with your stop loss
🚀 Potential reward is strong if it bounces up

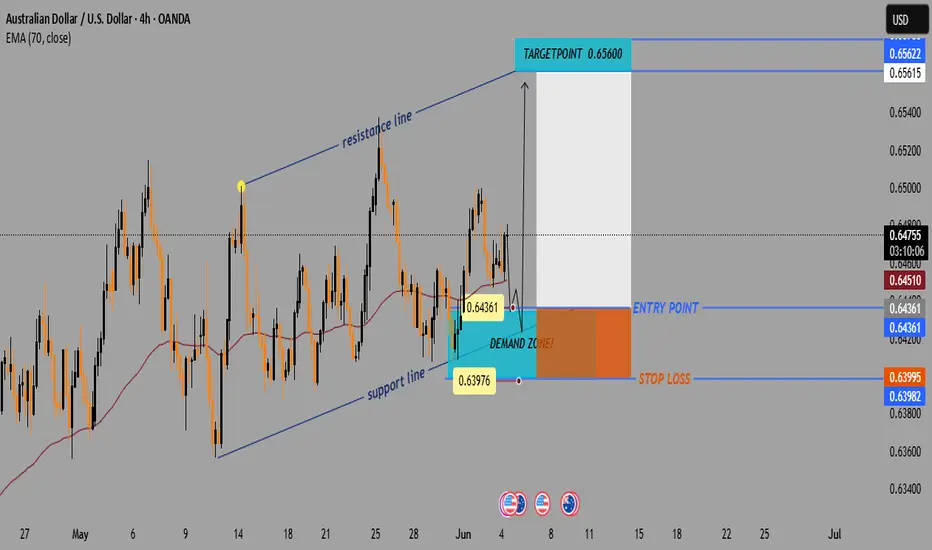
AUD/USD Bullish Setup: Demand Zone Bounce Toward 0.65600📈 Price Channel Analysis
🔼 The pair is moving within an ascending channel: • Support Line 🟦 – lower trendline showing bullish structure
* Resistance Line 🟥 – upper boundary acting as potential target
💡 This suggests bullish momentum is intact unless the price breaks below support.
📌 Key Trade Levels
🔵 Entry Point: 0.64361
* 👇 Positioned just above the DEMAND ZONE
* 📍Near the 70 EMA — a key dynamic support
🟨 Demand Zone: Area between 0.6400 – 0.6436
* 🧲 Buyers are expected here
* Good spot for a bullish entry
🔴 Stop Loss: 0.63995
* 🚨 Below the demand zone = limited risk
🟢 Target Point: 0.65600
* 🎯 Aligned with the upper resistance line
* Nice upside potential
⚙️ Technical Indicator
📉 EMA 70 (red line) = 0.64510
* Price is bouncing near it
* 📊 Acts as trend support — confirming buy idea
📊 Risk-to-Reward Ratio
🔻 Risk: ~36 pips (Entry → Stop Loss)
🔺 Reward: ~124 pips (Entry → Target)
✅ R:R Ratio ≈ 3.4:1 👍
🧠 Trade Idea Summary
📘 Trade Type 🔼 Buy (Long)
💰 Entry 0.64361
🛑 Stop Loss 0.63995
🎯 Target 0.65600
🌟 Bias Bullish
🔍 Final Thoughts
✅ Strong setup within a bullish channel
📉 EMA support + 🟦 Demand zone = Good confluence
📅 Watch out for USD news (see icons below chart)
Gold (XAU/USD) – Inverse Head & Shoulders Breakout Setup🧠 Chart Pattern Identified: Inverse Head & Shoulders
🟡 Left Shoulder ➡️ Formed at a local dip.
⚫ Head ⬇️ Deepest low around 3,274.103.
🟡 Right Shoulder ➡️ Bouncing near the same zone.
🔁 This is a classic bullish reversal pattern — a break above the neckline could signal a strong upside move.
📊 Key Levels & Zones
🔵 Support Zone:
🟦 Area: 3,274 – 3,294
✅ Strong bounce seen here (highlighted by the head and shoulders base)
🔵 Resistance Zone:
📏 Just below 3,305 (marked as neckline)
✋ Price must break this to confirm the reversal
🔵 Target Point:
🎯 3360 📈
📏 Based on the height from head to neckline
🔵 Stop Loss Zone:
❌ 3,274.526
🔻 Below the head for safe risk control
⚙️ Trading Setup Summary
🔹 📍 Entry Point:
📌 Around 3,294.449
🚪 Enter on breakout above neckline
🔹 🎯 Target Point:
🏁 3360
🔹 🛑 Stop Loss:
🚫 3,274.526
🔹 Risk-Reward Setup:
🔍 Targeting a move of ~65 points
⚖️ Risk of ~20 points → solid R/R ratio
📈 Indicator:
🧮 EMA 70 ➡️ 3,305.005
⏳ Price currently testing it — a break above EMA would boost bullish confirmation.
📅 Economic Events:
📆 Multiple event icons suggest upcoming news — expect volatility!
⚠️ Be cautious during these times.
✅ Final Thoughts:
📊 Pattern suggests a bullish breakout is near 🚀
🔒 Use stop-loss and enter after breakout to manage risk effectively
🎯 Keep an eye on volume during breakout — it confirms strength

EUR/USD4H Bearish Trade Setup Supply Zone Rejection with 3:1 RRR🔷 Trend Overview
📈 Price was in a rising channel (trend line + support line).
❌ Channel broken on downside → potential trend reversal.
🟧 🔼 Supply Zone (Sell Area)
📍 Zone: 1.13707 – 1.14432
🟠 Price faced rejection here.
💡 Institutional selling likely in this zone.
🔥 This is the ideal short-entry area.
🟦 🔽 Entry Point
🎯 Entry: Around 1.13694
🧩 Sits just below supply zone = safer trigger.
✅ Wait for a bearish confirmation candle before entering.
🟨 Support Level
📉 Support Zone: ~1.13100 – 1.13400
📊 Recently broken with a strong bearish candle.
🧱 Used to act as a floor, now may act as resistance.
🟩 🎯 Target Point
✅ Take Profit: 1.10970
📎 Matches previous structure support.
💰 Lock in profits before the psychological level at 1.1100.
🟥 ⛔ Stop Loss
❌ Stop: 1.14419
📏 Placed above the supply zone for protection.
🛡️ Shields from false breakouts or spikes.
⚖️ Risk-to-Reward Ratio (RRR)
💡 Approx. 3:1 ✅
📉 Risk: ~70 pips
📈 Reward: ~270 pips
🔥 High-probability setup
📌 EMA (Exponential Moving Average – 70)
📍 EMA 70 at 1.13102
🔻 Price is below the EMA → favors bearish momentum
🧠 Pro Tips:
🔍 Watch for bearish engulfing or rejection candles at the entry zone.
🗓️ Be aware of major news events (ECB, Fed).
🧮 Adjust lot size for risk management (based on SL size).
✅ Summary:
🧩 Element 📊 Value
Trade Type 🔻 Short (Sell)
Entry Point 📌 1.13694
Stop Loss ⛔ 1.14419
Take Profit 🎯 1.10970
RRR ⚖️ ~3:1
Sentiment 📉 Bearish

JKLAKSHMI CEMENT - Bullish Inverted H&S Breakout (Daily T/F)Trade Setup
📌 Stock: JK Lakshmi Cement ( NSE:JKLAKSHMI )
📌 Trend: Strong Bullish Momentum
📌 Risk-Reward Ratio: 1:3 (Favorable)
🎯 Entry Zone: ₹862 (Breakout Confirmation)
🛑 Stop Loss: ₹807 (Daily Closing Basis) (~6.4% Risk)
🎯 Target Levels:
₹899.60
₹938.85
₹979.80
₹1,022.50 (Final Target)
Technical Rationale
✅ Bullish Inverted H&S Breakout - Classic reversal pattern confirming uptrend continuation
✅ Strong Momentum - Daily & Weekly RSI >60 (Bullish zone)
✅ Volume Confirmation - Breakout volume 376K vs previous day's 193K (Nearly 2x surge)
✅ Multi-Timeframe Alignment - Daily and weekly charts showing strength
Key Observations
• The breakout comes with significantly higher volume, validating strength
• Well-defined pattern with clear neckline breakout
• Conservative stop loss at recent swing low
Trade Management Strategy
• Consider partial profit booking at each target level
• Move stop loss to breakeven after Target 1 is achieved
• Trail stop loss to protect profits as price progresses
Disclaimer ⚠️
This analysis is strictly for educational purposes and should not be construed as financial advice. Trading in equities involves substantial risk of capital loss. Past performance is not indicative of future results. Always conduct your own research, consider your risk appetite, and consult a financial advisor before making any investment decisions. The author assumes no responsibility for any trading outcomes based on this information.
What do you think? Are you watching NSE:JKLAKSHMI for this breakout opportunity? Share your views in the comments!

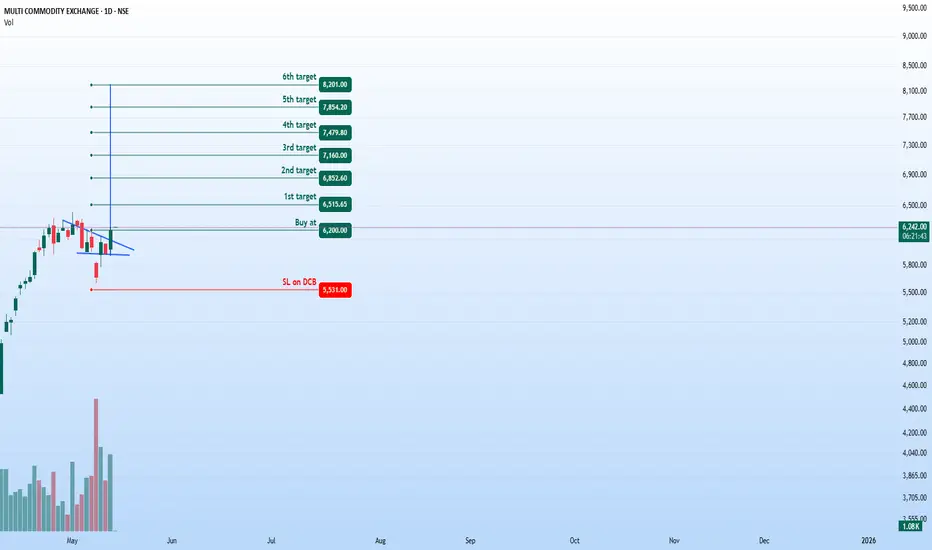
MCX - Bullish Breakout Opportunity (Daily Timeframe)Stock: MCX ( NSE:MCX )
Trend: Bullish Momentum Building 🚀
Risk-Reward Ratio: 1:3 (Favorable Setup)
Trade Parameters
🎯 Entry Zone: ₹6,200 (Breakout Confirmation)
🛑 Stop Loss: ₹5,531 (Daily Closing Basis) (~10.8% Risk)
🎯 Target Levels:
₹6,515.65
₹6,852.60
₹7,160.00
₹7,479.80
₹7,854.20
₹8,200 (Final Target)
Technical Rationale
✅ Bullish Flag Breakout - Price has broken out from consolidation pattern
✅ Strong Momentum - Daily & Weekly RSI >60 (Bullish territory)
✅ Volume Confirmation - Breakout volume 868K vs previous day's 571K (~52% increase)
✅ Technical Structure - Higher highs and higher lows formation
Key Observations
• The breakout comes with significantly higher volume
• Multiple targets allow for progressive profit booking
• Attractive 1:3 risk-reward ratio
• Strong technical structure supporting bullish case
Trade Management Strategy
• Consider partial profit booking at each target level
• Move stop loss to breakeven after Target 1 is achieved
• Trail stop loss to protect profits as price progresses
• Watch for volume confirmation on upside moves
Disclaimer ⚠️
This analysis is strictly for educational purposes and should not be construed as investment advice. Trading in financial markets involves substantial risk and is not suitable for all investors. Past performance is not indicative of future results. Always conduct your own thorough research and consult with a qualified financial advisor before making any investment decisions. The author assumes no responsibility for any trading losses that may occur from using this information.
What do you think? Are you watching this breakout on NSE:MCX ? Share your views in the comments!
GBP/JPY 4H Chart Analysis – Bullish Channel Setup📈 Trend:
Price is moving in an ascending channel
🔵 Support line below
🔴 Resistance line above
---
Key Zones & Levels:
📍 Demand Zone (Buy Area):
Between 191.753 – 194.016
Price might bounce here before continuing up
🔵 Likely pullback expected here
🎯 Target Point:
202.500
🚀 If price respects the demand zone, this is the upside target
🟢 Entry Point:
Around 193.964 – 194.016
Optimal buying zone before the projected rise
❌ Stop Loss:
Below 191.700
🛑 Placed to minimize losses if price breaks down
---
Indicators:
📉 EMA (70):
Currently at 192.816
✅ Acting as dynamic support
---
Trade Plan Summary:
🔄 Wait for a retracement into the Demand Zone
🛒 Enter long near 193.964
⛔ Stop loss at 191.700
🎯 Target at 202.500

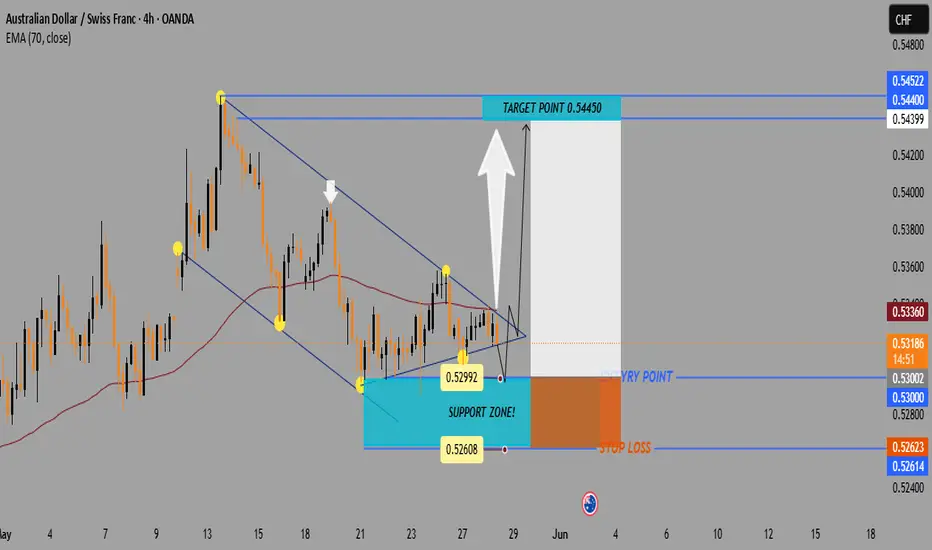
AUD/CHF Breakout Alert: Bullish Setup from Descending Wedge!🔻 Pattern: Descending Wedge
📐 Formed by lower highs and higher lows.
🟡 Indicates price compression — often a bullish breakout setup!
🔼 Breakout direction expected: UP
🟦 Support Zone
📍 Located around 0.52614 – 0.53000
📉 Price bounced multiple times here — strong buying interest
🛡️ Acts as a demand zone
🟢 Entry Point
🎯 Entry range: 0.53000 – 0.53188
💥 Breakout candle appears ready to close outside the wedge
⚡ Momentum may be building for a push higher
🎯 Target Point
🔵 Target: 0.54450
📈 Near recent highs — aligns with pattern breakout projection
🎉 Aiming for a good profit zone
🔴 Stop Loss
❌ Stop loss: 0.52623
🛑 Below the wedge and support — protects from a false breakout
⚖️ Keeps risk-reward ratio attractive
📊 Indicator
🧭 EMA 70 (Red Line) at 0.53360
🔄 Price hovering near it — crossing above = bullish signal
📌 Trade Setup Summary
🔸 Pair: AUD/CHF
🔸 Timeframe: 4-Hour (4H)
🔸 Pattern: Descending Wedge
🔸 Bias: Bullish
🔸 Entry: 0.53000 – 0.53188
🔸 Target: 0.54450 🟢
🔸 Stop Loss: 0.52623 🔴
✅ Conclusion
🚀 If price breaks above the wedge and EMA, this could be a high-probability long trade.
📏 Tight stop, wide target = good risk/reward setup!
EUR/CAD Bearish Setup – Supply Zone Reversal Trade Plan"Trend:
⬆️ Uptrend (past) → 🔄 CHoCH (Change of Character) → ⬇️ Potential Downtrend
1. Pattern Formed:
📐 Rising Wedge → Bearish Reversal Pattern
➡️ Price broke structure at the bottom = CHoCH ⚠️
2. Supply Zone:
🟧 Supply Zone = 1.56580 - 1.56602
🔄 Price may pull back here before dropping
📍This is your ENTRY ZONE
3. Trade Setup:
🔵 Entry Point:
* 1.56580 (Inside Supply Zone)
❌ Stop Loss:
* 1.57176
* Just above swing high & supply zone 🛑
✅ Take Profit Target:
* 1.54370
* Strong previous support zone 💰
4. Indicators:
📉 EMA (47) = Acting as resistance
* Price is currently below EMA ➡️ Bearish signal
TRADE PLAN OVERVIEW:
* 🎯 Entry: 1.56580
* ⛔ Stop Loss: 1.57176
* 💸 Take Profit: 1.54370
* ⚖️ Risk/Reward Ratio: 1:3 (Great!)
Summary:
* Wait for rejection or bearish candle in supply zone
* Enter short
* Ride it down to the target
* Manage risk smartly ✅

NZD/USD 4HChart Analysis:Bullish Reversal Setup from Demand Zone📈 Price: 0.59552
📊 EMA 70: 0.59410 (🟤 Brown Line)
Chart Zones & Key Levels
🔷 Resistance Zone:
🔼 Around 0.60298 – 0.60304
🔹 Price reacted strongly here (🔽 white arrows)
🔹 Acts as a ceiling for now
🟢 Demand Zone:
🔽 Around 0.58800
✅ Buyers stepped in here before
📉 If price drops again, might bounce from here
🟥 STOP LOSS:
❗ 0.58793
🔸 Protects from deeper losses if trend breaks down.
TRADE IDEA
1️⃣ Entry Idea: Wait for a pullback into the Demand Zone
📉⬇️
2️⃣ Bullish Reversal Expected:
⬆️ Bounce toward Target Zone
🎯 Target Point: 0.60300
🟦 Profit zone marked in blue
💸 Good Risk/Reward ratio.
Indicators & Pattern
📐 Wedge Pattern:
🔹 Bullish breakout potential
🔹 Currently respecting the channel
📉 EMA Crossover Area:
🔸 Could act as dynamic support/resistance
🟤 Price hovering around EMA (0.59410)
Summary:
✅ Buy Setup if price holds above 0.58800
🎯 Target: 0.60300
🛑 Stop Loss: 0.58793
⚠️ Watch the price reaction at the Demand Zone for confirmation!

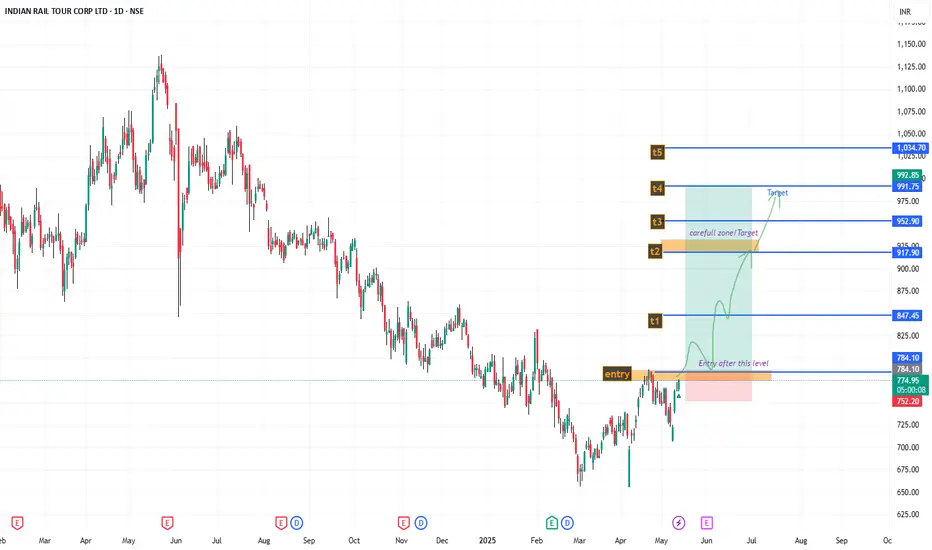
IRCTC , Looking good ; min 25% Roi ; swing For short term investment ;
Leave a " Like If you agree ".👍
.
Wait for small retracement & daily candle to close above - "785".
Trade carefully untill ENTRY level.
.
Entry: 785
Target: 850-917-991
sl: 745
major stoploss/ support: 700.
.
Enter only if market Breaks
"Yellow box" mentioned.
.
.
Don't make complicated trade set-up.📈📉
Keep it " simple, focus on consistency "💹
Refer our old ideas for accuracy rate🧑💻
Follow for daily updates👍
.
Refer old posted idea attached below.
Banknifty 2025-2026 (Expected level)Banknifty. (Only for Experienced traders" )
Enter after " Breakout and Retracement ".
Leave a " Like If you agree ".✌.
Follow for regular updates 👍
.
For " long "
entry: 56000 / 56500
target: 60000- 62350
stoploss: 54800
Enter only if market Breaks
"Yellow box" mentioned.
.
.
For " Short"
entry: 54000
target:51000- 49500
stoploss: 54600
Enter only if market Breaks
"Yellow box" mentioned.
.
Wait for proper reversal and conformation.
.
Don't make complicated trade set-up.📈📉
Keep it " Simple, Focus on Consistency "💹.
Refer our old ideas for accuracy rate🧑💻.
Valuable comments are welcomed-✌️
.
.
Disclaimer:
Our Trading style is not to capture "10-20" points per trade.📊
We take entry only for min "200-300" points without any distractions.💹
So, our ideas may not be preferable for small traders, who just focusing on too much of support and resistance.📈📉📈
So, please consider others ideas.
This is for educational purposes.🧑💻

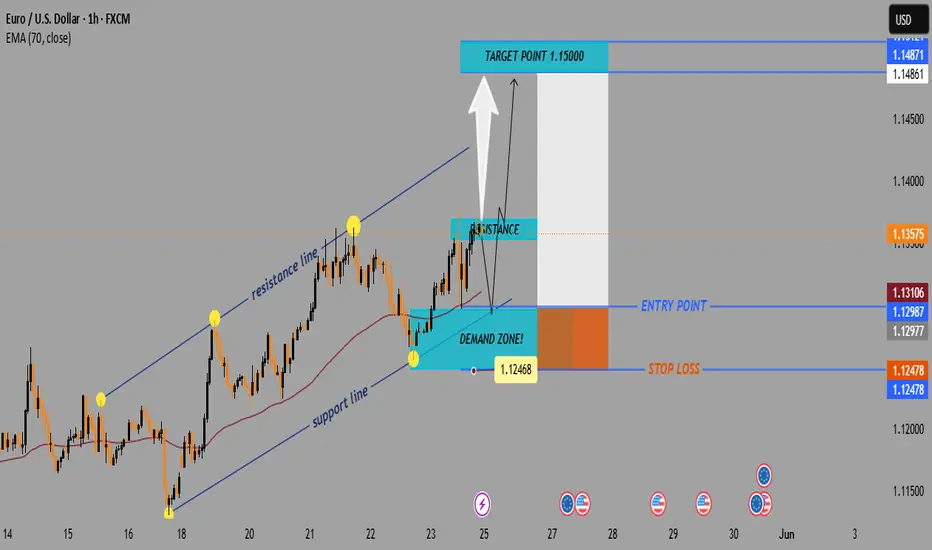
EUR/USD Bullish Trade Setup – Demand Zone to 1.15000 TargetTrend Overview:
↗️ Uptrend Channel
Support Line (Bottom of channel): Holding the upward price movement.
Resistance Line (Top of channel): Price touches and retraces — a key watch level.
Key Zones:
🟦 Demand Zone (BUY Area)
🟢 1.12468 – 1.12987
Strong support.
Price may bounce from here if retested.
Buyers likely to activate here.
🟥 Resistance Zone
🔴 Around 1.13575
Price faces selling pressure.
If broken, could signal a bullish continuation.
Entry & Exit Strategy:
🎯 Target Point: 1.15000 (Marked in blue above)
🚀 Bullish Target
Above the resistance, indicating breakout potential.
📍 Entry Point: 1.12987 – 1.13106
Slightly above the demand zone.
🛑 Stop Loss: 1.12478
Just below the demand zone for risk control.
EMA (70) Line:
📈 Currently at 1.13106
Price is trading above the EMA = bullish signal.
Scenario Summary:
Bullish Setup
✅ Wait for a pullback into the demand zone
✅ Enter near the blue entry area
✅ Target the 1.15000 zone
✅ Risk managed by stop-loss just below demand zone
Confidence Petrol ltd., Looking good ; min 50% Roi ; swingFor short term investment ;
Leave a " Like If you agree " .👍
.
Wait for small retracement & daily candle to close above - "57.50" .
Trade carefully untill ENTRY level.
.
Entry: 57.5
Target: 61-66-73-81
sl: 53
major stoploss/ support: 44.5.
.
Enter only if market Breaks and retrace and support above
"Yellow box" mentioned.
.
.
Don't make complicated trade set-up.📈📉
Keep it " simple, focus on consistency "💹
Refer our old ideas for accuracy rate🧑💻
Follow for daily updates👍
.
Refer old posted idea attached below.

WTI Crude Oil Bullish Breakout Setup – Targeting $65.80Chart Breakdown:
1. Trend Structure
📈 Uptrend Channel
Price is respecting a rising trendline.
Multiple touches (🟡 dots) confirm the trend is valid.
Higher highs and higher lows indicate bullish pressure.
2. Key Zones
🟦 Demand Zone: $62.19 – $62.36
Strong support area!
EMA 70 (📉 line) sits right in this zone – great confluence!
Likely bounce area.
🟥 Resistance Zone: (Broken!)
Price broke above the resistance – bullish signal!
Now acting as support (role reversal).
🎯 Target Point: $65.80
Located near key resistance area.
🎯 Take profit zone!
Trade Setup
🔹 Entry Point: $62.45
🔸 Stop Loss: $61.43 (below demand & EMA)
🎯 Target: $65.80
✅ Risk/Reward: ~3.3:1
Great reward potential compared to risk!
Indicators
📏 EMA 70: $62.19
Below price → supports bullish move.
Visual Summary:
🔵 Demand Zone
🔺 Entry Point
🟥 Stop Loss
🎯 Target Zone
🟡 Confirmed Trend Points
📈 Breakout Above Resistance

DXY Bearish Setup: Sell from Supply Zone to 99.100 TargetTrend: 📉 Bearish Bias
Key Zones & Strategy:
🔶 Supply Zone (Sell Area)
📍 100.584 – 100.906
⚠️ Price may face selling pressure here
🔵 Entry Point:
🎯 100.584 (bottom of supply zone)
🔴 Stop Loss:
❌ 100.906 (just above resistance)
🟢 Target Point:
✅ 99.100
📉 Aligned with lower support line
Technical Indicators:
📏 Descending Channel
🔽 Price moving within parallel downward trend lines
📊 EMA (70) – Orange Line
🔁 Acting as dynamic resistance
Trade Setup Summary:
📌 Sell in the Supply Zone
🛑 Stop Loss: 100.906
🎯 Target: 99.100
⚖️ Good Risk-Reward Ratio
Warnings & Tips:
⚡ Watch for Breakouts:
If price breaks above 100.906 ➡️ 📈 Bearish idea invalid
📰 Check News Events:
FOMC, CPI, or other USD events may cause volatility

Bitcoin Short Setup –Supply Zone Rejection Trade Plan (1H Chart)(BTC/USD – Technical Setup)
🔵 Trend Setup:
⬆️ Resistance Line – Price is struggling to break above this level.
⬇️ Support Line – Price bounced several times here before breaking down.
🟢 EMA 70 – Currently around 104,435.9, acting as dynamic support/resistance.
📍 Key Levels:
🔴 Stop Loss Zone:
107,488.4 to 107,402.4
(🚨 Strong resistance, limit losses!)
🟡 Entry Point:
106,026.8
(🟨 Inside the Supply Zone – Ideal for Sell)
🟦 Supply Zone:
106,026.8 to 107,402.4
(⚠️ High selling pressure expected here!)
🔵 Break of Structure (BOS):
Price broke below the rising support line
(📉 Bearish confirmation!)
🎯 Target Point:
99,000.0
(💰 Take Profit Target!)
🔻 Trade Idea:
SELL at 106,026.8
🛑 Stop Loss: 107,488.4
✅ Target: 99,000.0
Risk-Reward looks solid.
This is a short setup expecting a drop after a retest of the supply zone.

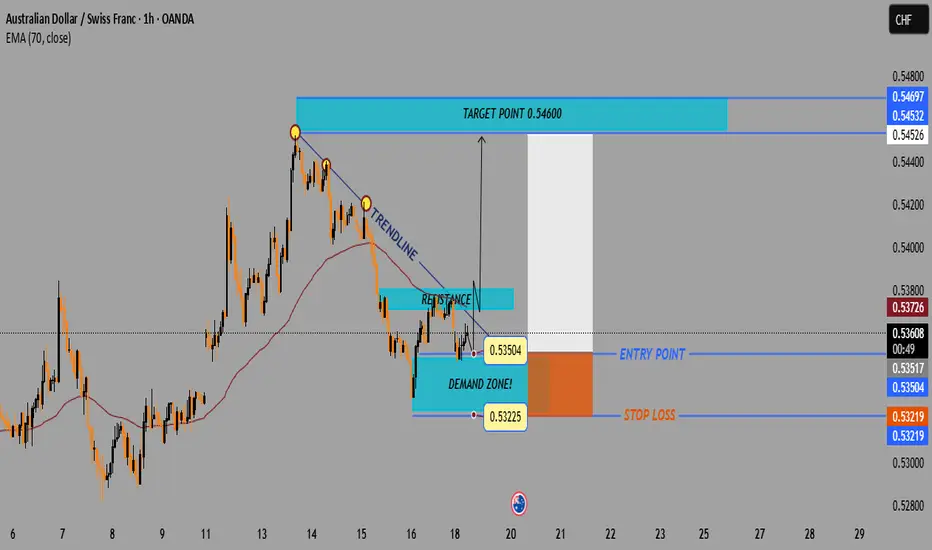
AUD/CHF Bullish Breakout Setup – Demand Zone to Target 0.546001. Setup Overview
📈 Trade Type: Long (Buy)
📊 Chart Pattern: Trendline Breakout
📏 Indicator Used: EMA (70) — 🔴 0.53726
2. Key Price Levels
🔵 Demand Zone:
* 0.53225 – 0.53504
* Strong buying interest seen here
⬆️ Entry Point:
* Around 0.53517 – 0.53630
* Price is breaking above resistance and trendline
🛑 Stop Loss:
* Below 0.53219
* Protects against false breakout
🎯 Target Point:
* Primary TP: 0.54600
* Extended TP: 0.54697
* Previous supply/resistance zone
3. Structure Breakdown
📉 Trendline:
* Downward sloping trendline has been tested
* Price looks to be breaking out
📌 Resistance Turned Support:
* Break above 0.53500 confirms bullish momentum
📊 EMA (70):
* Current price is slightly below EMA
* Bullish confirmation if price closes above it
4. Risk-to-Reward
⚖️ R:R Ratio: Approximately 1:3
* Small stop loss for a much larger upside
Gic Housing Fin co., Looking good ; min 65 % Roi ; swingAdd this to watchlist and wait for entry.👁️🗨️
For short term investment ;
Leave a " Like If you agree ".👍
.
Wait for small retracement & daily candle to close above - "185".
Trade carefully untill ENTRY level.
.
Entry: 185 / 175
target:201-226-262-300-321
sl:167
major stoploss/ support: 160
.
.
Enter only if market Sustains above
"Yellow box" mentioned.
.
.
Don't make complicated trade set-up.📈📉
Keep it " simple, focus on consistency "💹
Refer our old ideas for accuracy rate🧑💻
Follow for daily updates👍
.
Refer old posted idea attached below.
