XAUUSD | FED leaning toward 50bps cut? | Buy strategy at support🟡 XAU/USD – 12/09 | Captain Vincent ⚓
🔎 Captain’s Log – Market Context
The probability of a FED -50bps cut next week has risen to 10.9% (from 8%), while a -25bps scenario is almost certain.
US jobless claims rose sharply → reflecting a weakening labor market, reinforcing expectations of FED easing.
Tonight (21:00): release of Consumer Sentiment & 1Y–5Y Inflation Outlook (University of Michigan) – data that could further impact the Dollar.
⏩ Captain’s Summary: Dollar weakness + falling bond yields = Gold remains supported to rise. However, short-term pullbacks may appear before breaking higher levels.
📈 Captain’s Chart – Technical Analysis
Storm Breaker (Resistance / Sell Zone):
Weak High: 3675 – 3677 (psychological barrier)
Peak Zone: 3676 – 3680 (high test, short-term reversal risk)
Golden Harbor (Support / Buy Zone):
FVG: 3603 – 3601
Deep Harbor: 3621 – 3623
Price Structure:
On H1, Gold has repeatedly formed BoS and Equal High (EqH) around 3645 – 3650.
An FVG appears → sign that price may need to fill the liquidity gap before continuing.
Priority scenario: Pullback to 3636 or deeper 3621, then rebound towards 3675 – 3680.
If 3680 breaks successfully → opens the way for new ATH above 3700.
🎯 Captain’s Map – Trading Plan
✅ Buy (trend-follow priority)
Buy FVG: 3601 – 3603 | SL: 3591 | TP: 3605 – 3610 – 3615 – 3620 – 36xx
Buy Zone: 3621 – 3623 | SL: 3612 | TP: 3640 – 3655 – 3665 – 3675 – 368x
⚡ Sell (short-term scalp at resistance)
Sell Zone: 3675 – 3680 | SL: 3684 | TP: 3665 – 3655 – 3645 – 36xx
⚓ Captain’s Note
“The dovish wind from the FED continues to push the golden sails forward. Golden Harbor 🏝️ (3636 – 3621) is the safe docking zone for sailors to gather strength before the new voyage. Storm Breaker 🌊 (3675 – 3680) may create big waves for short Quick Boarding 🚤 , but the main course is still heading North. If the 3680 wave breaks, the golden ship will extend its journey to new peaks above 3700.”
Technicaloutlook

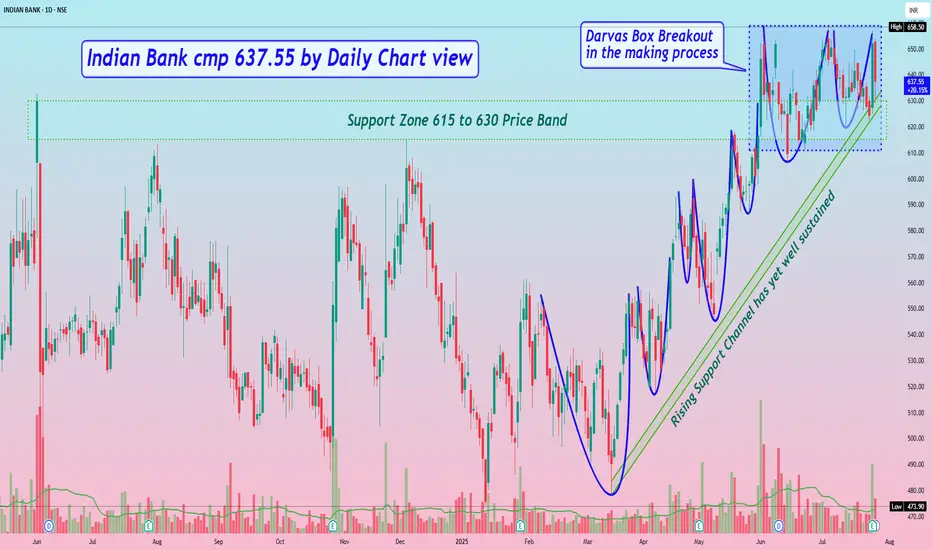
Indian Bank cmp 637.55 by Daily Chart viewIndian Bank cmp 637.55 by Daily Chart view
- Support Zone 615 to 630 Price Band
- Resistance only at ATH 658.80 price level
- Darvas Box Breakout in the making process
- Rising Support Channel has yet well sustained
- Support Zone has been tested retested well enough
- Repeated Bullish Rounding Bottoms at Support Zone neckline
- Considerate VCP pattern formed from Rising Price Channel start point
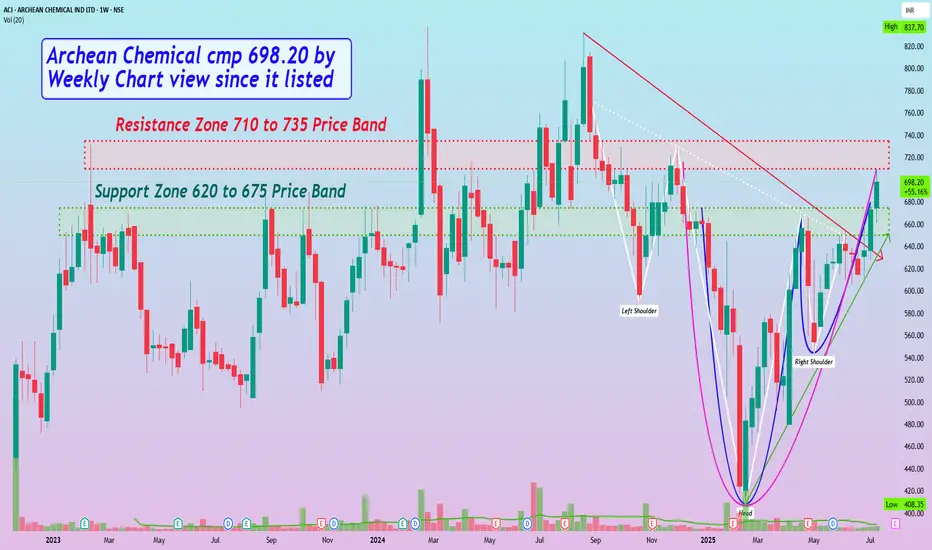
Archean Chemical cmp 698.20 by Weekly Chart view since it listedArchean Chemical cmp 698.20 by Weekly Chart view since it listed
- Support Zone 620 to 675 Price Band
- Resistance Zone 710 to 735 Price Band
- Volumes flattish, need to increase for Resistance Zone Breakout
- Bullish Rounding Bottom inclusive of Cup & Handle pattern completed
- A logically considerate slanting Bullish Head & Shoulder pattern too, has completed
- Falling Resistance Trendline Breakout sustained and Rising Support Trendline respected
LIC Housing Finance cmp 637.05 by Daily Chart viewLIC Housing Finance cmp 637.05 by Daily Chart view
- Support Zone 600 to 625 Price Band
- Resistance Zone 660 to 685 Price Band
- Rising Support Trendline seen well respected
- Volumes have spiked heavily today by demand based buying
- Breakout seemingly sustained for Double Falling Resistance Trendlines
- Support Zone acting as neckline for Multiple Bullish Technical Chart patterns
- Most common Technical Indicators BB, EMA, MACD, RSI, SAR trending positively
- Bullish Rounding Bottoms with considerate Cup & Handle and a faintly observant Head & Shoulders too

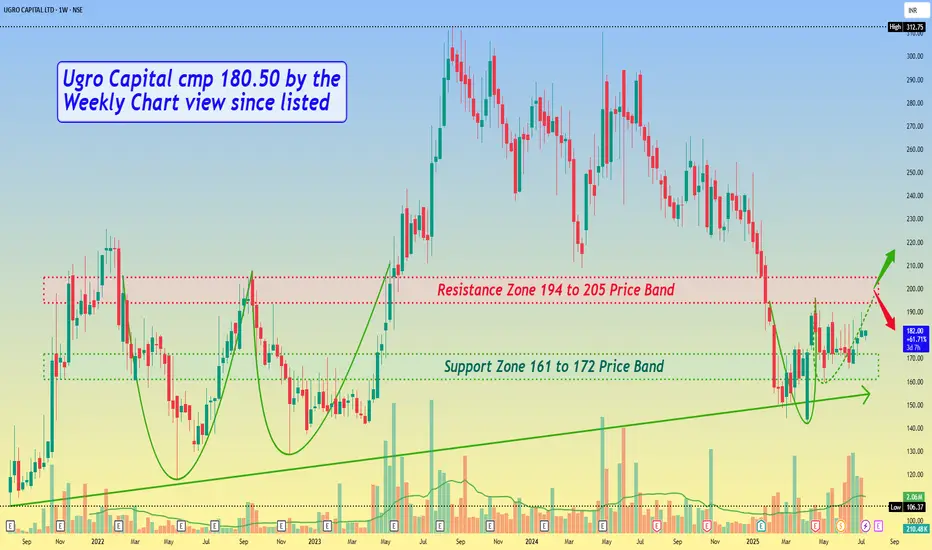
Ugro Capital cmp 180.50 by the Weekly Chart view since listedUgro Capital cmp 180.50 by the Weekly Chart view since listed
- Support Zone 161 to 172 Price Band
- Resistance Zone 194 to 205 Price Band
- Bullish Rounding Bottom 1st done and 2nd in completion stage
- Resistance Zone neckline will be a decent hurdle to cross for fresh breakout
- Volumes surging heavily by demand based buying and well above avg traded quantity
- Majority of the Technical Indicators of BB, EMA, SAR, SuperTrend, MACD, RSI are seen in positive trend
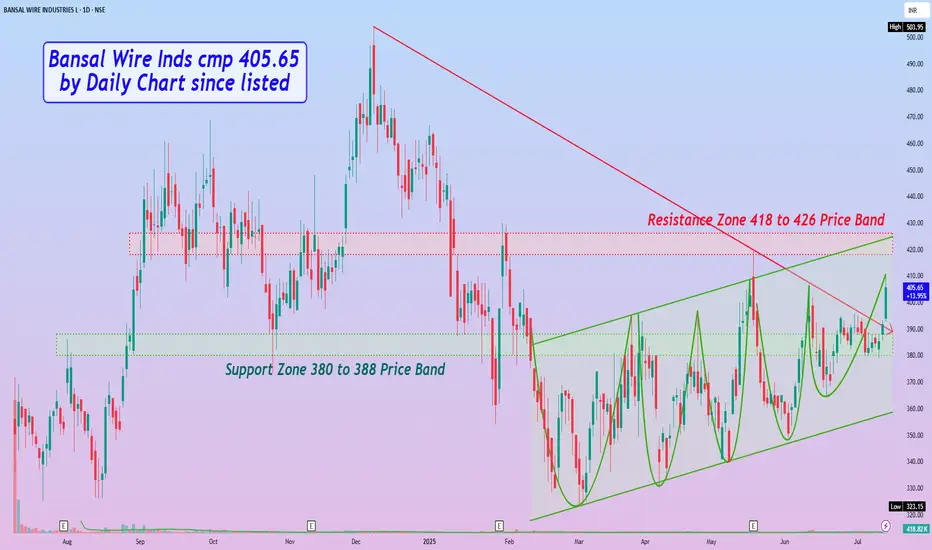
Bansal Wire Inds cmp 405.65 by Daily Chart since listedBansal Wire Inds cmp 405.65 by Daily Chart since listed
- Support Zone 380 to 388 Price Band
- Resistance Zone 418 to 426 Price Band
- Very considerate VCP Pattern formed on the chart
- VCP pattern is within Bullish Rising Parallel Price Channel
- Support Zone tested, retested and Breakout seems well sustained
- Falling Resistance Trendline Breakout too yet seems been kept sustained
- Volumes surged heavily on Friday and are well above average traded quantity
MUTHOOT FINANCE, Divergence is formed on the Daily ChartA strong Divergence has been formed on the Daily Chart.
The breakdown of 1733 will open the lower levels.
Disclaimer: This is my pre market analysis and my trading journal. Not a suggestion to buy or sell.

CASTROLIND, Technical OutlookCMP - 186.65
Today the price has managed to close above an important level of 185.20.
The price could test the resistance level of 200.65 and if broken then we would see the level of 215.70
Disclaimer : This is my pre market analysis and my trading journal. Not a suggestion to buy or sell.

PNB, Intraday View for 11-JuneToday we have a gravestone doji candle, which has been formed after a move of 23%.
Also the price is in a compression zone.
The price could test the support level S1-122 and if broken then S2-110.45
Disclaimer : This is my pre market analysis and my trading journal. Not a suggestion to buy or sell.

BANDHANBNK, Technical OutlookKeep an eye on the demand zone with levels from 170 to 175.
The price could be re-bounced from these levels.
Disclaimer : This is my pre market analysis and my trading journal. Not a suggestion to buy or sell.

PNB, Intraday View for 4-JuneToday we have a gap up opening of more than 4% and the price has closed on the resistance level.
Wait for the price to settle down.
CMP:137
R1:137 | R2:142.90
S1:123.50 | S2:119
Disclaimer : This is my pre market analysis and my trading journal. Not a suggestion to buy or sell.

PNB, Intraday View for 31-MayAnother Inverted Hammer Candle shows the weakness in the price.
The price is being strongly rejected by the levels of 130.
The probability of a strong bearish candle is more than 70%.
Disclaimer : This is my pre market analysis and my trading journal. Not a suggestion to buy or sell.

TATASTEEL, Technical OutlookThe price is in a strong down trend. Today's candle has changed the character of price.
The next important level to consider is 162.30 and if broken then the price could test the levels of 158. Also the degree and nature of separation in both bands indicates the price is entering in the compression zone.
Disclaimer : This is my pre market analysis and my trading journal. Not a suggestion to buy or sell.

CASTROL, Technical OutlookTrend Negative
Strength Strong
CMP - 189.70
Resistance - 198
Support - 185.20
The probability of a next red candle is more than 70%
Disclaimer: This is my pre market analysis and my trading journal. Not a suggestion to buy or sell.

BAJAJHLDNG, Technical Outlook for 27MayTrend - Negative
Strength Strong
CMP - 8,031.95
Breakdown Level - 8,014.30
Support - 7,739.50
Resistance - 8,495.00
Disclaimer : This is my pre market analysis and my trading journal. Not a suggestion to buy or sell.

HDFCLIFE, Ascending Triangle PatternThe price has formed an ascending triangle pattern.
The breakout of the triangular pattern will open the higher levels 600.
Resistance - 590
Support - 560
Disclaimer: This is my pre market analysis and my trading journal. Not a suggestion to buy or sell.

Wipro Technical Outlook | 20-May-2024
Daily tf: Trend Negative, as long as the price is below LTMA Band.
Weekly tf: Trend Neutral, Compression Zone
Disclaimer: This is my pre market analysis and my trading journal. Not a suggestion to buy or sell.

SBI Card, Technical Outlook 21MayThe degree and nature of separation in both bands indicates the start of a downtrend.
But the price has been trapped in the Darvas Box. So the breakdown of the box confirms the downtrend. And a short trade with a R/R - 1/3 can be planned with a stop loss of 724 if breakdown happens with momentum.
Disclaimer: This is my pre market analysis and my trading journal. Not a suggestion to buy or sell.

NOCIL, Technical OutlookCMP : 263.35
Today we have a bullish piercing candle, which has given the breakout of both bands.
It indicates the start of an uptrend.
Probability on the up side is more than 50%
Resistance : 268
Support-1 : 254
Support-2 : 249
Disclaimer : This is my pre market analysis and my trading journal. Not a suggestion to buy or sell.

DLF, Technical Outlook 22-MayTrend Negative, Strength Medium
The degree and nature of separation in both bands indicates a negative trend.
The price is trading on the lower side of STMA Band.
The probability of a next negative candle is more than 70%.
Important levels are marked on the chart.
Disclaimer: This is my pre market analysis and my trading journal. Not a suggestion to buy or sell.

PNB, Intraday View for 24-MayIt's the 4th time in 2 weeks the price is rejected by the level 128. Now the 128 level will act as a strong resistance. Currently the price is in a negative trajectory. For Intraday I go for a short trade if the price opened below the level of 128 and the trade range is 128 - 125 - 123.50
Disclaimer: This is my pre market analysis and my trading journal. Not a suggestion to buy or sell.

US30 - Dow Jones Industrial Average Weekly OUTLOOKPossible US30 Weekly Setup.
We have tapped into supply on the HTF and have seen a change of character in order flow. Possible bullish week for stock indexes following the increase in interest rates by the federal reserve last week.
Week of 7 - 11 November 2022
This is not a signal.
