Tech & AI Upside: Opportunities, Drivers, and Future Outlook1. Growth Drivers of Tech and AI
The upside potential of tech and AI is rooted in several structural growth drivers. First, digital transformation across industries is accelerating. Organizations, from healthcare and finance to manufacturing and retail, are increasingly adopting digital tools to improve efficiency, enhance customer experiences, and gain competitive advantages. AI applications such as predictive analytics, natural language processing, and computer vision are becoming central to these transformations. For instance, AI-driven supply chain optimization can reduce costs and improve delivery times, while AI-based financial models can enhance risk management and investment strategies.
Second, the proliferation of data fuels AI growth. The explosion of digital information—ranging from transaction records and social media interactions to IoT sensor data—is creating a rich ecosystem for AI algorithms to analyze and learn from. Advanced machine learning models thrive on large datasets, enabling better predictions, automation, and personalization. For example, recommendation engines in e-commerce and streaming platforms use AI to process massive datasets, leading to improved engagement and monetization.
Third, advancements in computational infrastructure have significantly increased AI’s potential. The development of high-performance GPUs, TPUs, and cloud-based AI platforms has enabled the training of increasingly complex models that were previously infeasible. AI models such as large language models and generative AI can now perform tasks ranging from content creation and code generation to medical diagnostics and drug discovery, opening new markets and revenue streams.
Finally, favorable investment trends support tech and AI expansion. Venture capital and private equity investments in AI startups continue to rise, reflecting strong investor confidence in the sector’s long-term growth. Governments and corporations are also increasing funding for AI research, recognizing its potential to drive national competitiveness and industrial leadership.
2. Market Opportunities Across Industries
The upside of tech and AI is not limited to the software industry; it spans virtually every sector of the economy. In healthcare, AI-powered diagnostics, predictive analytics, and personalized treatment plans are improving patient outcomes while reducing costs. Companies leveraging AI to analyze medical images, monitor patient vitals, or design new drugs are poised to redefine healthcare delivery and pharmaceutical innovation.
In finance, AI is transforming investment management, fraud detection, and customer service. Robo-advisors and algorithmic trading platforms leverage AI to optimize investment strategies, while banks use AI-driven systems to detect anomalous transactions in real-time, significantly reducing fraud risk.
In manufacturing and logistics, AI is revolutionizing production efficiency, predictive maintenance, and supply chain management. Smart factories equipped with AI-powered robotics and IoT sensors can reduce downtime, improve product quality, and respond more rapidly to market demand. Similarly, AI-driven logistics platforms optimize routes and inventory management, leading to cost savings and faster delivery.
Consumer technology also presents vast opportunities. AI enhances user experiences through voice assistants, personalized recommendations, augmented reality applications, and intelligent devices. Social media, streaming services, and e-commerce platforms increasingly rely on AI to retain users and boost engagement. Generative AI, which can create text, images, audio, and even video content, is unlocking entirely new forms of digital creativity and content monetization.
3. Economic and Competitive Implications
The rise of AI is reshaping the competitive landscape. Companies that successfully integrate AI into their operations gain a distinct advantage, often achieving higher efficiency, lower costs, and better customer satisfaction. This creates a “winner-takes-most” dynamic in many markets, particularly in areas like cloud computing, AI platforms, and enterprise software. Tech giants such as Microsoft, Google, and Amazon are leveraging their AI capabilities to dominate cloud services, productivity tools, and consumer applications, while startups focus on niche innovations that address specific industry pain points.
Economically, AI and technology adoption drive productivity gains and job creation, although they also present challenges related to workforce displacement. Routine and repetitive tasks are increasingly automated, leading to shifts in labor demand toward higher-skill roles in AI development, data science, cybersecurity, and digital strategy. Governments and institutions face the task of balancing innovation with workforce reskilling initiatives to ensure inclusive economic growth.
4. Investment Opportunities in Tech and AI
From an investment perspective, the upside in tech and AI is reflected in both public and private markets. Public equities in AI-focused technology companies offer exposure to companies with proven business models, large datasets, and scalable platforms. Companies specializing in cloud computing, AI chips, cybersecurity, and enterprise software are particularly attractive due to their strategic importance and recurring revenue models.
Private investments, including venture capital and private equity, provide exposure to high-growth AI startups that may become the next generation of market leaders. These investments carry higher risk but offer significant potential rewards if the startups successfully develop disruptive technologies and achieve market traction. Additionally, thematic ETFs and mutual funds focused on AI and technology provide diversified exposure to the sector, allowing investors to benefit from broad AI adoption without concentrating risk in a single company.
5. Challenges and Considerations
Despite the substantial upside, tech and AI adoption also faces challenges. Ethical concerns around privacy, bias, and accountability are increasingly scrutinized by regulators and society. AI systems trained on biased data can perpetuate discrimination, while widespread data collection raises questions about consent and security. Companies must prioritize responsible AI development, transparency, and regulatory compliance to maintain public trust.
Moreover, technological complexity and talent shortages can limit AI implementation. Developing, deploying, and maintaining advanced AI systems requires highly specialized skills, creating competitive pressures for top talent. Companies that fail to attract and retain AI experts may struggle to compete effectively.
Cybersecurity risks are another concern. As AI becomes more integrated into critical systems, vulnerabilities in AI models can be exploited, leading to financial losses, reputational damage, or systemic disruption. Robust cybersecurity protocols and AI model validation are essential to mitigate these risks.
6. Future Outlook
Looking ahead, the upside of tech and AI remains substantial. Emerging trends such as generative AI, autonomous systems, quantum computing, and AI-driven biotech applications have the potential to create entirely new industries and redefine existing ones. Generative AI, in particular, is already disrupting creative industries, software development, and customer engagement, with the potential to automate complex tasks previously thought to require human creativity.
Moreover, AI’s integration with other technologies, including IoT, blockchain, and 5G networks, will enable new business models and operational efficiencies. For instance, smart cities leveraging AI and IoT can optimize traffic flow, energy usage, and public safety, while AI-enabled blockchain systems can enhance supply chain transparency and security.
Overall, the upside of tech and AI is characterized by transformative potential, broad applicability across sectors, and significant economic impact. Companies, investors, and policymakers that understand and harness these opportunities while managing associated risks are likely to benefit from long-term growth and innovation leadership.
Conclusion
The tech and AI sector offers unparalleled upside potential, fueled by data proliferation, computational advancements, digital transformation, and strong investment support. Opportunities span multiple industries, from healthcare and finance to manufacturing and consumer technology, with AI enabling efficiency, innovation, and enhanced user experiences. While ethical, regulatory, and technical challenges exist, the long-term prospects remain robust, with emerging technologies poised to redefine markets and create new economic frontiers. Stakeholders that strategically invest in AI innovation, talent, and responsible adoption are positioned to capitalize on one of the most significant growth stories of the 21st century.
Technology

AI & Technology Sector LeadershipNavigating Innovation, Strategy, and Global Impact
The Artificial Intelligence (AI) and broader technology sectors have become pivotal drivers of the global economy, reshaping industries, markets, and societies. Leadership within this domain is not simply about managing companies; it requires a visionary approach, combining technological expertise, strategic foresight, and an understanding of societal impact. Effective leadership in AI and technology is thus characterized by the ability to navigate rapid innovation, drive sustainable growth, and maintain ethical stewardship over emerging technologies.
1. The Landscape of AI & Technology
The AI and technology sector is remarkably diverse, encompassing areas such as software development, cloud computing, machine learning, robotics, semiconductors, cybersecurity, and more recently, generative AI and quantum computing. The sector’s growth trajectory has been exponential, fueled by data proliferation, advances in computing power, and evolving consumer behavior. According to industry reports, AI alone is expected to contribute trillions to the global economy over the next decade, with applications ranging from autonomous vehicles and precision medicine to personalized marketing and predictive analytics.
This rapid expansion places unique demands on leadership. Unlike traditional industries, technology leaders must contend with disruption as a constant, where yesterday’s innovation quickly becomes obsolete. Successful leaders are those who can anticipate trends, align their organizations with emerging opportunities, and foster a culture of continuous learning and adaptability.
2. Core Traits of Technology Sector Leaders
Leadership in the AI and technology space is defined by several core traits:
a. Visionary Thinking: Technology leaders must envision the future impact of their innovations. For instance, AI leaders are not merely focused on developing algorithms; they must understand how these solutions reshape industries, improve efficiency, and enhance human experiences. Visionary leadership entails strategic foresight, the ability to identify trends, and the courage to pursue transformative projects even amidst uncertainty.
b. Technical Acumen: While leadership encompasses more than technical expertise, understanding the technological underpinnings of one’s business is critical. Leaders must grasp AI architectures, cloud systems, cybersecurity frameworks, or software development processes to make informed strategic decisions, allocate resources efficiently, and guide teams effectively.
c. Agility and Adaptability: The pace of technological change demands leaders who can pivot quickly. Organizations led by adaptive leaders can respond to disruptive innovations, emerging competitors, and shifting regulatory landscapes. Agility also extends to workforce management, ensuring that talent development, recruitment, and reskilling initiatives keep pace with evolving technological demands.
d. Ethical and Responsible Leadership: With AI and technology increasingly influencing society, ethical considerations are central to leadership. Leaders must navigate issues such as data privacy, algorithmic bias, environmental sustainability, and the societal impact of automation. Ethical stewardship enhances public trust, mitigates reputational risks, and aligns technology deployment with human-centered values.
e. Collaborative and Inclusive Leadership: Innovation rarely occurs in isolation. Leaders must foster collaborative environments where cross-functional teams, diverse perspectives, and open communication drive creativity. Inclusivity in hiring, team management, and product development ensures that solutions are equitable and resonate across diverse markets.
3. Strategic Pillars of Leadership in AI & Technology
a. Innovation Management: At the core of technology leadership is the ability to manage and scale innovation. This involves identifying promising research areas, funding exploratory projects, and maintaining a balance between short-term returns and long-term breakthroughs. Companies like Google, Microsoft, and Tesla exemplify how strategic investment in R&D fuels competitive advantage.
b. Talent Acquisition and Development: Human capital is the lifeblood of AI and technology companies. Leaders must attract top engineers, data scientists, and researchers while fostering a culture of continuous learning. Initiatives such as hackathons, mentorship programs, and partnerships with academic institutions enable the cultivation of skills that align with future technological trends.
c. Market and Competitive Strategy: Successful leaders must translate technological capability into market advantage. This includes understanding customer needs, differentiating products, and leveraging partnerships or acquisitions to expand technological capabilities. Strategic decisions in AI, for example, may involve whether to focus on enterprise applications, consumer-facing solutions, or industry-specific platforms.
d. Regulatory and Policy Navigation: AI and technology sectors operate under increasing regulatory scrutiny. Leaders must proactively engage with policymakers, comply with evolving regulations, and anticipate geopolitical implications of technology deployment. Cybersecurity, data governance, and AI safety regulations require a proactive approach to risk management and corporate responsibility.
4. Case Studies in Leadership
a. Sundar Pichai – Alphabet Inc.: Under Pichai’s leadership, Alphabet has maintained dominance in AI and cloud computing while expanding into new arenas such as autonomous vehicles and quantum computing. Pichai exemplifies a balance of technical understanding, visionary strategy, and global market navigation.
b. Satya Nadella – Microsoft: Nadella’s tenure is a testament to transformative leadership. By pivoting Microsoft toward cloud computing, AI, and enterprise solutions, he revitalized the company’s growth trajectory. Nadella emphasized culture, collaboration, and inclusivity, demonstrating that technological leadership is inseparable from organizational culture.
c. Jensen Huang – NVIDIA: Huang has led NVIDIA to become a global leader in AI hardware, leveraging GPU technology to drive advances in machine learning. His focus on innovation, market foresight, and ecosystem-building underscores the importance of aligning technological capability with strategic market positioning.
5. Challenges and Future Directions
a. Rapid Technological Change: Leaders must continuously monitor emerging technologies and assess their relevance. From AI generative models to quantum computing, staying ahead of technological curves is a constant challenge.
b. Ethical Dilemmas: As AI systems influence decision-making in finance, healthcare, and law enforcement, leaders face heightened scrutiny over fairness, transparency, and accountability. Navigating these ethical dilemmas is increasingly central to leadership effectiveness.
c. Global Competition and Geopolitics: Technology leadership is also shaped by international dynamics. Trade restrictions, intellectual property disputes, and differing regulatory frameworks require leaders to adopt globally informed strategies.
d. Workforce Evolution: Automation and AI are reshaping job roles, creating opportunities and displacing traditional functions. Leaders must manage workforce transitions, reskill employees, and foster a culture that embraces change.
6. The Role of AI in Leadership Itself
Interestingly, AI is also transforming leadership practices. AI-driven analytics and predictive models enhance decision-making, optimize operations, and improve customer insights. Leaders who leverage AI for strategic foresight, risk management, and organizational efficiency gain a competitive advantage. However, reliance on AI also requires caution to avoid overdependence on algorithms at the expense of human judgment and ethical considerations.
7. Conclusion
Leadership in the AI and technology sector is multidimensional, combining vision, technical expertise, ethical stewardship, and strategic agility. It is not simply about producing innovative products but shaping the trajectory of industries and societies. Leaders must navigate rapid technological change, global competition, regulatory complexities, and ethical dilemmas while fostering inclusive and innovative organizational cultures.
The future of AI and technology leadership will increasingly demand a synthesis of human and artificial intelligence capabilities, where leaders not only leverage technological tools but also ensure that their applications align with societal values and global progress. Those who can balance innovation with responsibility, agility with strategy, and technical insight with ethical foresight will define the next era of technological advancement, driving growth, transformation, and sustainable impact worldwide.

CARTRADE TECH LTDCarTrade Tech Ltd. is a prominent player in the online auto classifieds space in India. The company operates platforms like CarTrade, CarWale, and BikeWale, which facilitate the buying and selling of new and used vehicles.
Market Cap: ₹4,192 Crores
P/E Ratio: 133.17
P/B Ratio: 2.27
Debt to Equity: 0
ROE: 3.63%
Book Value: ₹442.49
EPS: ₹16
1 Year Return: 48.64%
3 Year Return: -15.79%
CarTrade Tech Ltd. has shown significant growth in the past year, but its high P/E ratio indicates that the stock might be overvalued compared to its earnings. The company has a strong balance sheet with no debt, which is a positive sign for investors.
Key Ratios
Quality Score: 6/10
Growth Score: 7/10
Valuation Score: 3/10
Momentum Score: 8/10

INFOSYS LTDDaily chart
I detect a range zone.
We are below the average price of my algo.
Make up your mind.

TataTech consolidating and waiting for breakout.Trading in range on hourly chart. Range getting thinner. Accumulation being done. Investment opportunity above 1172 with a stop loss of 1135.

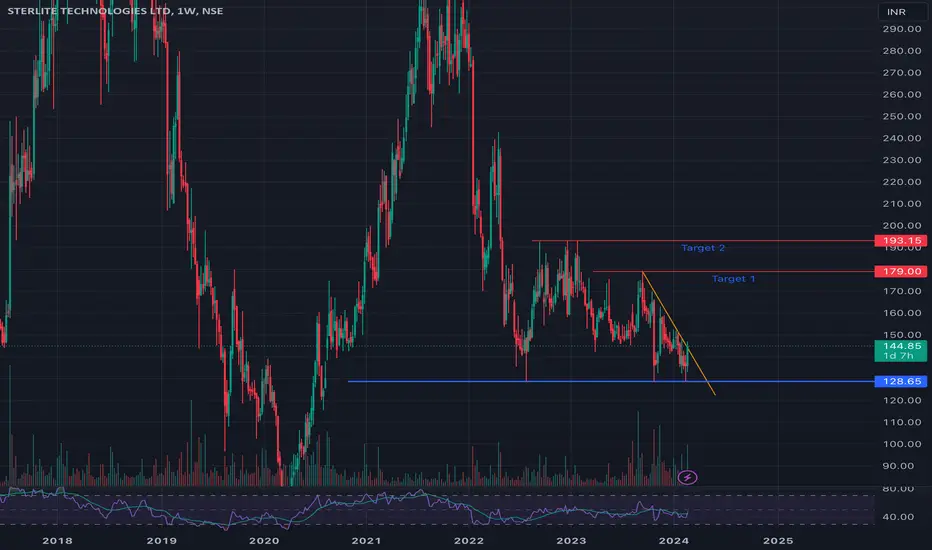
STLTECH Looking for breakoutTaking support at 128 on monthly chart. Breaking trendline at 144 on Daily and Weekly chart. Allow weekly candle to complete. Wait for retest and buy at breakout.

Kellton Technologies cmp 86 Multibagger in MakingKellton Technologies cmp 86 supports shifted to 68/64 zone Target 92/95/106/116/135 +++ any dips upto 83/80/76 is buy

Techno Electric - Multiyear BreakoutTechno Electric Looks good for 10/15/20%+++
Ride the Momentum
Supports 360
Results this week

Inverted Cup & Handle - INFOSYSWith poor numbers and strong Inverted cup and handle and stock at the breakout !! see a target of 1000-900-800 SL 1500

Is Wipro ready for breaking the long consolidation phase ?NSE:WIPRO is fundamentally sound script. As of now there are no reversal signs in chart patterns but investors can consider this 385 range as a buying opportunity. I Expect target levels of 425 in upcoming quarter.

Short Syrma target 256-260bearish hold tighten at 45 Mint. Chart short when it pull back on 289-290 and wait for target 256-260. Invest as per your risk

Range Breakout Allsec TechlogyRange Breakout
Buy Allsec Technologies
Closing Price - 451.95
SL - 360 (WCB)
Target - 650/715/800

Clean Science & TechnologyClean Science & Technology possible good swing trade after breakdown & breakout.......!

TCSThis is how tcs can react tomorrow, it's on its important zone if it breakes then we can expect a good move towards all time high, but we should wait and should see whether it consolidates at this level or what.

HAPPIEST MINDS TECHNOLOGIESHappiest Minds Technologies, THE MID CAP IT GIANT which a leading digital transformation technology provider is finally out from the trade to trade segment, the stock has seen a reasonable correction from its highs with improving fundamentals.the volumes are squeezed shows the TTM SQUEEZE ,the stock has formed a triple bottom like structure which is a bullish setup, previous times the stock was reversing from 1350 round levels but this time it has formed a swing near the supply zone which adds a feather to our chart and the swing low would be an ideal SL for the positional traders ,the only wait is for the volumes to return ,once the volumes return the stock can see a 90 degree momentum and the targets could be the ATH

BREAKOUT IN CLEAN SCIENCEThe stock gives a fresh breakout in 1HR time frame and now the stock is ready to show some big moves. The target and stoploss level is also mentioned in the charts.

AUD JPY AUD JPY 1HR
IT SEEMS LIKE T GONNA FORM AN SYMETRICAL TRIANGLE
AND IT REACHES THEKEY LEVEL
AFTER THAT 200 MA

Breakout in Bajaj FinanceIn the daily chart, a huge breakout has been played with great volume indicating a strong upward trend in the stock. Trade with proper SL and Target.

13/05/2021 Research Report For MindtreeShort @ CMP. (Current Market Price) or Max 2150
Buy Target 1 :- 2110
Buy Target 2: 2090
Buy Target 3:- 2050
SL (Stoploss) :- 2221
SHORT ONLY IN FUTURE CONTRACT | AVOID OPTION


HCL Tech going for Bear run1. encountered fewer profits due to IT slab change
2. lower lows and lower highs are found with volatile ATR value.
3. Moving Averages and downtrend signals extreme bear run

NASDAQ Extends againAfter a 3 wave correction the nasdaq composite managed to move up in what even I thought maybe 3 corrective. But maybe it is a leading diagonal and that changes everything. We have extensions long term and a new impulse wave up in wave 3 of 3 started for the Nasdaq. Then it changes the entire perspective for stocks. Bullish gaps as of now typical with 3rd waves
