CARTRADE TECH LTDCarTrade Tech Ltd. is a prominent player in the online auto classifieds space in India. The company operates platforms like CarTrade, CarWale, and BikeWale, which facilitate the buying and selling of new and used vehicles.
Market Cap: ₹4,192 Crores
P/E Ratio: 133.17
P/B Ratio: 2.27
Debt to Equity: 0
ROE: 3.63%
Book Value: ₹442.49
EPS: ₹16
1 Year Return: 48.64%
3 Year Return: -15.79%
CarTrade Tech Ltd. has shown significant growth in the past year, but its high P/E ratio indicates that the stock might be overvalued compared to its earnings. The company has a strong balance sheet with no debt, which is a positive sign for investors.
Key Ratios
Quality Score: 6/10
Growth Score: 7/10
Valuation Score: 3/10
Momentum Score: 8/10
Technology

INFOSYS LTDDaily chart
I detect a range zone.
We are below the average price of my algo.
Make up your mind.

TataTech consolidating and waiting for breakout.Trading in range on hourly chart. Range getting thinner. Accumulation being done. Investment opportunity above 1172 with a stop loss of 1135.

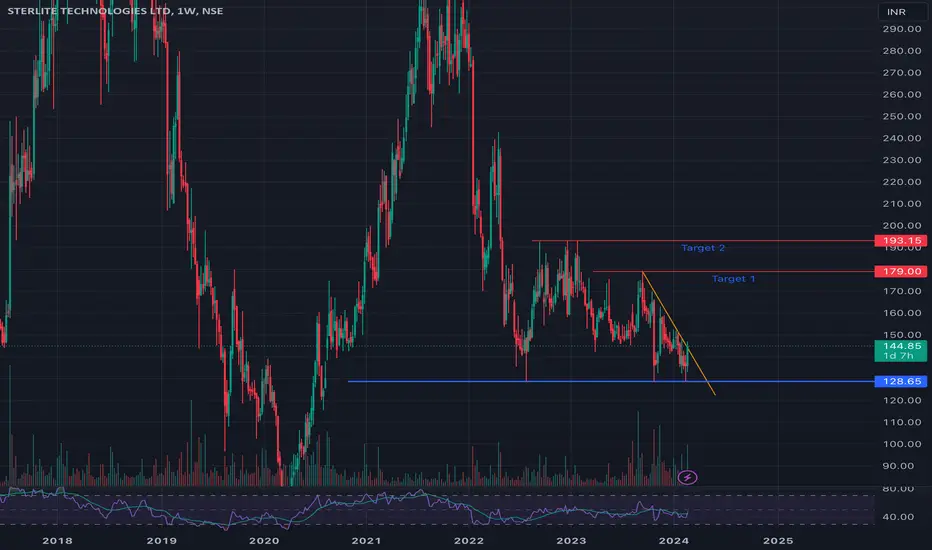
STLTECH Looking for breakoutTaking support at 128 on monthly chart. Breaking trendline at 144 on Daily and Weekly chart. Allow weekly candle to complete. Wait for retest and buy at breakout.

Kellton Technologies cmp 86 Multibagger in MakingKellton Technologies cmp 86 supports shifted to 68/64 zone Target 92/95/106/116/135 +++ any dips upto 83/80/76 is buy

Techno Electric - Multiyear BreakoutTechno Electric Looks good for 10/15/20%+++
Ride the Momentum
Supports 360
Results this week

Inverted Cup & Handle - INFOSYSWith poor numbers and strong Inverted cup and handle and stock at the breakout !! see a target of 1000-900-800 SL 1500

Is Wipro ready for breaking the long consolidation phase ?NSE:WIPRO is fundamentally sound script. As of now there are no reversal signs in chart patterns but investors can consider this 385 range as a buying opportunity. I Expect target levels of 425 in upcoming quarter.

Short Syrma target 256-260bearish hold tighten at 45 Mint. Chart short when it pull back on 289-290 and wait for target 256-260. Invest as per your risk

Range Breakout Allsec TechlogyRange Breakout
Buy Allsec Technologies
Closing Price - 451.95
SL - 360 (WCB)
Target - 650/715/800

Clean Science & TechnologyClean Science & Technology possible good swing trade after breakdown & breakout.......!

TCSThis is how tcs can react tomorrow, it's on its important zone if it breakes then we can expect a good move towards all time high, but we should wait and should see whether it consolidates at this level or what.

HAPPIEST MINDS TECHNOLOGIESHappiest Minds Technologies, THE MID CAP IT GIANT which a leading digital transformation technology provider is finally out from the trade to trade segment, the stock has seen a reasonable correction from its highs with improving fundamentals.the volumes are squeezed shows the TTM SQUEEZE ,the stock has formed a triple bottom like structure which is a bullish setup, previous times the stock was reversing from 1350 round levels but this time it has formed a swing near the supply zone which adds a feather to our chart and the swing low would be an ideal SL for the positional traders ,the only wait is for the volumes to return ,once the volumes return the stock can see a 90 degree momentum and the targets could be the ATH

BREAKOUT IN CLEAN SCIENCEThe stock gives a fresh breakout in 1HR time frame and now the stock is ready to show some big moves. The target and stoploss level is also mentioned in the charts.

AUD JPY AUD JPY 1HR
IT SEEMS LIKE T GONNA FORM AN SYMETRICAL TRIANGLE
AND IT REACHES THEKEY LEVEL
AFTER THAT 200 MA

Breakout in Bajaj FinanceIn the daily chart, a huge breakout has been played with great volume indicating a strong upward trend in the stock. Trade with proper SL and Target.

13/05/2021 Research Report For MindtreeShort @ CMP. (Current Market Price) or Max 2150
Buy Target 1 :- 2110
Buy Target 2: 2090
Buy Target 3:- 2050
SL (Stoploss) :- 2221
SHORT ONLY IN FUTURE CONTRACT | AVOID OPTION


HCL Tech going for Bear run1. encountered fewer profits due to IT slab change
2. lower lows and lower highs are found with volatile ATR value.
3. Moving Averages and downtrend signals extreme bear run

NASDAQ Extends againAfter a 3 wave correction the nasdaq composite managed to move up in what even I thought maybe 3 corrective. But maybe it is a leading diagonal and that changes everything. We have extensions long term and a new impulse wave up in wave 3 of 3 started for the Nasdaq. Then it changes the entire perspective for stocks. Bullish gaps as of now typical with 3rd waves

SWKS BUY 03.09.2019BUY signal at 75.27 $
Skyworks Solutions Inc. designs, develops, manufactures and markets semiconductor products, including intellectual property. The Company's analog semiconductors are connecting people, places, and things, spanning a number of new and unimagined applications within the automotive, broadband, cellular infrastructure, connected home, industrial, medical, military, smartphone, tablet and wearable markets. Its geographical segments include the United States, Other Americas, China, Taiwan, South Korea, Other Asia-Pacific, Europe, Middle East and Africa. This company develops 5G technology.
If you want to see more history of this strategy, I will able to show you if you request me.
ATTENTION this strategy may has downtrend about 10-15%, so you can split your buy order, that you have not big downtrend.
__________________________________________________________________________
You can use the signals independently or like indicator of trends together with other indicators in your trading strategy.
Know that the success of your strategy that based on those signals depends from your money management and the additional conditions that you make in these strategies.
You use these signals inside your strategies at your own risk.
The chart shows the last trades on the product + the last signal.
I have several strategies for different products, and I want to show you proof of it works on history, and you will be able to see it, when returns to that profile.
Therefore, subscribe and watch for that profile.
The signals rare but useful.

NIFTY IT (CNXIT) trendline on historical chartIt has been observed on NIFTY IT CNXIT weekly chart that a rising trend line has been acting as good support and resistance on several occasions.
PS: Request you to use this trend line setup as a supplement to your analysis before taking any position.
Thanks,
tRex
Jurassic Park
