Gold (XAU/USD) Intraday Buy Setup with High Reward-to-Risk Ratio1. Entry Point Zone: Around 3,271.79 USD
This is identified as a potential buy entry area, marked in purple.
2. Stop Loss: Below the entry point at 3,257.71 USD
Risk management level in case the trade moves against the setup.
3. Target Point One: Between 3,313.75 and 3,317.07 USD
A short-term take-profit level, likely based on previous resistance.
4. Final Target (EA Target Point): Around 3,373.04 USD
A more ambitious take-profit, possibly based on a major resistance level or Fibonacci extension.
5. Trade Range:
Risk: 3,271.79 - 3,257.71 = 14.08 USD
Reward to First Target: ~42 USD
Tecnicalanalysis

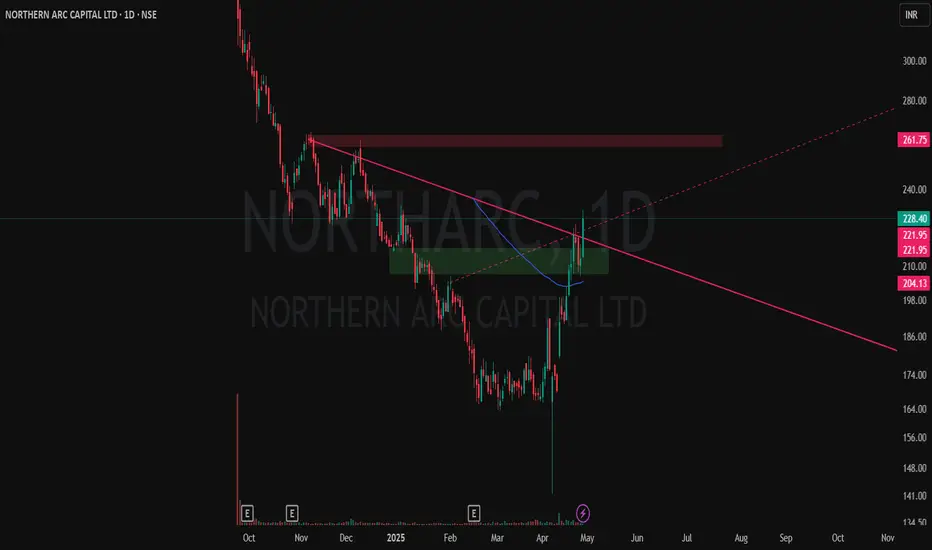
NORTHERNARC | Simple Price action Textbook CT breakout confirmed on the Daily chart:
✅ Strong demand zone formation with clear upward push
✅ Multiple volume spikes signaling institutional activity
✅ Clean Counter-Trendline (CT) breakout
✅ Hidden resistance line (dotted) also broken — extra confluence
✅ Immediate supply zone above marked for next watch
Breakout candle closed strong with momentum. Setup aligns with high-conviction strategy criteria — watching price action near supply for continuation or base formation.
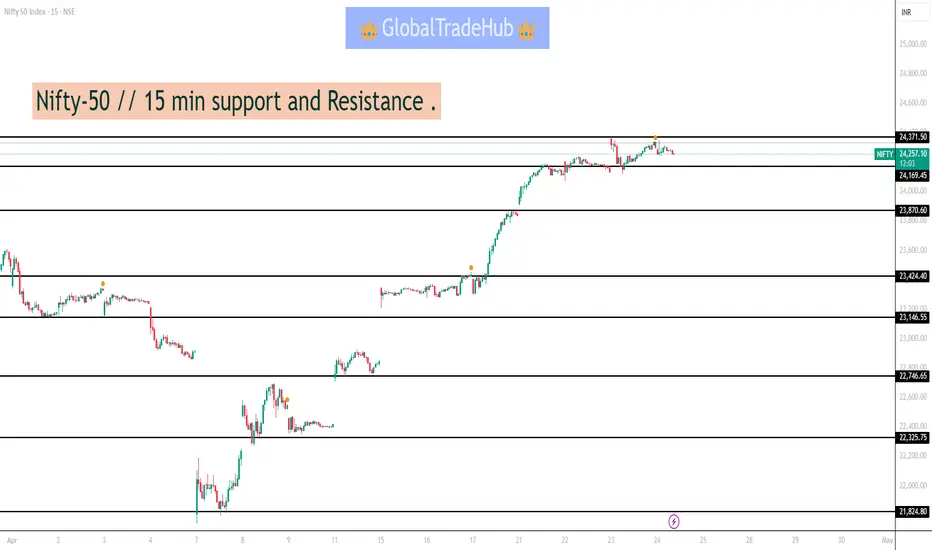
Nifty-50 // 15 min support and Resistance .NIFTY_50 Indicators & signals
Indicator MACD (12,26,9)
23420.22, 23191.53, 96.12
Indicator MACD is in positive zone
Indicator ADX (14)
31.57, 44.62, 23.21
Indicator ADX is indicating that momentum is weak.
Indicator ADX is showing that momentum is towards buying
Indicator RSI (14)
Current RSI is: 53
Indicator RSI is indicating buying momentum and stock might rise.
Technical TradingIn trading, "technical" refers to the practice of analyzing historical price and volume data to identify patterns and predict future price movements. This approach, called technical analysis, is a way to evaluate securities and forecast their behavior based on charts and statistical data.

Technical Analysis Technical analysis is a means of examining and predicting price movements in the financial markets, by using historical price charts and market statistics. It is based on the idea that if a trader can identify previous market patterns, they can form a fairly accurate prediction of future price trajectories.

Technical TradingTechnical trading is a broader style that is not necessarily limited to trading. Generally, a technician uses historical patterns of trading data to predict what might happen to stocks in the future. This is the same method practiced by economists and meteorologists: looking to the past for insight into the future.

Swing Trading AnalysisSwing trading is a strategy that involves capitalising on the short-term price movements of stocks or other securities, focusing particularly on those with high activity and significant price fluctuations. This approach can be broken down into a few key steps: Selecting a Suitable Stock.

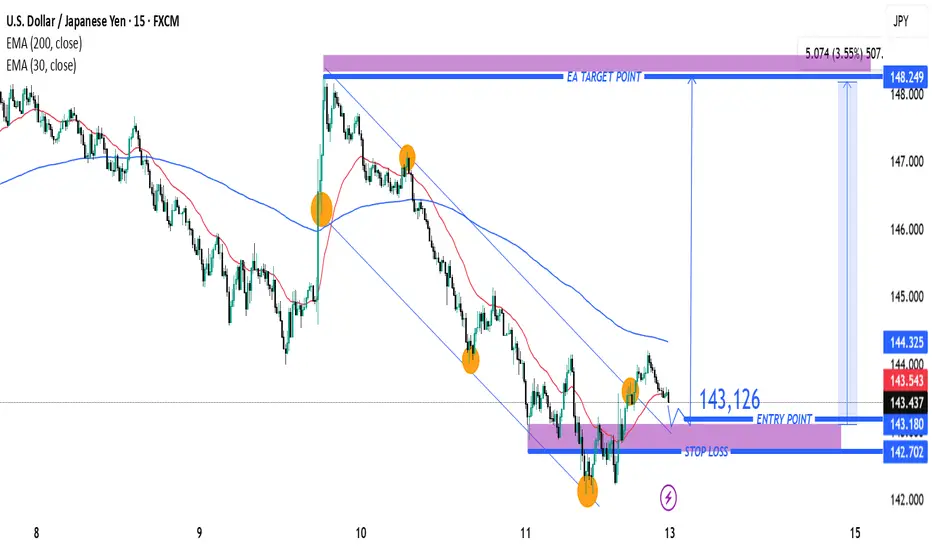
USD/JPY Bullish Breakout Setup – Entry, Stop Loss & Target AnalyPair: USD/JPY
Timeframe: 15 minutes
Indicators Used:
EMA (30-period) – Red line
EMA (200-period) – Blue line
Chart Features:
Downward channel (declining trendline)
Identified entry point, stop loss, and target
Key support/resistance zones shaded in purple
🟢 Trade Idea Summary:
🔹Entry Point: 143.126
🔹Stop Loss: 142.702
🔹Target (Take Profit): 148.249
🔹Risk/Reward Ratio: ~1:5 (Excellent R/R)
🔍 Technical Analysis:
✅ Bullish Breakout Signal
Price has broken above the descending channel and has retested the breakout area (highlighted purple zone) – a classic bullish breakout structure.
The breakout retest near 143.126 is acting as support, with potential to launch a new bullish move.
📈 Moving Average Analysis
EMA 30 is starting to flatten and curve up – indicating potential shift in momentum.
EMA 200 is still above price, but a breakout above it could strengthen the bullish case.
🔁 Support and Resistance
Strong support zone around 143.000 – 143.200 area (highlighted zone).
Major resistance and target zone is between 148.000 – 148.250.
🔔 Trade Plan Suggestion:
Go Long at or near 143.126
Place Stop Loss below support at 142.702
Target 148.249 for profit
Reasoning:
This setup offers a trend reversal potential from a downtrend to uptrend, with a clean breakout-retest-confirmation pattern. The wide take profit range gives room for extended upside as momentum builds.
⚠️ Watch For:
Reaction to the 144.325 (EMA 200) level
Increased buying volume to confirm breakout
Any re-entry into the channel (would invalidate setup)
BTC/USD Short Setup – Triple Top Reversal with EMA Confirmation Entry Point (Sell): Around $85,699.52
Stop Loss: $86,741.44 (above resistance zone)
Target (Take Profit): $82,982.09
This provides a Risk-Reward Ratio of approximately 1:2, a commonly acceptable ratio in trading.
📈 Indicators:
EMA 30 (Red) is currently above the EMA 200 (Blue), indicating bullish momentum—but this setup anticipates a trend reversal.
If price breaks below the EMAs, that would confirm bearish strength.
🧠 Conclusion:
This setup is based on:
A strong resistance zone,
Bearish reversal pattern (triple top),
Risk management via stop loss and take profit levels.
If you're trading this:
Wait for confirmation with a bearish candlestick below the EMAs or a break of recent support.
Manage position size based on stop distance and your account risk tolerance.

Explanation of RSI ( Relative Strength Index)The Relative Strength Index (RSI) is a momentum indicator used in technical analysis to measure the speed and magnitude of price changes, helping identify potential overbought or oversold conditions in a market.

Silver (XAG/USD) Bullish Trade Setup: Entry, Target & Stop-Loss Entry Point: ~32.35619
Take Profit (Target Point): 33.31252
Stop Loss: 31.87803
EMA 200 (Blue): 31.65932 – indicating long-term trend support.
EMA 30 (Red): 32.28304 – indicating short-term trend.
Current Price: 32.38220
The price is above both EMAs, which is typically bullish.
---
Analysis
1. Bullish Bias:
Price has broken and is holding above the entry zone.
Both EMAs are aligned in a bullish configuration (short-term EMA above long-term EMA).
The market structure shows higher lows and sideways consolidation, suggesting potential for a breakout.
2. Risk-Reward Ratio:
Risk (Entry to Stop Loss)

EUR/JPY Short Setup – Bearish Reversal Targeting 161.134 with TiEMA 30 (red): Currently at 162.470
EMA 200 (blue): Currently at 162.071
Trade Setup:
Entry Point: Around 162.978
Stop Loss: Slightly above 163.016 (highlighted in purple zone)
Target (Take Profit): 161.134 (labeled as “EA TARGET POINT”)
Analysis:
Trend: The pair has been trending upwards recently, as shown by the price staying above the 200 EMA.
Current Price: 162.604, just below the proposed entry.
Risk/Reward:
Risk: ~3.8 pips (entry to stop loss)
Reward: ~184.4 pips (entry to target)
This implies a favora

GOLD (XAUUSD) 15-Min Chart – Bearish Reversal Setup with Key EntPrice: $3,232.02 (at time of chart)
Trend: Price is consolidating near a resistance area after an upward move, with potential for a reversal.
🔍 Key Technical Levels
📈 Entry Point: $3,241.88
(Marked for a potential short entry)
🔻 EA Target Point (Take Profit): $3,187.70
This is the target for the short position; aligns with a strong previous demand zone and near the 200 EMA.
⛔ Stop Loss Zone: Above $3,243.48
Purple zone indicates the invalidation area for the short trade.
📉 Resistance Point: $3,229.87
(Red line, also the 30 EMA) – Important level where price is currently hovering.
🔵 Confirm Target Points: $3,223.04 & $3,218.25
Zones to watch for confirmation of downward momentum.
📘 EMA (30): $3,229.87
Acts as short-term dynamic resistance.
📘 EMA (200): $3,182.40
Acts as major support and long-term trend indicator. Also very close to the target area.
💡 Trade Idea Summary
Strategy: Short (Sell) from the resistance/entry point around $3,241.88.
Target: $3,187.70
Stop Loss: Above $3,243.48
Risk-Reward Ratio: Solid (approx. 1:2+ based on visual range)
🔎 Additional Notes
Price is testing resistance after forming a potential double top or lower high.
A breakdown below $3,223 could confirm bearish continuation.
Watch for confirmation candles on 15m or 1h before entering

EMA 30 (Red Line): Currently at 99.700 — tracks short-term trendEMA 30 (Red Line): Currently at 99.700 — tracks short-term trend, and price is hovering near this level.
EMA 200 (Blue Line): At 100.935 — indicates long-term trend, acting as dynamic resistance above.
📈 Trade Setup
✅ Entry Point:
Price: 99.699
Rationale: This level has been tested multiple times, forming a support zone. A bounce here signals a potential long entry.
🎯 Target Point (Take Profit):
Price: 102.738
Distance: ~3.04 points or 3.43% potential move upward.
Note: Marked as EA TARGET POINT, which suggests a calculated area possibly based on previous resistance or algorithmic strategy.
🛑 Stop Loss:
Price: 98.624
Reasoning: Just below the defined support zone (highlighted purple area), ensuring protection against downside breakouts.
📊 Risk-to-Reward Ratio
Entry: 99.699
Target: 102.738 → Gain of ~3.04
Stop: 98.624 → Risk of ~1.08
R/R Ratio: ~2.8:1 — favorable setup
📌 Overall Sentiment
This chart indicates a bullish reversal setup from a strong support zone, possibly targeting a mean reversion or trend reversal toward the 200 EMA and beyond.
However, keep in mind:
The price is currently below both EMAs, so the trend is still bearish.
The trade is counter-trend, relying on support holding and momentum shifting.

GBP/USD Short Setup – Rejection from Resistance Zone with High REMA 30 (red line)
EMA 200 (blue line)
---
Key Levels:
Entry Point: 1.31324
Stop Loss: 1.32303
Target (TP): 1.28102
---
Analysis:
1. Trend Context:
The market shows a recent bullish move approaching a key resistance zone (highlighted in purple).
The price is now reacting to that resistance zone and potentially forming a reversal.
2. EMA Insight:
Price is currently trading slightly above the EMA 200 and EMA 30, indicating short-term bullish momentum.
However, the suggested trade setup appears to be short (sell), anticipating a reversal from

Bitcoin (BTC/USD) Technical Analysis – Bullish Setup🔵 Key Levels:
🎯 Target Point: 87,050.22 (🔼 Expected upward move)
🔵 Support Zone: 79,833.82 (🛡️ Strong demand area)
🔴 Current Price: 82,254.27
📊 Analysis:
🔵 RBS + RBR Zone (🔄 Role Reversal Support & Rally Base Rally) - Possible entry point for a long position.
🟠 Stop Loss: Below 79,833.82 (🚨 Risk Management)
🟣 Resistance Zone: Near 83,000 (🔄 Possible short-term pullback)
📈 Strategy:
1️⃣ Price might retrace to the blue zone (support) before continuing upward.
2️⃣ If it holds, 🚀 potential rally towards 87,050.22 🎯
3️⃣ If it breaks below support, ⚠️ possible downside risk.
✅ Conclusion:
A bullish setup with a 7.45% profit target 📊
Risk managed with a stop loss below support ⚠️

basic of support and resistanceSupport occurs at the point where a downtrend is expected to pause due to a concentration of demand. Resistance occurs at the point where an uptrend is expected to pause due to a concentration of supply. Support and resistance areas can be identified on charts using trendlines and moving averages.

RSI and RSI divergenceThe RSI tool measures how fast and strong price movements are, ranging between 0 and 100. Typically, when the RSI is below 30, the asset is considered oversold; when it's above 70, it's seen as overbought. RSI divergence happens when the price and the RSI move in opposite directions

basics of technical anylasisTechnical analysis seeks to predict price movements by examining historical data, mainly price and volume. It helps traders and investors navigate the gap between intrinsic value and market price by leveraging techniques like statistical analysis and behavioral economics.

overview of financial marketsFinancial Markets include any place or system that provides buyers and sellers the means to trade financial instruments, including bonds, equities, the various international currencies, and derivatives. Financial markets facilitate the interaction between those who need capital with those who have capital to invest


XAG/USD (Silver) 4H Trading Analysis📍 Current Price: 33.0990 (Near Entry Zone)
🔹 Trading Setup:
🟢 Entry Zone: 32.97654
🔴 Stop-Loss (SL): 32.48368 ❌
🔵 Take-Profit (TP) Levels:
TP1: 33.30512 🎯
TP2: 33.62431 🎯🎯
Final Target: 34.19599 🚀
📊 Price Action Insights:
✅ Bounce from Demand Zone (Gray Box) 📈
✅ Potential Bullish Move if price holds above entry 🚀
⚠️ Risk if SL is hit (Red Box) ❌

Financial Markets Financial Markets include any place or system that provides buyers and sellers the means to trade financial instruments, including bonds, equities, the various international currencies, and derivatives.
Some examples: bank or credit unions, for loans or savings accounts. securities markets, such as the New York Stock Exchange or the American Stock Exchange, for businesses to acquire investment capital, mutual funds, or bonds.
