XAUUSD – Waiting for Trend Confirmation Around the 4,160–4,170..XAUUSD – Waiting for Trend Confirmation Around the 4,160–4,170 Zone
At the moment, gold has not shown a clearly defined medium-term trend. Price is moving around an important resistance zone, so instead of predicting direction early, I prefer waiting for price reaction at key levels before taking action.
The main focus today is the 4,160–4,170 area – where the market will decide whether to continue the uptrend or start a deeper correction.
🎯 Scenario 1 – SELL at 4,162–4,165 (Priority if No Clear Breakout)
Sell: 4.162 – 4.165
SL: 4.173
TP: 4.140 – 4.122 – 4.110 – 4.100
The 4.162–4.165 zone on H1 is a strong resistance area combining Fibonacci confluence, previous supply, and proximity to the short-term rising trendline.
If price taps this zone and shows weakness (upper-wick rejection, reversal candle, low volume confirmation), I prefer taking a short-term sell toward 4.140, with deeper targets at the liquidity cluster around 4.110–4.100.
Risk for this scenario is capped at 1–2% per trade. Do NOT hold the position if price closes above 4.173.
⭐ Scenario 2 – BUY on Break Above 4,170 (Trend Continuation Confirmation)
Buy: 4.171 – 4.173 (only after a clean breakout)
SL: 4.163
TP: 4.188 – 4.200 – 4.215
If price breaks decisively above 4.170 and sustains above it, that confirms buyers are still in control.
In this case, I switch my bias to buying the breakout, targeting the next resistance zones around 4.200–4.215, and possibly higher if momentum remains strong.
Note: Only buy if the breakout is genuine — strong candle body closing above 4.170, not a stop-hunt wick that pulls back immediately.
1. Fundamental Outlook
The DXY continues slipping below 99.50, now near 99.45, showing sustained weakness as markets increase expectations for a December Fed rate cut.
Easier monetary conditions generally support gold because the opportunity cost of holding gold is reduced.
However, U.S. initial jobless claims have dropped to the lowest level since April, showing the labour market is still resilient.
This creates a mixed environment: rate-cut expectations support gold, but strong economic data may cause sudden volatility around news releases.
Overall, fundamentals lean slightly bullish for gold, but not strongly enough to ignore potential technical pullbacks.
2. Technical Structure
On the H1 chart, after a strong rally, gold is now consolidating right below the 4.160–4.170 resistance.
The 4.162–4.165 region is a confluence zone:
• horizontal resistance
• previous supply
• area where strong selling pressure appeared earlier
The 4.140 level is the “correction confirmation level” — if price breaks and closes below it, the market will likely aim for the major liquidity area around 4.110–4.100, where many Buy-side stop losses are clustered.
The current structure allows for both long and short setups, but each scenario requires clear price confirmation at the 4.160–4.170 zone.
3. Market Sentiment & Action Plan
Both buyers and sellers are watching the same price zone — 4.160–4.170.
This makes it a high-liquidity area where stops for both sides may get swept before the market shows its real direction.
If price rejects strongly from this zone, it could be a sign of late buyers being flushed out.
If buyers hold price above 4.170, trapped short positions may fuel a short squeeze toward higher resistance zones.
My plan: I do not enter mid-range. I wait for clear signals:
• Sell at 4.162–4.165 if reversal confirmation appears.
• Buy at 4.171–4.173 after a confirmed breakout and hold above the zone.
• Always use a hard stop-loss. No widening stops if price goes against the trade.
If price breaks both zones without giving clear signals, I stay out and wait for a new structure instead of forcing a prediction.
I always read feedback to improve how I share these analyses in future posts.
Tecnicalanalysis

XAUUSD – Inverse Head and Shoulders Pattern Still Active...XAUUSD – Inverse Head and Shoulders Pattern Still Active, Continue to Prioritise Buying at POC
I maintain the view that the current dominant trend is buying based on the inverse head–and–shoulders structure, and the bullish wave is not yet complete. The plan is to wait for price to retrace into the POC zone to re-enter with the trend, avoiding chasing buys at the highs.
🎯 Main Scenario – BUY THE DIP AT POC
Buy: 4,133 – 4,130
SL: 4,123
TP: 4,155 – 4,178 – 4,200 – 4,250 – extended targets if momentum remains strong
For me, total risk per trade never exceeds 1–2% of the account. A good setup with poor risk management is still a bad trade.
1. Fundamental Context
Gold is maintaining its upward momentum, trading near its highest levels in about two weeks.
The US Dollar is weakening as markets increase bets on the Fed cutting rates soon, following data showing continued cooling in inflation.
Lower yields and a softer USD reduce the opportunity cost of holding gold, supporting the flow back into safe-haven assets.
With this backdrop, I do not prioritise large sell setups. Most pullbacks are mainly opportunities for me to accumulate long positions.
2. Technical Analysis & Market Sentiment
On the H1 timeframe, gold has formed and activated an inverse head–and–shoulders pattern, confirming a bullish reversal phase.
Price is retracing to retest the POC zone around 4,133–4,130, overlapping the previous accumulation area where heavy sell orders were absorbed. This is the zone I prioritise for buying.
Below this lies a deeper FVG acting as secondary support; however, I’m not waiting for price to drop too far to avoid missing the core move of the pattern.
Regarding price behavior, recent pullbacks have been absorbed quickly, with multiple long-wick candles showing buyers are still in control. I’m waiting for a clean pullback into POC with a strong bullish reaction to trigger the entry.
3. Action Plan
Only enter positions when price returns to the 4,133–4,130 zone — absolutely no FOMO buying at higher levels.
Take partial profits at 4,155 – 4,178 – 4,200 – 4,250, leaving the remaining position open if gold continues to extend its bullish leg.
If price breaks below 4,123 and closes under that level, I will cut the trade immediately and reassess the structure — never hold on to a bias when the market has changed.
If this analysis is helpful, follow my TradingView channel and leave your comments. I always read feedback to improve and refine my future posts.

LANA_M2 XAUUSD – WAIT FOR A PULLBACK TO BUY WITH THE UPTREND ...LANA_M2 XAUUSD – WAIT FOR A PULLBACK TO BUY WITH THE UPTREND
1. Fundamental Analysis
Gold continues its bullish momentum and has just formed a two-week high as expectations for an early FOMC rate cut strengthen.
Weaker U.S. economic data, cooling bond yields, and pressure on the USD are supporting gold, both from real-yield dynamics and safe-haven demand.
With this outlook, Lana prefers waiting for a mild correction before buying with the trend, instead of chasing buys at higher prices.
2. Technical Analysis
On the H1 chart, the market structure has shifted to bullish with consecutive BOS, confirming buyer control.
FVG demand zones around 4100 and 4080 are acting as support, aligning with key swing lows after BOS.
The upper zone around 4180–4200 is an FVG supply area and a premium/ resistance zone where price may react with a short-term pullback.
With Fibonacci confluence, 4103–4105 and 4086–4088 match the 50–61.8% retracement of the latest bullish leg — ideal for waiting for a pullback to buy.
3. Key Price Zones
Support / Discount (Demand & FVG):
4103 – 4105
4086 – 4088
Resistance / Premium (Supply & FVG):
4165 – 4194 – 4202
4. Trade Setups
⭐ Primary Scenario – Buy with the Trend
Buy entry: 4103 – 4105
SL: 3998
TP: 4115 – 4130 – 4165 – 4190
⭐ Alternative Scenario – Deep Buy at Lower FVG
Buy entry: 4086 – 4088
SL: 4080
TP: 4100 – 4125 – 4146 – 4170 – 4190
⭐ Short-term Reversal – Sell at Premium Zone
Sell entry: 4194
SL: 4202
TP: 4177 – 4150 – 4132 – 4110
👉 Follow Lana on TradingView to get the earliest gold analysis updates. 💛

LiamTrading – XAUUSD H1 | Gold forming Head–Shoulders Pattern...LiamTrading – XAUUSD H1 | Gold forming Head–Shoulders Pattern, waiting for pullback to POC for entry
Gold is completing the final bullish leg of the Head–Shoulders structure on the H1 timeframe.
Price has now reached the Fibonacci zone (both retracement + extension), which also aligns with a resistance cluster and the POC of the Volume Profile — so the current choppy reaction is completely normal.
My plan is to use this pullback:
→ prioritize short-term Buy entries following the current bullish leg,
→ then look for Sell setups at the strong resistance above.
Macro Background
Russia continues missile strikes on Kyiv right after the US–Ukraine reached a “19-point framework”, causing peace prospects to stall again.
However, secret negotiations among the US, Russia, and Ukraine in Abu Dhabi are still ongoing, though no major terms have been finalized.
With “war not stopping – negotiations not settled”, global risk sentiment remains tense.
This keeps medium–long-term demand for Gold strong.
But in the short term, price may still show wide swings around key technical zones before choosing a clearer direction.
H1 Technical Analysis – Head & Shoulders, Fibonacci, Volume Profile
The Head–Shoulders pattern is now clearly visible.
Price is currently in the right-shoulder completion phase, approaching upper resistance.
Gold at the moment is:
Hitting the Fibonacci retracement of the previous decline.
Also overlapping with the Fibonacci extension of the short-term bullish wave → high chance of reaction and volatility.
Below price, the 4090–4093 zone is a support/mini-POC area where Volume Profile thickens — ideal for a short-term Buy following the current bullish structure.
Above price, the 4185–4187 zone is a strong resistance cluster:
Confluence of potential right-shoulder top + old supply + Fibonacci extension.
This is the area I will prioritize for Sell setups once the pattern completes.
Notable Support/FVG zones:
4122–4116 (near support)
4169–4210 (mid-term FVG/resistance)
Reference Trading Scenarios
1. Buy with the current bullish wave (short-term)
Buy: 4091–4093
SL: 4085
TP: 4120 → 4145 → 4170 → 4190 → 4220
Logic:
Buy at the confluence support + small POC, taking advantage of the upward push completing the right shoulder.
Once the trade reaches +1R, shift SL to breakeven to protect capital.
2. Sell at the Head–Shoulders resistance zone (medium-term priority)
Sell: 4185–4187
SL: 4193
TP: 4170 → 4155 → 4130 → 4110
Logic:
This is a strong resistance zone overlapping the supply region and Fibonacci extension.
Only activate the Sell if H1/M15 shows clear rejection signals (pin bar, bearish engulfing, weak volume) around 4185–4187.
Additional Levels to Watch
Support – FVG: 4122–4116
Resistance – FVG: 4169–4210
Can be used for quick scalp opportunities, but the main scenarios remain:
Buy near 409x as long as major resistance hasn’t been touched.
Sell near 418x when the Head–Shoulders structure shows completion signs.

XAUUSD – TUESDAY BREAKOUT BUY SETUP, WATCH REACTIONS AT FIBO...💛 XAUUSD – TUESDAY BREAKOUT BUY SETUP, WATCH REACTIONS AT FIBO 1.618–2.618 🎯
🌤 Overview
Hello everyone, Lana here 💬
After spending several days compressed inside a triangle pattern, Gold has finally broken the descending trendline on H1, absorbed liquidity around the FVG zone, and continued to hold above the breakout area.
This shows that short-term bullish momentum is currently favored, with price targeting the higher Fibonacci extensions.
Today the market is waiting for major data releases: CPI, PPI, retail sales… These numbers can create strong volatility, especially when gold is in an “overcrowded trade” condition.
If US consumer data comes in strong, a deeper pullback may appear after a liquidity sweep.
💹 Technical Analysis (ICT Perspective)
On H1, price has:
Broken the descending trendline of the accumulation triangle.
Retested the FVG + liquidity repurchase zone around 4.101–4.105 and bounced back upward.
The 4.133–4.135 area, previously resistance, has now turned into support — a suitable zone for a buy-on-dip strategy.
Technical Targets:
Fibonacci Extension 1.618 of the current bullish leg is around 4.16xx.
Fibonacci Extension 2.618 + major liquidity pool sits around 4.23xx–4.24xx, aligning with previous highs — a zone where sellers may show strong reaction.
Overall, as long as price stays above 4.10–4.11, the short-term bullish structure remains valid.
🎯 Reference Trading Plan
💖 BUY Scenario – Priority with Trend
Buy on breakout – current price zone
Entry: 4.130–4.133
SL: 4.125
TP: 4.150 → 4.175 → 4.198 → 4.230
Buy on deeper retest
Entry: 4.100–4.103
SL: 4.095 (you may choose a tighter SL instead of 3.995 for better R:R)
TP: 4.125 → 4.150 → 4.175 → 4.198
💢 SELL Scenario – Only Short-Term Reaction at Resistance
Sell: 4.167–4.169
SL: 4.175
TP: 4.150 → 4.133 → 4.110 → 3.990
This Sell setup is only for short-term scalping against the trend — priority is to close quickly at nearby TP levels.
⚠️ Important Notes
Today includes CPI, PPI, retail sales and other US data — spreads may widen and price can spike both ways.
Gold is currently a crowded trade, so after strong rallies, deeper washout moves can occur to shake out weak positions.
Best strategy:
Prioritize Buy setups at confirmed support zones.
Reduce position size before major news; avoid holding heavy trades through data releases.
Treat Sell setups only as fast in–fast out scalps.
🌷 5. Conclusion & Interaction – With LanaM2
In summary, the breakout from the H1 triangle supports the scenario of Gold continuing upwards toward the Fibo 1.618–2.618 extension levels, as long as price stays above 4.10–4.11 💛
Today, focus on finding clean Buy entries instead of chasing price, and be cautious during CPI & PPI releases.
If you found this useful, please 💛 Like – 💬 Comment – 🔔 Follow LanaM2 to get daily Gold insights on TradingView ✨

HOW FAR WILL GOLD RISE?
1. MARKET CONTEXT
Yesterday, during the Asian and European sessions, gold prices mainly moved sideways – accumulating within a narrow range.
In the U.S. session, gold prices broke strongly through the 413X region and formed:
Inverse Head and Shoulders pattern (iH&S)
The upward structure returns → buyers dominate
This indicates that the upward momentum has returned, and the market leans towards continuing to rise if it does not break the important support area.
Fundamental factors supporting buyers
The market is expecting the Fed to cut interest rates in December.
Tonight there is PPI news — an important indicator directly affecting inflation expectations and Fed expectations.
→ This could be a catalyst for strong volatility in the U.S. session.
2. MAIN TRADING DIRECTION FOR THE DAY
➡️ Prioritize BUY (look to buy) according to the main trend.
➡️ SELL is only reactive – for retracement, not the main trend.
3. POTENTIAL BUY ZONES
Beautiful support areas to look for buying opportunities today:
📍 BUY zone 1 – Nearest
413X (early day resistance and yesterday's breakout area)
→ Beautiful entry area for scalping or buy follow trend.
📍 BUY zone 2
4100 – 4103
→ Psychological support & structural confluence area.
📍 BUY zone 3
4088 – 4090
📍 BUY zone 4
4060 – 4065
→ Strong support area, look to catch the bottom in case of deep price correction.
4. REACTIVE SELL ZONES (ONLY SELL FOR RETRACEMENT)
Only sell when price hits the area — clear rejection signals appear:
📍 SELL zone 1 (nearest)
4180 – 4186
📍 SELL zone 2
4190 – 4195
📍 SELL zone 3
4202 – 4205
Safe SELL conditions:
Only sell counter-trend, prioritize scalping.
If these areas are strongly broken + H1/H4 candle closes, consider buyers winning, then do not sell anymore.
5. CAPITAL MANAGEMENT – RISK MANAGEMENT
SL = 10 points
TP = 10 points
RR ratio = 1:1.2
Do not hold positions through PPI news if not really sure about the pattern.
6. NOTES ON METHOD
Buy orders will dominate the day.
Sell only when there is a strong reaction at resistance.
Scalping: open orders on smaller timeframes (M1–M5–M15) to optimize Entry.
Always wait for price action confirmation (pinbar, engulfing, retest…) before entering orders.
7. SUMMARY
Today's tendency is mainly BUY, based on:
The return of the upward trend
Inverse Head and Shoulders pattern
Expectations of a dovish Fed
PPI news triggering volatility
Wishing everyone an effective trading day — total victory! 🔥💹

LiamTrading – XAUUSD H1 | Monday SetupLiamTrading – XAUUSD H1 | Monday Setup
Wait for gold to retest the upper trendline before choosing a direction
Quick Overview
On the H1 timeframe, gold is still moving inside a triangle pattern with a descending upper trendline and a gradually rising lower trendline. In my view, price still needs a bullish swing to retest the upper trendline – which aligns with the FVG zone + Volume Profile POC – before deciding a new trend (either a breakout to the upside or a reversal downward).
Regarding the USD, many Fed officials have begun signaling that rate cuts may happen, but they remain very cautious. UBS and Barclays both lean towards the scenario that the Fed could cut rates in December if upcoming data continues to weaken. This limits the USD’s ability to strengthen too much, giving gold room for a technical pullback into resistance zones.
H1 Technical Analysis
Current structure: price is consolidating sideways, with lower highs along the descending trendline and higher lows supported by the lower trendline.
Zone 4079–4081:
FVG + Volume Profile POC.
This area aligns with the upper trendline → a strong confluence resistance zone, suitable for a reaction-based short setup.
Nearest support zone: around 4040–4035; if this level breaks, price may likely head back to retest 4010–4000.
A clear bullish reversal signal only forms if an uptrend structure returns, at least when price breaks and holds above 4061, then continues through the descending trendline.
Trading Scenarios (Reference Only)
Sell at FVG + POC + Trendline (Priority setup)
Entry: 4079–4081
SL: 4086
TP: 4060 → 4045 → 4010
Logic: Price is expected to move up to fill the FVG and touch the POC/trendline before sellers step back in. This zone has strong confluence, offering a better win rate than shorting inside the sideway range.
Buy when bullish structure is confirmed
Conditions: Price must break above 4061, close an H1 candle holding above this level, and break out of the descending trendline.
Entry (reference): 4061–4068 (retest of breakout zone)
SL: 4050
TP: 4095 → 4130 → 4150
In this case, the triangle pattern breaks upward, Dow Theory bullish structure returns, and the priority is buying with the new trend rather than trying to short the top.
Trading Notes
Possible scalp levels: 4060, 4040, 4010, 4130 – always wait for clear candle reactions on M5–M15 before entering.
Risk per trade: 0.5–1% of account size; once the trade reaches around 1R, move SL to breakeven to protect your capital.
If you have a different scenario for XAUUSD H1 today, leave a comment and follow LiamTrading for daily gold strategies on TradingView.

LiamTrading – XAUUSD H1 | Gold breaks bullish structure...LiamTrading – XAUUSD H1 | Gold breaks bullish structure, short-term downside takes control
Gold has dropped sharply by more than $20 in a short time, losing over 1% on the day and moving close to the lower 4,030 area. The previous bullish structure has officially been broken, 4040 failed to hold, and today’s focus continues to be selling with the trend until the 4000–398x support zone shows clear reactions.
Macro Analysis
Gold prices declined as expectations for a December rate cut weakened: JPMorgan no longer forecasts a Fed rate cut in December, opposite to their earlier 25 bps cut scenario.
Some institutions still believe rising unemployment and weaker economic data may force the Fed to cut 25 bps at the upcoming meeting.
The market is currently pricing the probability of a December rate cut at nearly “50–50,” creating strong uncertainty and putting short-term pressure on gold, even though the metal still benefits in the long term if the rate-cut cycle begins.
Technical Analysis H1 – Bearish structure, price channel, and support zones
After breaking below 4040, price formed a series of Lower Highs – Lower Lows, confirming a Dow-theory bearish structure on H1.
A falling channel is forming; the channel’s upper boundary aligns with the short-term resistance zone at 4050–4060.
4000 zone: a key psychological support. If broken decisively, the medium-term structure may shift into a deeper corrective phase.
Buy Zone 3987–3989
Strong support confluence + Fibonacci extensions (1.618/2.272) of the current bearish swing
Optimal area for catching a corrective bounce if clear reversal signals appear
Key Resistance Levels Today
4052–4054: retest of former support + upper boundary of falling channel → ideal area for a pullback-sell setup.
Trading Scenarios Today (LiamTrading)
Scenario 1 – SELL with the prevailing downtrend (priority)
Entry: 4052–4054
SL: 4060
TP: 4030 → 4015 → 3990
Logic: Price retraces to resistance + channel top, suitable for trend-continuation selling. Prefer setups where M15 shows rejection candles (pin bar/bearish engulfing) around 405x.
Scenario 2 – BUY at strong support 398x (counter-trend bounce)
Entry: 3987–3989
SL: 3980
TP: 3999 → 4014 → 4040 → 4080
Logic: 398x is a high-confluence support zone; trigger only when clear price reaction appears (long lower wicks or reversal patterns on M15–H1).
This is counter-trend, so use smaller position sizes and take partial profits.
Risk Notes & Invalidation
H1 closes above 4060: short-term bearish structure weakens → pause all sell setups and reassess.
H1 closes below 3980: buy zone fails → downside could extend further; only sell setups preferred.
Always keep risk per trade at 0.5–1%, and once reaching +1R, move SL to break-even.
Are you leaning towards continuing to sell with the trend, or waiting to buy the dip at 398x?
Follow LiamTrading on TradingView for daily XAUUSD updates

LiamTrading – XAUUSD H1 | A bearish structure has formed...LiamTrading – XAUUSD H1 | A bearish structure has formed, waiting for confirmation during the European session
Overall, gold is in a corrective downtrend after the previous bullish move. On the H1 timeframe, a clear Dow bearish structure (lower highs, lower lows) has formed. However, the support zone around 4,030 and the lower Fibonacci cluster are still potential areas where buying pressure may appear. Today’s European session will be crucial to confirm whether price continues to drop deeper or bounces back, aligning with the inverse head-and-shoulders pattern developing on H4.
Macro – Short Fundamental Outlook
The minutes from the Fed’s October meeting revealed a strong internal division:
One group opposed rate cuts and wanted to maintain current levels.
The other group supported cutting rates and even suggested further reductions in December.
This lack of consensus shows high uncertainty in monetary policy, encouraging defensive flows to continue favouring gold. In the long run, gold only surges when confidence in the financial system weakens — a gold price peak is not a sign of prosperity but a warning signal.
Technical Analysis – H1 (trendline, Fibonacci, liquidity)
Price is trading below the short-term descending trendline, confirming that the bearish phase remains active.
The 4,082–4,090 zone is an important liquidity zone — repeatedly tested and now acting as near-term resistance.
The 4,029–4,031 cluster is a key support area:
Overlaps with technical support + Fibonacci retracement.
Beginning of the large FVG that extends down to 3,985 (Fibo 1.618 + psychological support).
Above current price, the 4,129–4,130 zone is strong resistance. If price breaks and holds above this area, the bearish Dow structure will weaken significantly.
Suggested Trading Scenarios
BUY Scenario – Buying at Support / Fibonacci
Logic: Price holds above the support–Fibonacci zone, showing bottom-fishing demand.
Entry BUY: 4,029–4,031
SL: 4,022
TP: 4,040 → 4,065 → 4,090 → 4,120
Only consider buying if price shows strong reaction at 4,029–4,031 (long wick rejection or clear reversal candle on M15–H1).
Cancel this BUY plan if H1 closes below 4,022.
SELL Scenario – Following the current bearish structure (preferred if trendline remains intact)
Logic: Price retraces to resistance + descending trendline and gets rejected.
Entry SELL: 4,098–4,100
SL: 4,105
TP: 4,088 → 4,070 → 4,035 → 4,000–3,985
Only sell if price touches 4,098–4,100 with clear rejection (bearish pin bar/engulfing).
If H1 closes above 4,105 and breaks the trendline strongly, stop all sell setups and reassess.
Key Levels for Scalping
4,082 – 4,060 – 3,985 – 4,129
These levels can be used for quick intraday trades, but reduce position size and take profit fast.
Important Notes
If price closes firmly above the descending trendline and holds above 4,090–4,100, bias will gradually shift toward BUY setups, as an inverse head-and-shoulders pattern is forming on H4.
If the 4,029–4,022 support breaks decisively, gold is likely to drop toward the FVG and Fibonacci 1.618 zone around 3,985.
What scenario are you leaning toward for gold today — a pullback for another sell, or holding the bottom for a rebound? Leave your view in the comments and follow LiamTrading for daily XAUUSD updates on TradingView.

XAUUSD – CLEAR INVERSE HEAD & SHOULDERS FORMATION, CONTINUE ...💛 XAUUSD – CLEAR INVERSE HEAD & SHOULDERS FORMATION, CONTINUE TO PRIORITISE BUY SETUPS 🎯
🌤 1. Overview – Today’s Market Picture
Hello everyone, Lana here again 💬
During the Asian session this morning, gold completed the right shoulder of a very clear Inverse Head & Shoulders pattern on the H3/H4 timeframe. Those who bought following the previous setup are now in a favourable position, and in my view, this is still a good time to hold Buy positions and prepare for additional entries once the market confirms the trend.
On the macro side, according to the CME FedWatch tool, the probability of the Fed cutting rates by 25bp in December has dropped to around 30–33%, while the likelihood of keeping rates unchanged remains dominant.
This means the USD is not weak enough to push gold sharply higher, but also not strong enough to suppress it—creating a volatile range-bound environment, which is ideal for technical-pattern trading.
💹 2. Technical Analysis – Inverse Head & Shoulders & Market Structure
The Inverse Head & Shoulders pattern has formed quite cleanly:
Left shoulder → Head → Right shoulder, all supported by the long-term ascending trendline.
The demand zone around 4040–4050 is acting as a liquidity box supporting the entire structure.
The neckline is currently around 4089–4090:
Once price breaks above and closes above 4089, we can consider a confirmed bullish trend.
After the breakout, gold may extend toward 4145 → 4200, which aligns with higher liquidity zones + upper FVGs.
Zone 4130–4132:
A major liquidity cluster—where many take-profit orders & short-term sell orders may appear.
If this zone is broken decisively, price may accelerate quickly toward 4200.
Zone 4040:
This is both the bottom of the pattern and a key support.
The bullish structure fails if gold closes below 4040 on H4, which would invalidate the Inverse H&S pattern.
Overall, price is currently compressing right below the neckline, and just one strong breakout could trigger the next bullish wave.
🎯 3. Reference Trading Plan (For Study Purposes Only)
💖 Primary BUY Scenario – Following the Pattern
1️⃣ Buy on retracement to support
Entry: 4060–4063
SL: 4055
TP: 4088 → 4108 → 4130 → 4143 → 4200
2️⃣ Buy the neckline breakout
Condition: Price breaks the descending trendline & neckline, and closes above 4089.
Entry: around 4089–4092
SL: 4080
TP: 4132 → 4145 → 4200
💢 Notes on SELL Setups
Selling now is counter-trend against the pattern and not the priority.
Consider only short-term sells if:
Price reacts strongly at 4132–4145, and
Clear bearish signals appear on M15–M30 (pin bar, bearish engulfing, rising sell volume).
⚠️ 4. Fundamental Factors to Watch
High probability that the Fed keeps rates unchanged → market may stay flat before data releases, then spike in volatility.
Gold remains sensitive to data: employment, inflation, and speeches from Fed officials.
🌷 In summary
The Inverse Head & Shoulders on XAUUSD supports the bullish scenario as long as price stays above 4040 💛
Strategy:
Prioritise Buy setups: first at 4060–4063, then on the breakout above 4089.
Watch the 4132–4145 zone closely—if broken, the move toward 4200 becomes highly probable.
If you found this analysis helpful, don’t forget to 💛 Like – 💬 Comment – 🔔 Follow LanaM2 for daily gold updates!

LiamTrading – XAUUSD H1 | Gold Holds 0.618, Bullish Scenario...💛 LiamTrading – XAUUSD H1 | Gold Holds 0.618, Bullish Scenario Preferred for Wednesday 🎯
Gold continues to recover after the previous decline and is currently sitting right at the 0.618 Fibonacci level on the H1 timeframe — indicating buyers still have the upper hand. Price is also holding above the rising trendline and the thick Volume Profile area around 407x, so for today’s session, I continue to prioritise BUY setups in line with the trend.
📰 Macro – News Context
After the U.S. government reopened, the market is preparing for a series of economic data today and tomorrow → both USD and Gold may experience strong volatility.
President Trump attacked Fed Chair Powell, calling him “stupid and incompetent,” saying he once wanted to fire him immediately but was stopped by advisors.
👉 Because of this, market sentiment is very sensitive: if data leans towards a rate-cut scenario, Gold could gain additional support.
📊 Technical – H1 with Fibonacci, Trendline & Volume Profile
Fibonacci 0.618: Price is holding at the 0.618 level of the latest downswing; if this level holds, the natural target will be the upper FVG + resistance zone 4120–4150.
H1 Uptrend Line: The trendline from the recent low is supporting price very well; each retest generates a bullish reaction → an ideal area to wait for BUY entries.
Volume Profile & Liquidity:
The 4075–4080 zone is Buy Liquidity — thick volume, lots of order flow → suitable as an entry point if price retests.
VAL ~4040 and the Support + FVG area around 4020 are the next defence zones if the market sweeps deeper.
Upside liquidity:
Past H1 FVG remains unfilled up to at least 4150, so if the bullish scenario plays out, Gold can easily extend into this zone.
🎯 Trading Scenarios (LiamTrading)
1️⃣ Primary Setup – BUY with Trend
Entry: 4078–4080 (trendline retest + strong volume cluster)
SL: 4073
TP: 4094 → 4120 → 4140 → 4175
💡 Notes:
Wait for a clean M5–M15 bullish reaction (long lower wick, pin bar, or bullish engulfing) around 4078–4080 before entering.
Once price moves ~1R in profit, move SL to breakeven for account protection.
2️⃣ Short-term Scalping Zones
Support – quick buys: 4048–4023 (VAL + lower FVG zone).
Resistance – quick sells: 4121–4151 (FVG + upper liquidity zone).
These are only for scalping, so:
Enter on smaller timeframes (M5–M15).
Take profits quickly, avoid holding through major news.
✅ Summary
Short-term trend: Bullish bias as long as price holds above the H1 trendline and the 0.618 zone.
Main plan: Wait for BUY at 4078–4080, targeting 4120 → 4140 → 4175.
So, what do you think — will Gold push straight to 4150, or will it sweep down toward 404x first?
👉 Share your view in the comments & Follow LiamTrading to get daily XAUUSD plans on TradingView.

XAUUSD – Head & Shoulders Pattern Forming on H4 💛 XAUUSD – Head & Shoulders Pattern Forming on H4 🎯
🌤 Overview
Hello everyone, Lana here again 💬
After a strong drop, Gold is forming a clear Head & Shoulders structure on the H4 timeframe, aligned with the long-term ascending trendline. This pattern suggests the possibility of a bullish move back toward previous highs — but price may still dip lower to complete the structure first.
💹 Technical Analysis (ICT Perspective)
The Left Shoulder – Head – Right Shoulder is gradually shaping around the trendline + supporting FVG.
The upper 50% Fibonacci area is a reasonable zone for the right shoulder to form. If price breaks above the neckline, it may head toward the major liquidity zone around 4200.
In the short term, the 4118–4120 zone serves as resistance + neckline, making it suitable for a technical Sell setup.
The 4040–4042 area aligns with the trendline + Order Block, forming a strong support zone for potential Buy entries if price makes a deeper correction.
🎯 Trading Plan (For Reference Only)
💢 SELL Scenario (scalping at resistance)
Sell: 4118–4120
Stop Loss: 4125
Take Profit: 4105 → 4086 → 4060 → 4040
💖 BUY Scenario (preferred with the main pattern)
Buy: 4042–4040
Stop Loss: 4034
Take Profit: 4075 → 4090 → 4100 → 4140 → 4200
⚠️ Important Notes
Trading based on patterns is always expectation-driven, so combine it with candlestick confirmation on smaller timeframes (M15–M30) before entering.
Upcoming FOMC Meeting and NFP report, especially after the long U.S. government shutdown period, may cause unpredictable volatility.
Reduce position size and avoid holding large trades during major news events.
🌷 Final Thoughts from LanaM2
The H4 Head & Shoulders pattern on Gold is offering attractive opportunities for both short-term Sells and trend-aligned Buys 💛
Stay patient, wait for price to reach the marked zones, follow your stop-loss rules, and avoid FOMO during high-impact news.
If you found this helpful, please 💛 Like – 💬 Comment – 🔔 Follow LanaM2 for daily Gold insights!

LiamTrading – XAUUSD H1 | Gold on a downward trend, hitting ...💛 LiamTrading – XAUUSD H1 | Gold on a downward trend, hitting strong support around 4005 🎯
Gold has plunged from its peak, currently “visiting” the 4005–3990 zone, where trendline + POC/OB + high liquidity converge. This is a zone where a technical rebound might occur, but the short-term trend remains bearish, so any BUY orders need to wait for clear confirmation.
🔍 Fundamental Analysis
Goldman Sachs forecasts that during 2025–2026, central banks will purchase an average of ~80 tons of gold per month, a significant driver that could push gold towards 4,900 USD/oz by the end of 2026.
This keeps the long-term trend of gold bullish, but in the short term, deep corrections like the current one are normal to “shake off” positions before big money returns.
📊 Technical Analysis
Current trend:
H1 is still in a short-term downtrend phase (lower high – lower low), with prices below the 4080–4100 resistance zone and below the nearest descending trendline.
Main support zones:
4005–3990: intersection of long-term rising trendline, POC – OB, old VAH/VAL zone → crucial support, potential for bottom-fishing buying force.
3975–3977: deeper support, coinciding with liquidity zone & recent low.
Key resistance zones:
4098–4100: confluence of resistance + trendline test → ideal zone to watch for SELL retracement.
Above is the cluster 4011 – 4053 – 4077 – 4098–4100 acting like “steps” for scalping orders.
Volume Profile:
Heavy trading volume around the 4000–4020 zone → prices tend to revisit this area multiple times before moving away.
🎯 Reference Trading Scenarios
SELL – following the downtrend (priority)
Entry: 4098–4100
SL: 4105
TP: 4082 → 4060 → 4035 → 4012
Price retraces to resistance + descending trendline.
Only trigger when M15–H1 shows clear rejection candles (pin bar/bearish engulfing) around 4098–4100.
BUY – catching the rebound at strong support
Entry: 3975–3977
SL: 3970
TP: 3995 → 4025 → 4050 → 4080
Confluence support zone at channel bottom + POC/OB + liquidity.
Only BUY when there is strong rejection or a clear reversal pattern (M15–H1).
⚠️ Price zones to watch for scalping
4011 – 4053 – 4077 – 3939
These zones are suitable for short scalps, prioritising the main trend (currently bearish), quick exits – do not hold positions too long.
🧠 Risks & Invalidations
H1 closes above 4105 → reduces SELL priority, wait for new structure.
H1 closes below 3970 → bad structure for BUY side, potential for further decline to lower zones.
Are you watching to BUY or SELL gold in this zone?
👉 Comment your perspective & Follow LiamTrading channel for daily XAUUSD plans.

XAUUSD – TWO MAIN SCENARIOS FOR THE DAY: MONITOR REACTION AT...💛 XAUUSD – TWO MAIN SCENARIOS FOR THE DAY: MONITOR REACTION AT TRENDLINE 🎯
🌤 1. Overview
Hello everyone 💬
Gold is currently waiting at the H4 trendline, indicating the market is lacking volume to decide the next direction.
Although the price is adjusting after the drop from the 4,400 USD zone, the larger trend is still supported by strong buying flows from central banks.
💹 Market Context
According to Goldman Sachs, the current decline is only temporary, as the demand for gold as a safe haven asset remains strong:
US bond yields are falling
USD is weakening
The US economy is under pressure from unemployment and inflation
In September alone, central banks purchased 64 tonnes of gold, and forecasts suggest that November may continue this strong accumulation trend.
💹 Technical Analysis
📉 If Gold breaks below the trendline → the market will trigger strong selling pressure, pulling back to the 395x zone, where there is low liquidity and important support.
📈 Conversely, if the price holds the trendline and volume pushes up, a short-term upward structure will form.
📌 The 4068 zone is a key level — if the price retests this area and falls back, Buy will only activate when it reaches 4034.
🎯 Reference Trading Scenarios
🔻 SELL – When breaking the trendline (priority if volume is strong)
Sell 4036–4038 │ SL: 4044
TP: 4010 → 3995 → 3970 → 3945
🔹 BUY – Strong support 395x
Buy 3952–3954 │ SL: 3957
TP: 3975 → 3995 → 4030
🔸 BUY maintaining trend (if price rebounds at 4068)
Buy at 4034 after confirmation signal
⚠️ Important Note
Volume is currently low, making the market prone to stop sweeps, so enter orders with small volume.
The larger trend is still supported by flows from central banks, but in the short term, Gold may fluctuate strongly around the trendline.
Prioritize trading based on price reactions at key zones rather than predicting direction in advance.
🌷Gold is in a sensitive phase at the H4 trendline 💛
If you find this useful, please 💛 Like – 💬 Comment – 🔔 Follow LanaM2 to receive daily gold analysis ✨

LiamTrading – XAUUSD H1 | Continue to watch for SELL at the ...LiamTrading – XAUUSD H1 | Continue to watch for SELL at the start of the week – wait for price to retrace to the trendline & resistance for a perfect entry
Gold is experiencing a sharp decline amidst global market liquidity pressures. The simultaneous drop in gold, stocks, and Bitcoin indicates that capital is being withdrawn from risky assets and even safe havens, similar to tense periods like the 2008 crisis or the early 2020 pandemic. Investors are selling profitable assets to cover losses elsewhere.
In the long run, gold usually recovers sooner, but in the short term, the downtrend still prevails.
On H1, the price is below the descending trendline, under the 4100 resistance, and is moving in a clear Lower High – Lower Low structure. This is a good signal to continue prioritising SELL orders retracing to resistance.
🔍 Technical Analysis (Trendline • S/R • Fibonacci • Liquidity)
The descending trendline is the biggest barrier; each time the price hits the trendline, it is strongly rejected.
Main Resistance:
4098–4100: resistance area + confluence with the trendline.
4120–4130: stronger area if the price retraces deeply (close to Fibo 0.382).
Target Support:
4065: intermediate support – where the price has bounced slightly several times before.
4040 – 4025: large liquidity area – confluence with the H1 FVG bottom.
3985–3995: the end zone of the down wave if the selling force expands.
Liquidity Zone:
Many liquidity sweep bottoms continuously → indicates that the selling force still prevails.
The lower FVG area (around 4025–4040) is highly likely to be filled within the week.
📉 Trading Scenario (prioritise SELL retracement)
Scenario – SELL retracement to trendline + resistance (priority)
Entry: 4098–4100
SL: 4106
TP: 4088 → 4065 → 4040 → 4025
💡 Suggestion: Wait for M5–M15 to form a rejection candle (pin bar / bearish engulfing) before executing the order.
When to BUY?
Only BUY if:
H1 closes above 4120, breaking the descending trendline → short-term trend phase change.
If this signal is not present → do not rush to buy against the trend.
⚠️ Important Note
The phenomenon of “selling everything to hold cash” may continue → gold may remain under pressure in the short term.
Which price range are you watching for today's session?
Comment below & Follow LiamTrading channel for the fastest updates!

XAUUSD – UPDATE ON SCENARIO AFTER WEEKLY OPEN💛 XAUUSD – UPDATE ON SCENARIO AFTER WEEKLY OPEN 🎯
🌤 Overview
Hello everyone 💬
Gold prices at the start of the week are mostly unchanged, the price structure on H4 remains the same, so Lana continues to maintain the old trading strategy.
Currently, gold is weakly reacting around the medium-term resistance area, not strong enough to break through – but also no clear reversal signals.
💹 Technical Analysis
📉 Prices are moving within a narrow range between key liquidity zones:
Zone 4138–4140 is the near resistance, where the market has repeatedly reacted with declines.
Zone 4200 coincides with confluence fibo + descending trendline – strong resistance.
Zone 3990–3988 is important support, also a lower liquidity area, suitable for technical rebound Buy.
Market liquidity is weak, as shown by the pin bars and narrowing range.
🎯 Reference Trading Plan
💢 SELL (priority on correction rhythm)
4138–4140 | SL: 4146 | TP: 4120 → 4105 → 4089
4200 | SL: 4212 | TP: 4185 → 4160 → 4133
💖 BUY (strong support)
3990–3988 | SL: 3984 | TP: 4002 → 4032 → 4060
⚠️ Market Insight (Macro Insight)
Gold declines simultaneously with US stocks and Bitcoin, indicating a lack of liquidity across the market.
This behaviour is common during phases like:
Financial Crisis 2008
Early pandemic panic 2020
Investors are forced to sell even profitable assets to cover losses, causing gold – despite being a safe haven asset – to also decline. This reflects a strong increase in cash demand and widespread fear.
🌷 Conclusion with LanaM2
Gold is moving within a tight range and is heavily dependent on liquidity 💛
If you find this useful, please 💛 Like – 💬 Comment – 🔔 Follow LanaM2 for daily gold analysis ✨

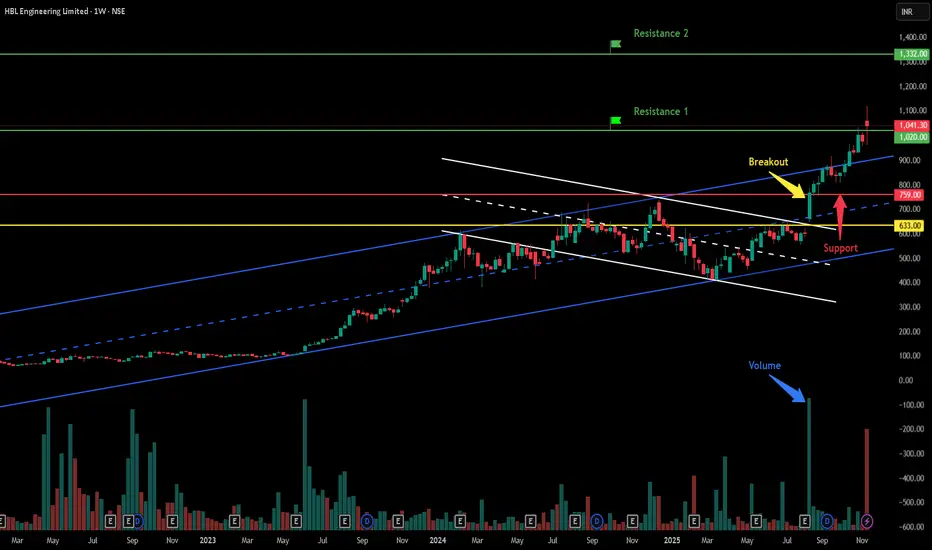
HBL Engineering Ltd - Breakout Setup, Move is ON...#HBLENGINE trading above Resistance of 1020
Next Resistance is at 1332
Support is at 759
Here is previous chart:
Chart is self explanatory. Levels of breakout, possible up-moves (where stock may find resistances) and support (close below which, setup will be invalidated) are clearly defined.
Disclaimer: This is for demonstration and educational purpose only. This is not buying or selling recommendations. I am not SEBI registered. Please consult your financial advisor before taking any trade.
LiamTrading –XAUUSD H1|Gold approaches trendline – ready to...LiamTrading –XAUUSD H1|Gold approaches trendline – ready to explode, waiting for a breakout to choose direction!
Gold is moving close to the lower trendline of the upward channel, indicating an accumulation state – waiting to choose direction. The price hasn't broken the 4210 resistance zone, but neither has it breached the trendline, so today's fluctuation will revolve around this structure.
If the buying force is strong enough and closes the H1 candle above 4210, the upward trend will be reactivated with a broader target. Conversely, if the price breaks below the trendline, gold may decline to the POC area according to Volume Profile/Fibonacci around 4126–4130, where signals to buy again according to the main trend will be prioritized.
🔍 Technical Analysis (Volume Profile • Trendline • S/R • Fibonacci)
H1 Upward Channel: Price is testing the trendline for the second time → a pullback bounce may appear if the selling force is weak.
Strong Resistance:
4210: hard resistance – needs to break to confirm the rise.
4230: extended area, coinciding with the channel peak – likely to have a strong reaction.
Important Support:
4174: intermediate support; breaking this level will trigger a short-term decline.
4126–4130: POC + large liquidity according to Volume Profile – the best buying area if a deep correction occurs.
Market Sign: Weak candle force in the 4180–4190 area indicates gold is waiting for USD information before breaking direction.
📈 Daily Trading Scenarios
Scenario 1 – Buy according to trend (priority)
Entry: 4126–4128 (POC + Volume Profile support)
SL: 4120
TP: 4140 → 4156 → 4180 → 4198
Suggestion: Wait for a rejection candle or reversal pattern at 412x.
Scenario 2 – Sell when breaking trendline (counter-trend)
Condition: H1 breaks below trendline + failed retest
Entry: 4174–4176
SL: 4182
TP: 4150 → 4135 → 4110
Note: Only sell when there is a confirmation candle; this is a short-term surfing order.
Scenario 3 – Buy when breaking and holding above 4210 (Break & Retest)
Entry: 4212–4216
SL: 4202
TP: 4230 → 4260 → 4285
🌍 Macro Analysis – USD under pressure from new tariff plans
President Trump is preparing to cut tariffs on goods from many Latin American countries (beef, bananas, coffee…).
Objective: reduce domestic food prices, lower import costs.
This could weaken the USD when officially announced → gold benefits in the medium term.
⚠️ Invalidation Condition
H1 closes below 4120 → losing upward structure, may slide to 4090–4100.
H1 closes above 4230 → cancel all sell orders, prioritize buying according to breakout.
Which price area are you observing?
Please comment below & hit Follow on LiamTrading channel to receive the earliest analysis every day!

XAUUSD – H1: PRIORITISE BUY ACCORDING TO PRICE CHANNEL...💛 XAUUSD – H1: PRIORITISE BUY ACCORDING TO PRICE CHANNEL, WATCH FOR ADJUSTMENT MOVES 🎯
🌤 Overview
Gold is maintaining its upward channel on H1 → main mindset: hold Buy longer than Sell.
Asian–European sessions present multiple liquidity clusters suitable for scalping and optimising entry points.
Fundamentals: DXY retreats around 99.15, market reduces expectations of Fed rate cut in December; Fed's Collins hints rates may remain unchanged longer → gold's range may experience short-term fluctuations.
💹 Technical (ICT view)
H1 upward channel maintains a structure of higher lows; the lower trendline is the main support.
4163–4165: confluence of trendline + liquidity (ideal Buy entry point).
4130–4133: deeper support; below that is the 4100–4080 zone (medium-term support; around Fibo ext 1.618 ≈ 4114 and 2.618 ≈ 4054).
Nearby resistance: 4215–4225; a decisive break opens up to 4260.
🎯 Trading Plan Reference
Buy #1 (priority): 4163–4165 │ SL 4157 │ TP 4180 → 4195 → 4220 → 4260
Buy #2 (deeper support): 4130–4133 │ SL 4125 │ TP 4150 → 4175 → 4190 → 4220
Sell (only with confirmation):
Scenario A: M15/M30 gives strong rejection signal at 4215–4225 → SL 4230 │ TP 4200 → 4188 → 4165.
Scenario B: H1 closes below 4157 (breaks structure) then fails retest → target 4135 → 4115 → 4100.
⚠️ Risk Management Notes
Prioritise Buy according to trend; Sell orders are only short-term reactions.
Use M15/M5 to time entries at the specified zones.
If H1 closes below 4125, consider narrowing buy positions, wait for the 4100–4080 zone.
🌷 Conclusion
H1 upward channel still guides the flow 💛. Patiently wait for adjustments to 4163–4165 or 4130–4133 to buy according to trend, manage orders tightly as price approaches 4215–4225.
If useful, please 💛 like – 💬 comment – 🔔 follow LanaM2 for daily gold updates ✨

LiamTrading – XAUUSD M45 | Fibonacci perspective on the ...LiamTrading – XAUUSD M45 | Fibonacci perspective on the upward wave: watch for sell at 2.618 @ 4229–4231, wait to buy at FVG 4174–4172
Quick context: News of the US government reopening eases tensions, but gold prices in the Asian session this morning only rose slightly before moving sideways – accumulating. On M45, the triangle has broken upwards but buying momentum hasn't truly exploded; the market may test the price gap areas (FVG) before choosing the next direction.
Technical Analysis
Trendline & M45 structure: The rise after breakout is running along the short-term upward trendline; the old triangle peak becomes resistance near 4215.
Fibonacci Extension:
2.272 ≈ 4215: pivot point; staying above this opens the path for higher levels.
2.618 ≈ 4229–4231: extended resistance – a zone prone to rejection/short reversal.
FVG & Liquidity Zones:
FVG #1: 4195–4198 – likely to fill before continuing upwards.
Liquidity: 4184–4188 – volume attraction zone between FVG and trendline.
Fibo 0.618 + FVG: 4172–4174 – strong confluence for the buyback scenario in line with the trend.
Invalidation point: breaking 4166 weakens the M45 upward structure, risking a pullback to lower zones.
Trading Scenarios
Scenario 1 – Trend-following Buy (priority)
Entry: 4172–4174 (Fibo 0.618 + FVG)
SL: 4166
TP: 4190 → 4215 → 4240 → 4280
Note: Prioritise when a clear rejection candle/lower wick appears at 417x.
Scenario 2 – Counter-trend Sell scalp at extended resistance
Entry: 4229–4231 (Fibo 2.618)
SL: 4236 (above the nearest peak)
TP: 4215 → 4196 → 4186 → 4175
Note: Quick scalp; abandon if M45 closes strongly above 4231–4233.
Scenario 3 – Buy on break & hold of 4215 (break & retest)
Condition: M45 closes above 4215, retests holding 4212–4216
Entry: 4216–4218
SL: 4207
TP: 4229–4231 → 4260 → 4285–4300
Which price zone do you find noteworthy today? Comment below & hit Follow on LiamTrading channel for the latest updates.

XAU/USD OUTLOOK – TODAY 13/11/25
The US House has approved the reopening of the government, now just awaiting President Trump's signature. This means US economic data will gradually be released again, promising a week of strong and unpredictable fluctuations.
In terms of technicals, gold maintains an upward trend after breaking the H4 sideway boundary, but signs of overbought conditions and H4 peak divergence are emerging.
In smaller time frames (M30 – H1), slight divergence is also beginning to appear, so BUY positions need to be selected carefully, avoiding FOMO. SELL should only be short-term reactive trades.
🎯 Scenario for the day
Morning
Expecting sideway ~30 points within the 4180 – 4212 range
You can WATCH FOR TRADES WITHIN THIS RANGE
if the price breaks through 4212, then wait for a retest back to 4205 to buy up.
Afternoon
Wait for gold to adjust to reasonable BUY zones:
4160 – 4162
4152 – 4148
4123 – 4120
If a strong adjustment occurs:
Beautiful BUY at 4070 – 4040 (deep support zone).
🎯 Target increase:
4280 – 4285
4300 – 4305
🎯 Reactive SELL:
4255, 428X, 430X
(SL 10 – TP 10)
⚠️ Important Note
The overall trend is still uptrend, but attention is needed:
H4 shows signs of overbought + peak divergence.
M30 – H1 shows slight divergence, indicating the market may have a short adjustment before continuing to rise.
BUY should only be entered at beautiful support zones, if a bad candle is seen → close short and exit quickly.
SELL is only reactive selling at strong resistance zones, not holding for long.

XAUUSD – REFERENCE SCENARIO FOR 13/11 – TRACKING ELLIOTT WAVE 5💛 XAUUSD – REFERENCE SCENARIO FOR 13/11 – TRACKING ELLIOTT WAVE 5 🎯
🌤 Overview
Hello everyone 💬
Gold is currently trading around the 4210 region, indicating that the upward momentum has slowed after two strong days of gains.
According to Elliott wave, wave 5 may not have ended yet, and this region is becoming a strong resistance – where prices can accumulate or adjust at any moment.
Besides technical factors, political news from the US President's administration is causing significant USD fluctuations, leading to a wide range of gold movements in the short term. Therefore, today it is crucial to prioritise risk management and monitor price reactions in the 4210–4260 region.
💹 Technical Analysis
📈 On the H4 chart, gold is approaching the resistance area of 4210–4260, which also coincides with the 0.236 Fibonacci and the previous FVG zone.
🟣 The bearish view (ABC correction) will be confirmed when the price breaks below 4180 – targeting an adjustment to 4120–4050.
🔹 The bullish view remains valid if the price closes the H4 candle above 4212, in which case the trend could extend to 4250–4280.
🎯 Reference Trading Plan
💖 BUY Scenario (on breakout)
Entry: 4230–4232 | SL: 4225
TP: 4165 – 4190 – 4250
💢 SELL Scenario (reaction at resistance)
Entry: 4265–4267 | SL: 4273
TP: 4249 – 4215 – 4200
⚠️ Important Note
Closely monitor reactions at the levels: 4246 – 4212 – 4260 – 4280.
USD is highly volatile due to political factors, which may cause rapid fluctuations in gold.
🌷 Gold is at a crucial transition zone – Elliott wave 5 may soon end or expand further 💛
Be patient for clear confirmation, as at this stage, even a small deviation can change the entire price structure.
If you find this useful, please 💛 like – 💬 comment – 🔔 follow LanaM2 to keep updated with daily gold insights with me ✨
