Institutional Master class
Option Trading Explained
Options are financial derivatives that provide the right, but not the obligation, to buy or sell an underlying asset at a predetermined price within a specific period.
Types of Options:
Call Option: Right to buy the underlying asset.
Put Option: Right to sell the underlying asset.
Components of an Option Contract:
Strike Price: The agreed price to buy/sell.
Premium: Price paid to acquire the option.
Expiration Date: Date when the option contract ends.
Option Trading Strategies:
Buying Calls/Puts: Simple directional bets.
Covered Call: Holding stock while selling a call option to generate income.
Protective Put: Buying a put option to hedge a long stock position.
Spreads: Combining options to limit risk and cost.
Tecnicalanalysis

Option Trading The stock market is a platform where shares of publicly listed companies are bought and sold. It serves two primary functions: providing companies with capital to grow and giving investors the opportunity to share in the profits of publicly traded companies.
Key Components:
Stocks: Ownership shares in a company.
Stock Exchanges: Platforms like the NYSE, NASDAQ, and BSE where trading occurs.
Indices: Benchmarks like the S&P 500 or Nifty 50 that track the performance of groups of stocks.

Punjab National Bank Flag Breakout Setup📈 Punjab National Bank (PNB) – Flag Breakout Setup
Observed a classic flag pattern on the daily chart after a strong pole move in 2023–24.
✅ Breakout above the channel confirmed with price action near 113.
✅ Entry plan: Watch for daily close >113 with volume.
✅ Stop-loss idea: Below 106.
✅ Target 1: 140 (first swing resistance).
✅ Measured move projection targets up to ~198 possible based on full flag pole.
Volume confirmation and broader market context will guide the actual trade trigger.

Institutional Option Trading Part -xTrading Techniques
Block Trading: Large, privately negotiated trades.
High-Frequency Trading (HFT): Using algorithms for rapid-fire trades.
Algorithmic Trading: Automated trading based on predefined criteria.
Technology in Institutional Trading
Low Latency Networks: For speed advantage.
Advanced Algorithms: For market making, arbitrage, and execution.
Data Analytics: Real-time analysis to inform trading decisions.
Market Impact and Regulations
Institutional traders can move markets, prompting regulatory oversight.
Regulatory Bodies:
SEC (U.S.): Securities and Exchange Commission.
FINRA (U.S.): Financial Industry Regulatory Authority.
SEBI (India): Securities and Exchange Board of India.
Key Regulations:
Reporting Requirements: Large trades must be reported.
Fair Trading Practices: Prevent market manipulation.
Risk Controls: Institutions must manage trading risks appropriately.

Institutional Option Trading Institutional Option Trading
Institutional option trading involves using options as part of sophisticated strategies to hedge risk, enhance returns, or speculate.
Objectives of Institutional Option Trading
Hedging: Protecting large portfolios against market downturns.
Income Generation: Selling options to collect premiums.
Speculation: Taking directional bets with options.
Arbitrage: Exploiting price inefficiencies across markets.
Common Institutional Option Strategies
Covered Call Writing: Selling call options against stock holdings to generate income.
Protective Puts: Buying puts to insure portfolios against downside risk.
Spreads (Vertical, Horizontal, Diagonal): Limiting risk while aiming for a defined profit range.
Straddles and Strangles: Betting on volatility, regardless of market direction.
Iron Condors: Selling out-of-the-money calls and puts to profit from low volatility.

Institutional Option Trading, Investing, and TradingInstitutional trading and investing significantly differ from retail activities. Institutions trade in large volumes, use complex strategies, and have access to exclusive information and tools. This guide will provide a comprehensive overview of institutional option trading, investing, and general trading practices, detailing their methodologies, tools, and market impacts.
Understanding Institutional Investors
Institutional investors include mutual funds, hedge funds, pension funds, insurance companies, and large banks. These entities manage vast sums of money, often on behalf of others, and possess substantial market influence.
Key Characteristics:
Large Capital Base: Institutions trade in millions or billions.
Market Influence: Their trades can impact prices significantly.
Professional Resources: Access to cutting-edge research, proprietary algorithms, and high-speed trading platforms.

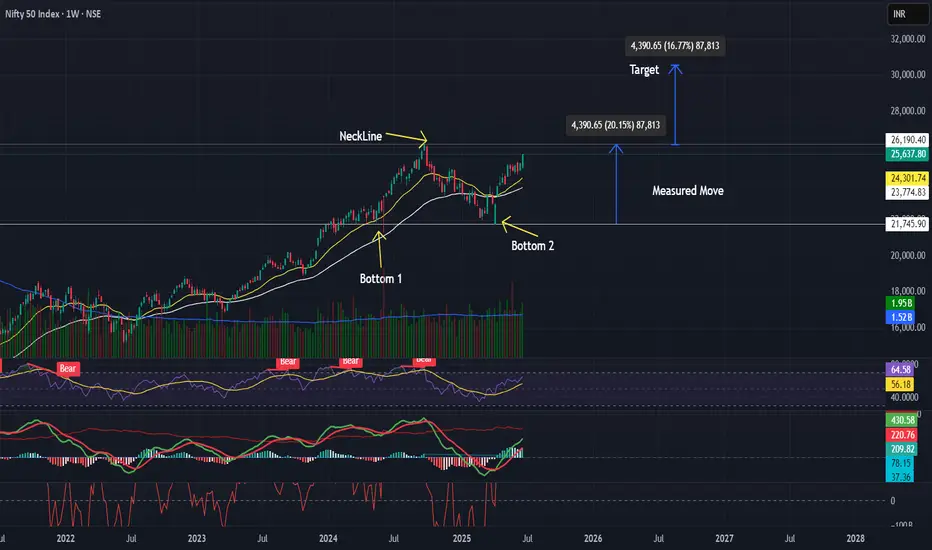
NIFTY Weekly Chart – Double Bottom Breakout Analysis📌 NIFTY Weekly Chart – Double Bottom Breakout Analysis
After a long corrective phase, NIFTY is forming a classic Double Bottom pattern on the weekly timeframe. This is typically a bullish reversal signal.
✅ Pattern: Double Bottom on Weekly Chart
✅ Bottom Levels: ~21,800
✅ Neckline Resistance: ~26,200
📈 Breakout Strategy:
Watch for a weekly close above 26,200 with higher volume to confirm breakout strength.
✅ Measured Move Target: ~30,600
Calculation: Neckline + (Neckline – Bottom) ≈ 26,200 + (4,400)
✅ Stop-loss Options:
ATR-based stop: ~25,530
Chart-based conservative stop: ~24,500
🔎 Bias: Bullish above 26,200 with confirmed weekly close and volume expansion.
📌 Volume Note: Look for rising volume near the neckline to validate the breakout.
This setup aligns with strong macro drivers such as India’s economic resilience and sector rotation into large caps.
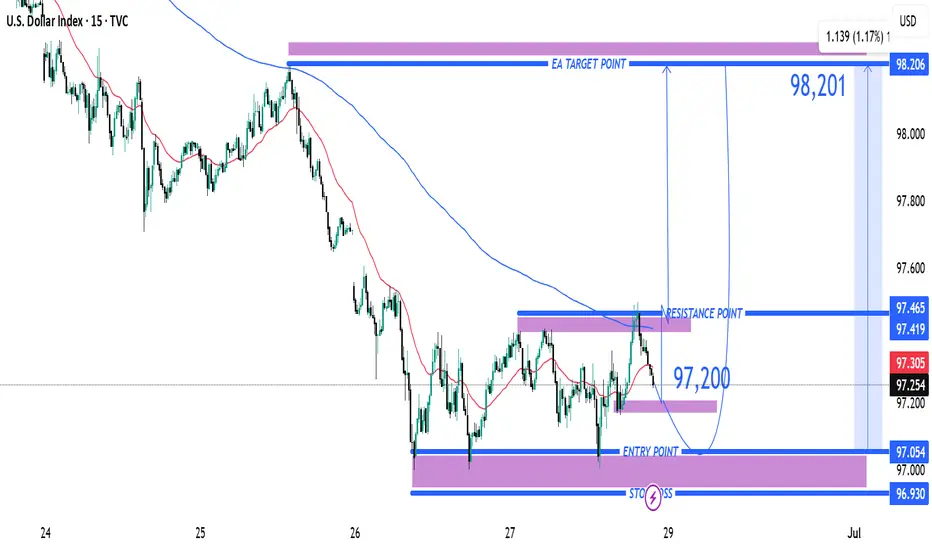
Entry Point Marked at: ~97.200 The price has already reacted m Entry Point
Marked at: ~97.200
The price has already reacted multiple times around this level, suggesting it's a key support zone.
🛑 Stop Loss
Placed at: ~96.930
Just below the support zone, protecting against a breakdown below recent lows.
This implies a risk of about 27 pips from the entry.
🎯 Target Point (TP)
Marked at: ~98.201
Strong resistance zone from previous price action.
Target implies a potential reward of 100+ pips, offering a risk-reward ratio (RRR) of ~3.7:1, which is favorable.
📊 Resistance Area
Around 97.419–97.465
This is the first obstacle the price must break through to confirm bullish continuation.
The 200 EMA (blue curve) is currently acting as dynamic resistance, aligning near this zone.
📉 Indicators
Moving Averages:
Red: Likely 50 EMA
Blue: Likely 200 EMA
Price is currently below both EMAs — so trend is still bearish, but trying to shift.
📌 Strategy Insight
The setup anticipates a bullish reversal from 97.200, aiming for a breakout above the 200 EMA and resistance to reach the 98.201 zone.
For confirmation, watch for a strong bullish candle close above 97.465, which would validate upside continuation.
⚠️ Risks
Price is still under both moving averages → downward momentum may persist.
If support at 97.00 breaks, downside acceleration could occur.
✅ Conclusion:
This is a bullish breakout setup on DXY with:
Defined entry and stop-loss.
Clear target.
High RRR.
But it’s crucial to wait for confirmation above resistance (97.465) before full conviction on the long trade.
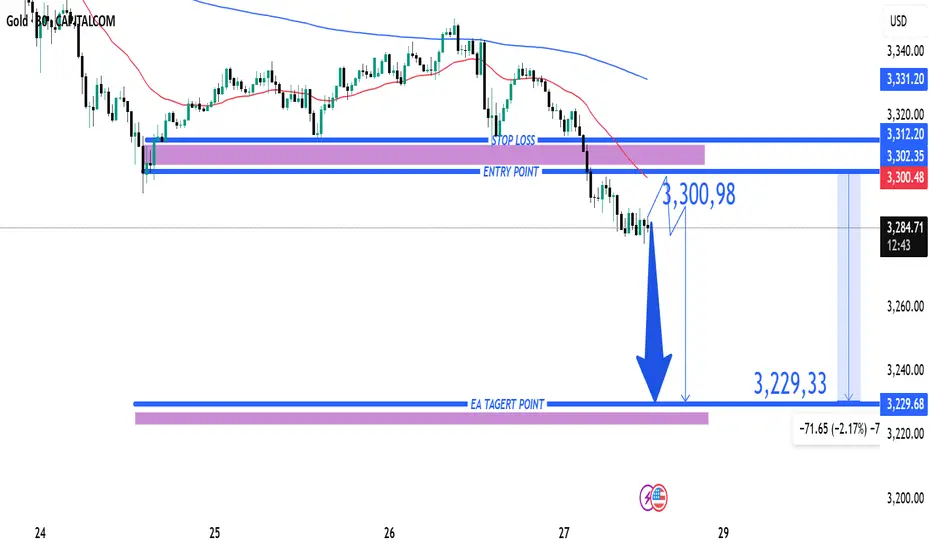
Gold (XAU/USD) Bearish Trade Setup – June 27, 2025Entry Point: Around 3,300.98 USD
Stop Loss (SL): ~3,312.20 USD
Take Profit (TP): 3,229.33 USD
Current Price: 3,286.15 USD
Risk-Reward Ratio: ~1:6.3
(Potential reward ≈ 71.65 pts; risk ≈ 11.22 pts)
Technical Breakdown:
Trend:
The price is in a short-term downtrend, supported by:
Lower highs and lower lows.
Price trading below both 50 EMA (red) and 200 EMA (blue), confirming bearish momentum.
Bearish Breakout:
Price broke below a key support-turned-resistance zone near 3,300–3,302, triggering sell pressure.
Resistance Area:
Strong rejection at 3,302–3,312 zone, which is now acting as resistance.
SL is placed just above this zone to protect against false breakouts.
Target Zone:
TP set at 3,229.33, aligning with a previous support zone — a logical area for price to react.
Strategy Notes:
Bias: Bearish
Entry confirmation: Already triggered.
Risk Management: SL placement is tight and strategic; RR ratio is highly favorable.
Next support below TP: If 3,229 breaks, further downside could follow.
Summary:
This setup shows a well-defined bearish continuation with a clean break of support, a controlled SL above resistance, and a strong RR ratio. A suitable trade for trend-following strategies, but price must not retrace above 3,312 for this idea to remain valid.
XAUUSD Setup Short Trade Opportunity Below ResistanceCurrent Price: 3,327.56 USD
Entry Point: 3,332.67 USD
Stop Loss: 3,342.45 USD
Take Profit Levels:
Target 1 (Downside): 3,294.45 USD (-1.17%)
Target 2 (Upside): 3,393.78 USD (+1.50%)
🔧 Technical Indicators & Tools
Trade Line: Upward sloping trendline connecting higher lows, supporting recent bullish structure.
Moving Averages:
Red: Short-term (likely 50-period EMA)
Blue: Long-term (likely 200-period EMA)
Price is still trading below the long-term MA, suggesting broader bearish pressure.
Resistance Zone: 3,334.96–3,341.30 — a key supply area marked in purple.
Support Zone: 3,294.45 — identified as a previous demand level.
⚖️ Risk-Reward Analysis
Short Setup:
Entry: 3,332.67
Stop Loss: 3,342.45 (Risk ~10 USD)
Target: 3,294.45 (Reward ~38 USD)
R:R Ratio ≈ 1:3.8, which is favorable for a short trade.
📌 Summary
Bias: Bearish intraday
Setup Type: Short-sell at resistance zone
Confirmation: Price rejection or bearish candle near 3,334–3,342 zone
Invalidation: Break and close above 3,351.06 (upper resistance)

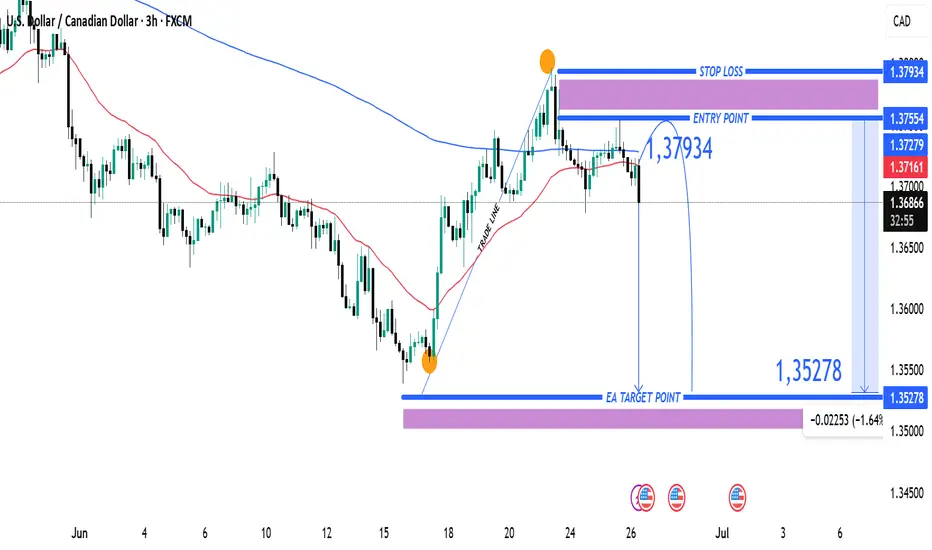
USDCAD Bearish Reversal Trade Setup – 3H Chart Analysis (June 26 Entry Zone: 1.37279 – 1.37554
🔹 Stop Loss: 1.37934
🔹 Target: 1.35278
🔹 Risk-to-Reward (RR): ~1:2.5
🧠 Technical Breakdown
Trend Overview:
Overall trend shows a downtrend from earlier June, followed by a corrective bullish move.
Price failed to sustain above the 200 EMA (blue line), indicating continued bearish pressure.
Trade Line Break:
A steep bullish trendline was broken, signaling a potential trend reversal or deeper pullback.
Bearish Rejection Zone:
The purple zone (1.37279 – 1.37554) acted as resistance.
Price formed a lower high and rejected this zone, confirming selling interest.
Entry Strategy:
Short entry is ideally within or just below the rejection zone.
Aggressive entry already in play at current market price (1.36909) after confirmation.
Target Zone:
Projected towards 1.35278, aligning with previous support and fib retracement zone.
Large purple support zone near the target suggests a potential reversal area.
⚠️ Risk Notes
Be cautious of USD volatility due to upcoming economic events (noted with icons on the chart).
Stop loss above previous swing high minimizes risk of fakeouts.
✅ Summary:
This is a bearish swing setup aiming for a significant drop toward 1.35278. The clean rejection from resistance and trendline break supports a high-probability short opportunity with favorable risk-reward.
Institutional Option Trading Part -3Institutional Investment Process
Setting Objectives: Determining risk tolerance, return targets, and time horizons.
Asset Allocation: Dividing the portfolio among different asset classes.
Security Selection: Choosing individual investments.
Portfolio Monitoring: Continuously reviewing performance and risk.
Institutional Trading
Institutional trading refers to the buying and selling of securities in large volumes by institutions.
Types of Institutional Traders
Proprietary Traders: Trade with the institution's own money.
Agency Traders: Execute trades on behalf of clients.
Program Traders: Use algorithms to trade baskets of stocks.
Trading Venues
Exchanges: NYSE, NASDAQ, etc.
Dark Pools: Private exchanges for large orders.
Over-the-Counter (OTC): Direct trading without an exchange.

Institutional Option Trading Part -10Investment Strategies
Active Management: Constantly buying and selling assets to outperform benchmarks.
Passive Management: Tracking indices like the S&P 500 to match market performance.
Value Investing: Identifying undervalued stocks.
Growth Investing: Focusing on companies with high growth potential.
Quantitative Investing: Using mathematical models to guide investment decisions.
Risk Management
Diversification: Spreading investments across various sectors and assets.
Hedging: Using derivatives to offset risks.
Liquidity Management: Ensuring enough cash to meet obligations.
Regulatory Compliance: Adhering to financial regulations.

Institutional Option Trading Part -2Disadvantages
Regulatory scrutiny.
Complexity and need for highly skilled traders.
Potential market impact.
Institutional Investing
Institutional investing is the process of managing large-scale investment portfolios with long-term goals.
Investment Objectives
Capital Preservation: Maintaining the value of assets.
Capital Appreciation: Growing the portfolio over time.
Income Generation: Providing steady returns through dividends or interest.
Asset Classes Used
Equities: Shares of publicly traded companies.
Fixed Income: Bonds and other debt instruments.
Real Estate: Direct investments or REITs.
Commodities: Such as gold, oil, or agricultural products.
Derivatives: Options, futures, and swaps.

Institutional Option Trading Part -5Institutional Option Trading
Institutional option trading involves using options as part of sophisticated strategies to hedge risk, enhance returns, or speculate.
Objectives of Institutional Option Trading
Hedging: Protecting large portfolios against market downturns.
Income Generation: Selling options to collect premiums.
Speculation: Taking directional bets with options.
Arbitrage: Exploiting price inefficiencies across markets.

Institutional Option Trading Part -6Institutional trading and investing significantly differ from retail activities. Institutions trade in large volumes, use complex strategies, and have access to exclusive information and tools. This guide will provide a comprehensive overview of institutional option trading, investing, and general trading practices, detailing their methodologies, tools, and market impacts.
Understanding Institutional Investors
Institutional investors include mutual funds, hedge funds, pension funds, insurance companies, and large banks. These entities manage vast sums of money, often on behalf of others, and possess substantial market influence.
Key Characteristics:
Large Capital Base: Institutions trade in millions or billions.
Market Influence: Their trades can impact prices significantly.
Professional Resources: Access to cutting-edge research, proprietary algorithms, and high-speed trading platforms.

Put Call Ratio (PCR) Explained in Simple TermsWhat is PCR?
The Put-Call Ratio (PCR) is a popular market sentiment indicator used in option trading. It helps traders understand whether more people are buying put options (bearish bets) or call options (bullish bets) at a given time.
Put Options: Contracts betting the price will go down.
Call Options: Contracts betting the price will go up.
How to Read PCR?
PCR < 1: More call options → Bullish sentiment.
PCR > 1: More put options → Bearish sentiment.
PCR = 1: Neutral sentiment.
But extreme values often suggest the opposite:
Very High PCR: Possible market reversal upwards (too many bearish bets).
Very Low PCR: Possible market reversal downwards (too many bullish bets).
Example:
Put OI: 5,00,000 contracts
Call OI: 10,00,000 contracts
PCR = 5,00,000 / 10,00,000 = 0.5 → This indicates bullish sentiment.
Why PCR Matters?
Helps identify market mood (bullish or bearish).
Gives contrarian signals (overcrowded trades can reverse).
Used in option trading strategies for timing entry and exit.

Learn Institutional Trading Pros and Cons
Pros: Early signals, useful for reversals.
Cons: Requires confirmation, may produce false signals.
Technical Trading
What is Technical Trading?
Technical trading focuses on using historical price data, volume, and technical indicators to predict future price movements. Traders use charts and patterns instead of company fundamentals.
Key Tools in Technical Trading
Price Charts: Candlestick, line, bar charts.
Indicators: Moving averages, RSI, MACD, Bollinger Bands.
Chart Patterns: Head and Shoulders, Triangles, Double Tops, Flags.
Support and Resistance Levels: Key price points where stocks reverse.

Why People Trade OptionsKey Components of Options
Strike Price: The pre-agreed price at which the option can be exercised.
Premium: The price you pay to buy the option contract.
Expiration Date: The date until which the option is valid.
Why People Trade Options
Leverage: Small investment, potential for large returns.
Hedging: Protects portfolio from losses.
Speculation: Betting on price movements.
Example
If a stock is currently priced at ₹500, you can buy a call option with a strike price of ₹550, expiring in one month, by paying a premium of ₹5. If the stock price rises to ₹600, you can buy at ₹550 and immediately sell at ₹600, making a profit.

Learn Institutional Trading Part-2What is Investing?
Investing involves committing your money to various assets like stocks, mutual funds, gold, real estate, or bonds to grow your wealth over time. Investing is generally a long-term strategy, focusing on the gradual accumulation of wealth.
Key Types of Investments
Stock Market Investments: Buying shares of companies.
Mutual Funds: Pooling money with other investors.
Bonds: Lending money to companies or governments for interest.
Gold & Real Estate: Physical assets that typically grow over time.
Investment Strategies
Value Investing: Buying undervalued stocks.
Growth Investing: Investing in companies with high growth potential.
Dividend Investing: Investing in companies that pay regular dividends.
Benefits of Investing
Builds wealth over time.
Helps fight inflation.
Provides financial security.

Learn Institutional Trading Part-4Technical Trading
Technical trading uses charts, patterns, and indicators to make decisions.
Traders study past price movements, volume, and signals to predict future trends instead of focusing on company financials.
Stock Market
The stock market is a place where shares of companies are bought and sold.
It’s like a big online shopping mall for stocks (e.g., NSE, BSE, NYSE). Prices go up and down based on demand, news, earnings, and investor emotions.

Learn Institutional TradingInvesting
Investing means putting your money into assets (like stocks, real estate, gold, or mutual funds) to grow your wealth over time.
It’s usually long-term, focused on building value and achieving goals like retirement or buying a house.
Divergence Trading
Divergence trading is when you compare the price of a stock with an indicator (like RSI or MACD).
If the stock is going up, but the indicator is going down (or vice versa), it shows divergence—a possible signal that the price might reverse soon.

Learn Option TradingOption trading is buying and selling contracts that give you the right (but not the obligation) to buy or sell a stock at a specific price before a certain date.
There are two types:
Call Option: You expect the stock price to go up.
Put Option: You expect the stock price to go down.
It’s like booking a movie ticket in advance—you can go if you want, but you don’t have to.
