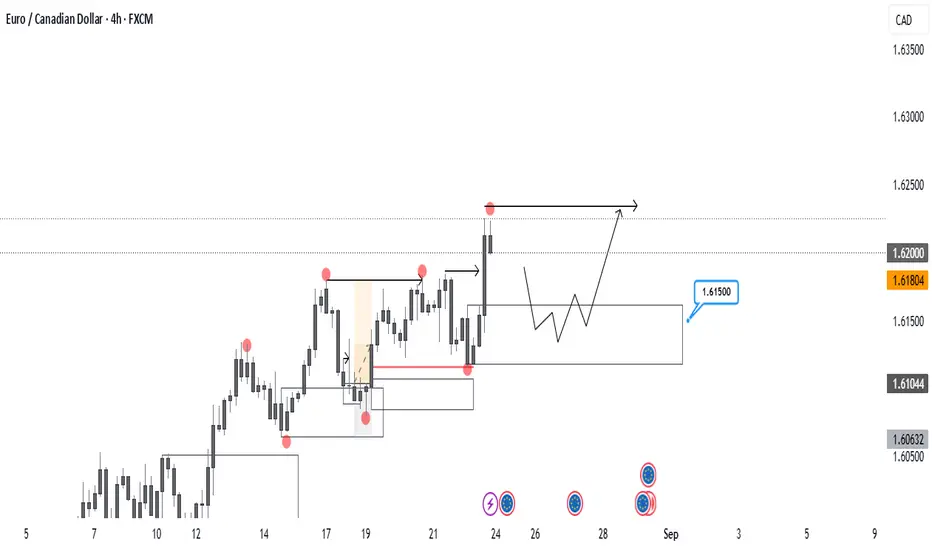
EURCAD - CONTINUATION TRADEThe pair is in a clear uptrend, consistently forming higher highs and higher lows. I’m waiting for a healthy pullback into the demand zone, where I’ll look for confirmation to enter long position. Setup remains solid as long as structure is maintained. If in any case price drop below the demand zone, that will indicate shift in a structure.
Tehnicalanalysis
EURUSD – Bearish Channel Continuation on H1EURUSD – Bearish Channel Continuation on H1
Market Overview
EURUSD continues to move steadily within a descending channel, confirming a bearish market structure. Recent recovery attempts have been capped at supply zones, while liquidity remains concentrated at lower price levels. As long as the pair trades inside this channel, the preferred strategy is to look for selling opportunities.
Technical Context
The bearish channel remains intact, with strong seller defence in the 1.1720–1.1790 zone.
Key resistance levels: 1.1753 and 1.1820. Only a clear break above 1.1820 would weaken the bearish scenario.
Downside liquidity targets sit around 1.1630, with extended potential toward 1.1575 if selling pressure accelerates.
Trading Scenarios
🔻 Priority – Sell Setups (with the channel trend)
Sell Setup 1
Entry: 1.1720 – 1.1730
Stop Loss: 1.1750
Take Profit: 1.1695 – 1.1670 – 1.1652 – 1.1630
Sell Setup 2
Entry: 1.1780 – 1.1790
Stop Loss: 1.1810
Take Profit: 1.1755 – 1.1730 – 1.1700 – 1.1675
🔹 Alternative – Buy Setup (countertrend, lower probability)
Buy Setup
Entry: 1.1630 – 1.1620
Stop Loss: 1.1600
Take Profit: 1.1660 – 1.1680 – 1.1700
Note: This setup is only valid if price tests the demand zone around 1.1620–1.1630, which could trigger a short-term corrective bounce.
Risk Management & Outlook
Primary Bias: Stay bearish while price action remains within the channel.
Invalidation: A confirmed H1/H4 close above 1.1820 invalidates the bearish view.
Target: A decisive breakdown below 1.1630 could pave the way towards 1.1575.
✅ Conclusion:
EURUSD remains in a clear downtrend. The main strategy is to sell rallies into resistance zones, targeting lower liquidity areas. Long positions can be considered only at strong demand levels, and should be treated as short-term corrective trades rather than a trend reversal.

AUDNZD Buy or Sell? AUDNZD tapped into the 4H Supply zone I’ve been monitoring for some time. On Friday, we also saw a bearish structure flip on the 15-minute timeframe — a potential signal that price may break the current demand zone and shift structure to the downside.
I didn't take any positions on Friday, but going into this week, my focus will be on the 4H Demand Zone for possible long opportunities. I’ll be watching how price reacts there — if we get bullish confirmation, I’ll consider a long setup.
For now, shorts don’t offer a favorable R:R, so I’ll remain on the sidelines unless demand breaks. If that happens, I’ll take the same approach, watching for clean structure and new entry zones.
Patience until the market reveals what it wants to do next.

EURAUDEURAUD is showing similar behavior to other EUR pairs — strong bullish move with a break in structure. Now just waiting for a retracement back down into the 4H demand zone before looking for long opportunities.
Would like to see price come into that zone, react, and show signs of strength again before considering buys. Just being patient and letting the setup come to me.

EURUSD after NFPFollowing Friday’s NFP release, EURUSD flipped bearish structure. I’m now looking for a retracement into a key demand zone, where I’ll be watching for buy setups.
Until then, I’ll look for a possible sell-to-buy scenario — shorting the move down into demand, and then reassessing for bullish confirmation.
Let’s see how price reacts on Monday.

EURNZDEURNZD Market Outlook
The price on EURNZD has recently approached the 4H Supply Zone around the 1.96000 level and has flipped the short-term bearish structure, indicating potential bullish momentum. However, given the presence of supply, I'm monitoring the possibility of a retracement from this zone.
My primary scenario involves a short-term rejection from the 1.96000 Supply Zone, targeting a move down into the 1.94000 Demand Zone. From there, I will look for a sell-to-buy setup, with the intention of positioning for a larger upside continuation, provided bullish order flow confirms.
Alternatively, if buyers prove to be significantly strong and supply fails to hold, price may break through the 1.96000 zone and extend higher towards the daily wick area near the 1.98000 level.
Both scenarios remain valid depending on price action and volume behavior at key levels.
Will be watching 15min structure before entering any trade.

GBPJPYThe 4-hour structure on GBP/JPY has turned bullish following a strong upward move that flipped the previous structure after several days of consolidation and limited volatility.
Price has now entered a Demand zone and is likely to retrace toward the 197.500 level, which aligns with a key psychological handle.
This area may present a high-probability trading opportunity, depending on how price reacts. We'll monitor for confirmation before entering a position.

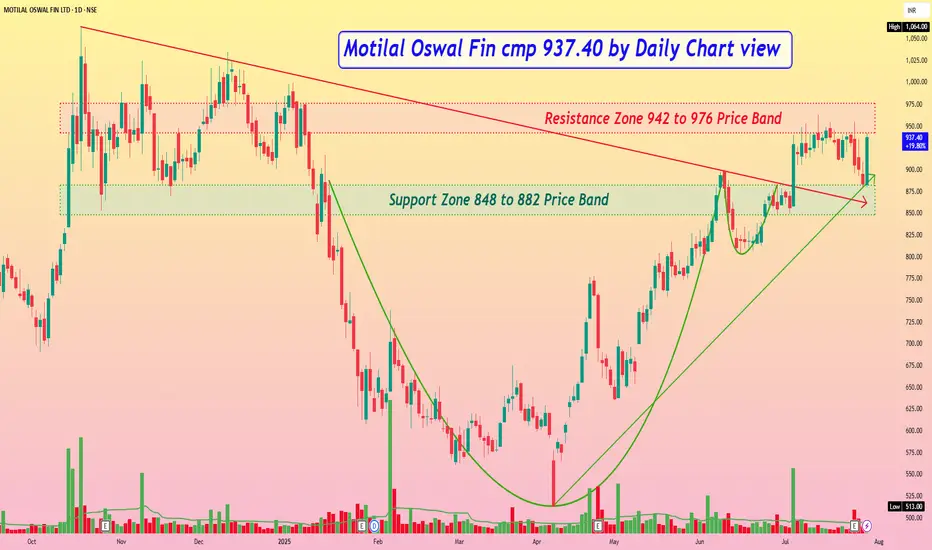
Motilal Oswal Fin cmp 937.40 by Daily Chart viewMotilal Oswal Fin cmp 937.40 by Daily Chart view
- Support Zone 848 to 882 Price Band
- Resistance Zone 942 to 976 Price Band
- Bullish Cup and Handle completed at Support Zone neckline
- Support Zone seen to be tested retested over the past 2 days
- Falling Resistance Trendline Breakout done a while back and sustained
- Selling pressure is seen around the Resistance Zone hurdle acting strongly
- Resistance Zone Breakout necessary for fresh upside as Price retraced multiple times
Institution Option Trading Part-1Role of Market Makers & Liquidity Providers
Institutions often rely on market makers for tight bid-ask spreads.
Market makers hedge every trade using delta-neutral strategies.
Their presence helps institutions build or unwind large positions without disrupting prices.
Institutional Examples in Option Trading
Hedge Funds: Use volatility arbitrage, gamma scalping, dispersion trading.
Insurance Firms: Use long-dated puts to hedge annuity products.
Banks: Write structured products with option-like features (e.g., equity-linked notes).
Asset Managers: Use protective puts or collars on core portfolios.

Advance Institutions Option Trading - Lecture 3Options trading might feel like gambling on a single trade, but informed decisions make it fundamentally different. Reckless trading without a plan can resemble gambling but is not the proper way to trade. With discipline and skill, options trading stands apart from luck-based activities.
Options involve risk and are not suitable for all investors. Certain requirements must be met to trade options. Before engaging in the purchase or sale of options, investors should understand the nature of and extent of their rights and obligations and be aware of the risks involved in investing with options.

RSI DivergenceRSI divergence happens when the price and the RSI move in opposite directions. This signals that the current trend may be losing momentum and could reverse soon. For example, if the price keeps rising but the RSI starts falling, it could mean the uptrend is weakening.

Candle sticks patternCandlestick patterns are technical trading tools that help traders predict price direction and market sentiment. They are based on past price movements and can help analysts identify shifts in supply and demand, which can aid in predicting trend reversals, continuations, and potential price levels.

Technical Trading analysisTechnical analysis is a method of evaluating statistical trends in trading activity, typically involving price movement and volume. It is used to identify trading and investment opportunities.

Management and PsychologyAn understanding of psychological principles can profoundly enhance managerial capabilities. Recognising the various factors that influence human behaviour—including biases, perception, and social dynamics—enables managers to foster an environment that promotes efficiency, innovation, and well-being among team members.

EURUSDAs you can see, EUR/USD is just trading within a 4H wick in a demand zone. It has formed a new trading range and its own buy zone. While the price appears to be approaching aggressively, the bearish volume on the approach is actually decreasing. This could indicate a lack of bearish pressure.
With DXY being bearish (check my thoughts on DXY), this trade makes sense. However, if entering immediately—especially in a week full of fundamental news—you should be cautious with your risk management and trade execution.
Let’s wait and see what happens. I will definitely check the 15-minute time frame to confirm long entries. But for now longs with low risk are in play as my limit was trigered and it seems reasonable from a technical perspective.
Blessings,
T

Database TradingIt comes with limited downside risk, making it a safer investment than futures or margin trading. In addition, option trading can be more complex than other financial instruments, as it requires traders to have a good understanding of the underlying asset and market conditions.
Yes, you can make a lot of money, or lose a lot of money, trading options. Options provide a leveraged payoff on some underlying asset, such a stock. Below are the basics and some points to be aware of. The prices of options are based on the movement of some underlying asset, often stocks.

PCR TradingThe Put-Call Ratio (PCR) is a popular technical indicator used by investors to assess market sentiment. It is calculated by dividing the volume or open interest of put options by call options over a specific time period. A higher PCR suggests bearish sentiment, while a lower PCR indicates bullish sentiment.
However, no PCR can be considered ideal, but usually, a PCR below 0.7 is typically viewed as a strong bullish sentiment while a PCR more than 1 is usually considered as a strong bearish sentiment.

Technical Analysis Technical analysis is a means of examining and predicting price movements in the financial markets, by using historical price charts and market statistics. It is based on the idea that if a trader can identify previous market patterns, they can form a fairly accurate prediction of future price trajectories.
What exactly are the two types of technical analysis? Chart patterns and technical (statistical) indicators are the two main types of technical analysis. Chart patterns are a subjective type of technical analysis in which technicians use certain patterns to indicate regions of support and resistance on a chart.

GOING THROUGH CHARTSI just went through the charts a bit. Let's wait and see what happens with those pairs. New videos will be posted here regularly.
Trade well,
T

Cup and Handle pattern breakout in BHARTIARTLBHARTIARTL
Key highlights: 💡⚡
✅On 1Hr Time Frame Stock Showing Breakout of Cup and Handle Pattern .
✅ Strong Bullsih Candlestick Form on this timeframe.
✅It can give movement up to the Breakout target of 797+.
✅Can Go short in this stock by placing a stop loss below 775-.
✅breakout this can give risk:reward upto 1:4+.

AUDUSD bulls eye short-term hurdle amid RBA playsAUDUSD bulls stay hopeful as the Reserve Bank of Australia (RBA) ends QE, despite posting initial losses due to rejection of the immediate rate hike concerns. The upside momentum ignores recently cautious RBA Governor Philip Lowe’s comments while staying above a three-week-old descending resistance line, near 0.7115. That said, the 50-DMA level around 0.7170 acts as an immediate barrier for the pair to cross before directing the bulls towards the last home of bears, namely the 100-DMA level close to 0.7260.
Alternatively, pullback moves may initially aim for the 0.7000 threshold ahead of highlighting the lows marked in December 2021 and January 2022, respectively around 0.6990 and 0.6965. In a case where the AUDUSD bears keep reins past 0.6965, the 61.8% Fibonacci Expansion (FE) of mid-June 2021 to January 2022 moves, surrounding 0.6920, should gain the market’s attention.
Overall, AUDUSD bulls are up for consolidating the early 2022 losses on hawkish RBA. However, the upside momentum needs caution as the US NFP is yet to play its role.

GBPUSD drops from 50-DMA ahead of BOE, Brexit talksGBPUSD bears retake controls on the key Thursday comprising Bank of England (BOE) monetary policy meeting and important Brexit talks in Paris. Technical set-up hints at further weakness on the pair’s inability to rise past 50-DMA, coupled with the bearish MACD signals. However, a clear downside break of a five-week-long support line, near 1.3615, becomes necessary. Also probing the sellers is the latest swing low surrounding August month’s trough close to the 1.3600 threshold. In a case where prices remain weak past 1.3600, July’s low of 1.3570 will act as a buffer before dragging the quote to the yearly bottom of 1.3410.
Meanwhile, a surprise positive fueling the pair above the 50-DMA level of 1.3705 will aim for a downward sloping resistance line from mid-September, around 1.3810. Following that, the 200-DMA level 1.3846 will be a tough nut to crack for the GBPUSD bulls before heading towards September’s peak of 1.3913 and the 1.4000 psychological magnet.

LICHSGFIN is at Support buy signalI will buy LICHSGFIN because :
It has been taking support at the trend line .
It has touched the support and has not been able to break it.
So will be looking at buying opportunities.
If it breaks the support look at shorting
Entry : 450/470
Target : 542
Stop loss : 446
