Bitcoin’s Correction Puzzle: Wedge Break, Macro Shifts!!Bitcoin has entered a fascinating phase after breaking down from its rising wedge formation, leaving the market in a medium-term correction cycle. Current price action around 113000 is trying to stabilize, but the structure suggests this zone is fragile. If bulls cannot reclaim and hold above the invalidation band near 116000, corrective flows are to dominate. The first major support sits around 103600, where a pause or bounce could develop. If that level folds, the market opens up for a deeper liquidity sweep toward 93000. Should this pocket fail to hold, Bitcoin’s path could extend into the 75000 region a zone that looks extreme but is consistent with how deep-pocket corrections unfold after a parabolic wedge break.
From a macro angle, the pressure is building. The Fed’s transition toward deeper cuts reflects softer growth, but while rate reductions support risk sentiment broadly, the narrative is colliding with dollar weakness, shifting liquidity conditions, and fading institutional momentum after the wedge breakdown. Equity markets still command flows, and with gold and silver absorbing part of the safe-haven bid, Bitcoin’s role as digital gold is being tested again. Yet, structurally, this correction is not an end-game it’s part of the broader cyclical rhythm. Bulls will need to defend lower zones convincingly to rebuild positioning before another attempt at fresh highs.
In essence, Bitcoin is in a correction phase where short-term optimism hangs on reclaiming 116000, while failure opens doors to a deeper hunt for liquidity at 103600, 93000, and potentially 75000. The macro backdrop makes this correction phase more interesting than usual it’s not just about price action, but about how Bitcoin will reassert its place in a market torn between easing policy, risk-on appetite, and competition from traditional safe-haven flows. Trade safe !!
Key Levels:
Invalidation band (bulls must reclaim): 116000
First support: 103600
Deep pocket zone: 93000
Extreme correction target: 75000
TERM

Silver’s Bullish Cycle: Zones to Buy, Levels to Aim ! Silver is running one of its strongest bullish phases in recent years, having broken through key ranges and now holding around the mid-43s with momentum still intact. The structure shows that 42.7 is the immediate support staying above this level keeps short-term bulls in control. Once pressure mounts, the wider zone between 40 and 41 is where the market is Trend to react with macro catalysts, whether it’s Fed commentary, shifts in the dollar, or changes in yields. This zone is less about weakness and more about price discovery, often a place where institutional demand re-enters. A deeper correction cannot be ruled out, and the 37 region stands out as the medium-term load-up zone, where longer-term players will rebuild exposure. On the upside, silver has scope to stretch toward 44.9, and once momentum extends further, the 47.8 handle comes into play. From a macro perspective, the trend is supported by a weakening dollar, softer yields, and the Fed’s slow shift toward deeper rate cuts, while silver’s dual role both as a safe-haven and an industrial metal tied to the energy transition gives the rally added structural strength. Taken together, the bias remains firmly higher, with dips into support zones offering opportunities rather than threats. Trade safe!
Key Levels to Watch:
Immediate support: 42.7
Reaction zone: 40.0 – 41.0
Medium-term load up zone: 37.0
Upside targets: 44.9 and 47.8

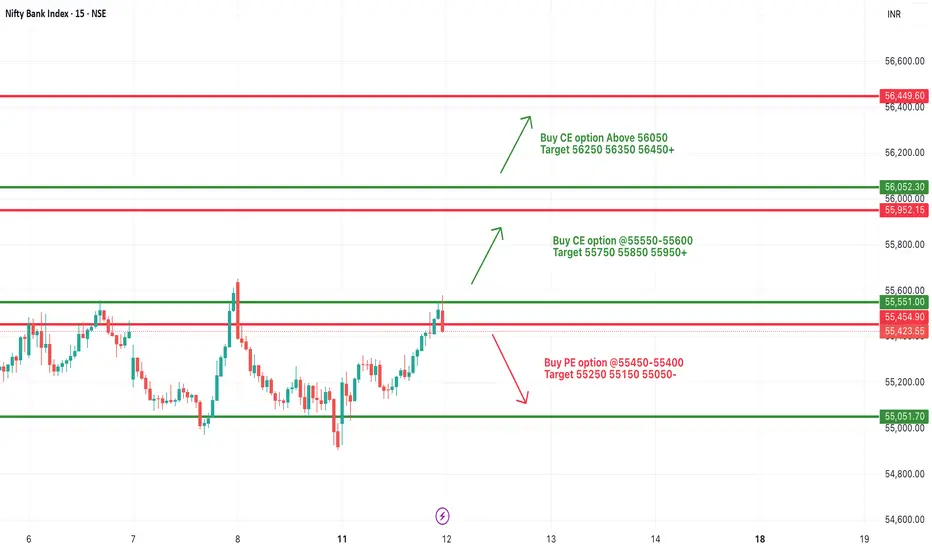
[INTRADAY] #BANKNIFTY PE & CE Levels(12/08/2025)Bank Nifty is likely to open with a gap-up, indicating strong bullish sentiment at the start. If the index sustains above 55,550–55,600, buying momentum may push it toward 55,750, 55,850, and 55,950+. Further strength can be expected if it breaks above 56,050, opening the path for 56,250, 56,350, and 56,450+.
On the downside, weakness could emerge if Bank Nifty falls below 55,450–55,400, which may lead to a decline toward 55,250, 55,150, and 55,050-. Price action around the 55,550 zone will be crucial in deciding intraday direction, so traders should wait for confirmation before entering trades and maintain strict stop-losses.
Sector Rotation Strategies1. Introduction: What is Sector Rotation?
Imagine the stock market as a giant relay race, but instead of runners passing a baton, it’s different sectors of the economy passing investment leadership to each other. Sometimes technology stocks sprint ahead, other times energy stocks lead the race, then maybe healthcare takes the spotlight. This cyclical shift in market leadership is what traders call Sector Rotation.
Sector rotation strategies aim to predict and act on these shifts, moving money into sectors expected to outperform and out of sectors likely to underperform.
It’s based on one powerful observation:
Not all sectors move in the same direction at the same time.
Even during bull markets, some sectors outperform others. And during bear markets, some sectors lose less (or even gain).
By aligning investments with economic cycles, market sentiment, and sector strength, traders and investors can potentially generate higher returns with lower risk.
2. Why Sector Rotation Works
The strategy works because different sectors benefit from different phases of the economic and market cycle:
Economic Growth boosts certain sectors (e.g., consumer discretionary, technology).
Recession or slowdown benefits defensive sectors (e.g., utilities, healthcare).
Inflationary spikes benefit commodities and energy.
Falling interest rates favor growth-oriented sectors.
The key driver here is capital flow. Big institutional investors (mutual funds, pension funds, hedge funds) don’t move all at once into the whole market — they rotate capital into sectors they expect to lead based on macroeconomic forecasts, earnings trends, and market psychology.
3. The Core Concept: The Economic Cycle & Sector Leadership
Sector rotation is deeply tied to business cycles. A typical economic cycle has four main stages:
Early Expansion (Recovery phase)
Mid Expansion (Growth phase)
Late Expansion (Overheating phase)
Recession (Contraction phase)
Here’s how different sectors tend to perform in each phase:
Phase Economic Traits Leading Sectors
Early Expansion Low interest rates, GDP growth starting, optimism Technology, Consumer Discretionary, Industrials
Mid Expansion Strong growth, rising demand, stable inflation Materials, Energy, Financials
Late Expansion Inflation rising, interest rates climbing Energy, Materials, Commodities
Recession Slowing growth, high unemployment, fear Healthcare, Utilities, Consumer Staples
This isn’t a fixed law — think of it as probabilities, not certainties.
4. Offensive vs Defensive Sectors
Sectors can broadly be divided into offensive (cyclical) and defensive (non-cyclical) categories.
Offensive (Cyclical) Sectors
Technology
Consumer Discretionary
Industrials
Financials
Materials
Energy
These sectors perform best when the economy is growing and consumers/businesses are spending.
Defensive (Non-Cyclical) Sectors
Healthcare
Utilities
Consumer Staples
Telecommunications
These sectors provide steady demand regardless of economic conditions.
5. Tools & Indicators for Sector Rotation
To implement a sector rotation strategy, traders use data-driven analysis combined with macroeconomic observation. Here are the main tools:
5.1 Relative Strength Analysis (RS)
Compare sector ETFs or indexes against a benchmark (e.g., S&P 500).
Tools: Relative Strength Ratio (RSI of sector performance vs market).
5.2 Economic Indicators
GDP Growth Rate
Interest Rates (Fed rate hikes/cuts)
Inflation trends
Consumer Confidence Index
PMI (Purchasing Managers Index)
5.3 Market Breadth & Momentum
Advance/Decline Line
Moving Averages (50, 200-day)
MACD for sector ETFs
5.4 ETF & Index Tracking
Commonly used sector ETFs in the U.S.:
XLK – Technology
XLY – Consumer Discretionary
XLF – Financials
XLE – Energy
XLV – Healthcare
XLP – Consumer Staples
XLU – Utilities
6. Sector Rotation Strategies in Practice
6.1 Top-Down Approach
Analyze macroeconomic conditions (Are we in early expansion? Late cycle?).
Identify sectors likely to lead in that stage.
Select strong stocks within those leading sectors.
Example:
If GDP is growing and interest rates are low, technology and consumer discretionary sectors might lead. Pick top-performing stocks in those sectors.
6.2 Momentum-Based Rotation
Rotate into sectors showing the strongest short- to medium-term performance.
Exit sectors showing weakening momentum.
6.3 Seasonality Rotation
Some sectors perform better at certain times of the year (e.g., retail in Q4 due to holiday shopping).
6.4 Quantitative Rotation
Use algorithms and backtesting to determine optimal rotation intervals and triggers.
7. The Intermarket Connection
Sector rotation doesn’t exist in isolation — it’s linked to bonds, commodities, and currencies.
Bond yields rising → Favors financials (banks earn more on lending spreads).
Oil prices rising → Benefits energy sector, hurts transportation.
Strong dollar → Hurts export-heavy sectors, benefits importers.
8. Real-World Examples of Sector Rotation
Example 1: Post-COVID Recovery (2020–2021)
Early 2020: Pandemic crash → Defensive sectors like healthcare, utilities outperformed.
Mid 2020–2021: Recovery & stimulus → Tech, consumer discretionary, and financials surged.
Late 2021: Inflation & rate hikes talk → Energy and materials took the lead.
Example 2: High Inflation Period (2022)
Fed rate hikes → Tech underperformed.
Energy and utilities outperformed.
Defensive sectors cushioned losses during market drops.
9. Risks & Limitations of Sector Rotation
Timing Risk: Entering a sector too early or too late can lead to losses.
False Signals: Economic data is often revised; market sentiment can override fundamentals.
Transaction Costs & Taxes: Frequent rotation = higher costs.
Over-Optimization: Backtested strategies may fail in real-world conditions.
10. Building Your Own Sector Rotation Strategy
Here’s a simple framework:
Determine the Market Cycle:
Look at GDP trends, inflation, interest rates, unemployment.
Select Likely Winning Sectors:
Use RS analysis and sector ETF charts.
Confirm with Technicals:
Moving averages, momentum oscillators.
Choose Best-in-Class Stocks or ETFs:
Pick leaders with strong fundamentals and technical setups.
Set Exit Rules:
RS weakening? Macro shift? Hit stop-loss.
Conclusion
Sector Rotation Strategies are not about predicting the market perfectly — they’re about stacking probabilities in your favor by aligning with the strongest sectors in the prevailing economic climate.
When done right:
You ride the wave of sector leadership instead of fighting it.
You reduce risk by avoiding weak sectors.
You improve performance by capturing the strongest trends.
Remember:
The stock market isn’t one giant boat — it’s a fleet of ships. Some sail faster in certain winds, some slow down. Sector rotation is simply choosing the right ship at the right time.
HeranbaSwing Trade -
Look interesting at current level - still closing pending
If today close above break out level
Maybe we can see Good move upside.
Risk around 8-10% around
Target next resistance

Nifty 22nd Draw Although long term view is bullish
I will be looking for 24667 and 24600
The gap at 24404 may also be filled before
the long term view... Expecting
T1 T2 tomorrow
Induslnd bank will tank due to poor results
which will cause pressure on banks

SRF moving out of consolidation SRF is moving out of 3 year long consolidation with volume and strong RSI.
Bullish Flag structure, signalling continuing bullish rally ahead.

Medium term trading opportunity in ABFRL for > 25% upsideHi,
NSE:ABFRL has given a Bullish Flag Breakout on Weekly charts with very good volume.
MACD is also on the bullish side on Weekly time frames. RSI is also on the bullish side on daily, weekly and monthly time frames.
In the current market scenario, I am expecting that the bullish momentum will continue.
Complete price projection like entry, stop loss and targets mentioned on the charts for educational purpose.
Don't Forget to Follow me to get all the updates.
Please share your feedback or any queries on the study.
Disclaimer: Please consult your financial advisor before making any investment decision.

RELIANCE Levels For Intraday or swing TradingChart Overview:
Current Price: ₹6,735.851.
Recent Performance:
1 day: +0.80%
5 days: +0.48%
1 month: +0.54%
6 months: +2.42%
Year to date: +16.29%
1 year: +21.40%
5 years: +165.58%
Support and Resistance Levels:
Pivot Points:
Resistance 1 (R1): ₹6,650.37
Resistance 2 (R2): ₹6,684.38
Resistance 3 (R3): ₹6,712.77
Pivot Point: ₹6,621.98
Support 1 (S1): ₹6,587.97
Support 2 (S2): ₹6,559.58
Support 3 (S3): ₹6,525.57

ASAHISONG Long Idea on weekly and monthly timeframeHi guys, I'm here again after years and I'll start posting again from now. Today I am here with another idea. The stock is ASAHISONG and the levels are mentioned on the chart.
CMP 411.45
Can be bought if it closes above 443 on weekly chart for at least 30% returns in medium term.
Note: This is not a recommendation. It is only for educational purposes. I am not a SEBI registered advisor. Don't treat this post as an investment advice and take your own risk accordingly.

MMTC Weekly time frame Analysis CMP 55 buy for target 68-80-90MMTC Weekly time frame Analysis CMP 55
buy for target 68-80-90-110-125-150-190-240-290-350+
Time duration 3-4 years


ALEMBICLTDHi guys, In this chart i Found a Demand Zone in ALEMBICLTD for Long Term, Observed these Levels based on price action and Demand & Supply. Don't Take any trades based on this Picture
...because this chart is for educational purpose only not for Buy or Sell Recommendation..
Thank Q

Medium Term Trading Opportunity in Indian Hotels for >20% UpsideHi,
NSE:INDHOTEL has given a Bullish Flag Breakout on Weekly charts with very good volume.
MACD is also on the bullish side on daily, weekly and Monthly time frames. RSI is also on the bullish side on daily and weekly time frames.
In the current market scenario, I am expecting that the bullish momentum will continue.
Complete price projection like entry, stop loss on Weekly Closing basis and targets mentioned on the charts for educational purpose.
Don't Forget to Subscribe to get all the updates.
Please share your feedback or any queries on the study.
Disclaimer: Please consult your financial advisor before making any investment decision.

PSP Projects AnalysisHey Guys,
Here is the analysis of PSP Projects. An undervalued firm, it's a small-mid cap stock however, as per the analysis conducted by my team and I, we've picked this stock.
We've got a view from Short term to Long term for this one.
Here are the details-CMP- 632.45
Targets:
Short Term (upto 2 months)- 701
Medium Term (6 Months to 1 year)- 742
Long Term (more than 1 year)- 805
It would be ideal to have a Trailing Stoploss of 557. (Trailing refers to changing your stoploss as targets are achieved).
Let me know what you think about this one.

Unichem Labs - Daily Analysis CMP 297.45 Buy till 260 TargeUnichem Labs - Daily Analysis
CMP 297.45
Buy till 260
Target 334- 355- 378- 400- 426-446-500+
Holding Period 2-3 years

Wheels India, a great entry opportunity!!!Good entry opportunity in Wheels India.
Price is on the trend line, so risk-reward ratio is good.
Can exit with 1:2 target also.
SL can be extended upto 530.

Balaji Amines - Medium Term Momentum Chemical industries have been sluggish on fundamental clues due to macro economics. However, this speciality chemical company is ready to make a move. Technical Weekly sharts shows signs of momentum for an upmove. One can enter at 2345 with medium term Target of 3050 and stop loss of 2000

TCS Long Term IdeaTCS forming a type of cup, can see price moving upward in 2023/24. Good for Investing !Trading

Long-Term View on Adani Port StockTradingView Idea: Long-Term View on Adani Port Stock
Overview:
Adani Port (NSE: ADANIPORTS) is a leading Indian multinational logistics company engaged in the business of handling and managing ports, terminals, and related activities. This TradingView idea presents a long-term view on Adani Port stock, with a focus on identifying a good buying level within the range of 715 to 735.
Key Points:
1. Stock: Adani Port (NSE: ADANIPORTS)
2. View: Long-term
3. Buying Level: 715 to 735
Analysis:
Adani Port stock has demonstrated strength and resilience over time, with a positive growth trajectory. The stock has witnessed notable uptrends in the past, driven by strong fundamentals and favorable market conditions.
The suggested buying level of 715 to 735 presents an opportunity for long-term investors to enter the stock. This range has historically served as a support zone, indicating potential buying interest and price stability. As long as the stock remains within this range, it offers an attractive entry point for investors aiming to establish a position in Adani Port with a long-term perspective.
However, it's important to conduct thorough research and consider other factors before making any investment decisions. Fundamental analysis, such as assessing the company's financial health, growth prospects, and industry trends, should complement technical analysis to gain a comprehensive understanding of the stock's potential.
Risk Considerations:
1. Market Volatility: Despite positive long-term prospects, stock prices can be influenced by market volatility and economic factors.
2. Industry and Regulatory Risks: Adani Port's performance may be impacted by changes in the logistics sector, regulatory developments, or geopolitical factors.
3. Individual Risk Tolerance: Investors should evaluate their risk tolerance, financial goals, and investment horizon before making any trading decisions.
Disclaimer:
This TradingView idea is solely for informational purposes and does not constitute financial advice. Always conduct your own analysis and consult with a qualified financial advisor before making investment decisions. The stock market involves risks, and past performance is not indicative of future results.

Alembic Ltd Weekly Analysis for Long duration NSE:ALEMBICLTD Weekly Analysis for long period
Trendline Breakout and sustained above strong support with LH LH structure
Buy Above 77 only of it sustained and give clear breakout with SL of 65 Strong Support as it was strong resistance since the beginning of its launch (1999).
T1 85
T2 98
T3 115

HOW-TO apply an indicator that is only available upon request?Recently, I've realized that my typical day involves constant encounters with indicators. For example, when the alarm clock rings, it's an indicator that it's morning and time to get up. I am checking the phone and once again paying attention to the indicators: battery charge and network signal level. I figure out in just one second that such a complex element of the phone as the battery is 100% charged and the signal from the cell towers is good enough.
Then I’m going out on a busy street, and it's only because of the traffic light indicator that I can safely cross the road to reach the parking lot. Looking at the on-board computer of my car, with its many indicators, I know that all the components of this complicated mechanism are working properly, and I can start driving.
Now, imagine what would happen if none of this existed. I would have to act blindly, relying on luck: hoping that I would wake up on time, that the phone would work today, that car drivers would let me cross the road, and that my own car would not suddenly stop because it ran out of gas.
We can say that indicators help to explain complex processes or phenomena in simple and understandable language. I think they will always be in demand in today's complex world, where we deal with a huge flow of information that cannot be perceived without simplifications.
If we talk about the financial market, it's all about constant data, data, data. Add in the element of randomness and everything becomes totally messed up.
To create indicators that simplify the analysis of financial information, the TradingView platform uses its own programming language — Pine Script . With this language, you can describe not only unique indicators, but also strategies — meaning algorithms for opening and closing positions.
All these tools are grouped together under the term "script" . Just like a trade or educational idea, a script can also be published. After this, it will be available to other users. The published script can be:
1. Visible in the list of community scripts with unrestricted access. Simply find the script by its name and add it to the chart.
2. Visible in the list of community scripts, but access is by invitation only. You'll need to find the script by its name and request access from its author.
3. Not visible in the list of community scripts, but accessible via a link. To add such a script to a chart, you need to have the link.
4. Not visible in the list of community scripts; access is by invitation only. You'll need both a link to the script and permission for access obtained from its author.
If you have added to your favorites a script that requires permission from the author, you'll only be able to start using the indicators after the author includes you in the script's user list. Without this, you will get an error message every time you add an indicator to the chart. In this case, contact the author to learn how to gain access. Instructions on how to contact the author are located after the script's description and highlighted within a frame. There you will also find the 'Add to favorite indicators' button.
The access can be valid until a certain date or indefinitely. If the author has granted access, you will be able to add the script to the chart.

TATAMOTORS Long for Medium TermThe stock has been in consolidation mode since July 2023 in the range of 600/- to 660/-.
It broke out of this consolidation range and closed at 671.55 today the 15th Nov 2023 with a daily volume of 11.32 mil shares against the average daily volume of 9.03mil shares.
The stock has been consolidating above its all time high of 603.80 reached on 3rd Feb 2015, however it is still inside the daily sell zone of 666/- to 678/-
INFERENCE: The stock shows strength in the current state and one can go long after a close above 678/-.
Medium Term Target: We are looking at a medium term (4 to 6 months) target of 860/-. This is about 26% on 678/-.
