KAVERI SEED (KSCL) #POSITIONAL SETUPKSCL can given good upside breakout above mentioned SUPPLY levels.
BUY in the range of 630-646, can move towards upper FIBO LEVELS (MENTIONED IN CHARTS) in coming days.
View Negates below 568 levels.
TERM

Long or Short Big target small Loss1) Bat is bullish on Day, week and monthly chart
2) Trend line is supporting its bullishness
3) Technical indicators also suggesting bull run
4) Stop Loss will be below breakout candle


IOC analysis for short term💥all studies explained in the chart
forming ascending triangle
also 3 year of downtrend channel,making lower low's and lower high's.
102-105 acting as a major resistance.
there is chance to touch once again the trendline support then can a breakout.
study guys🙏🙏
like🔹comment🔹support🥰

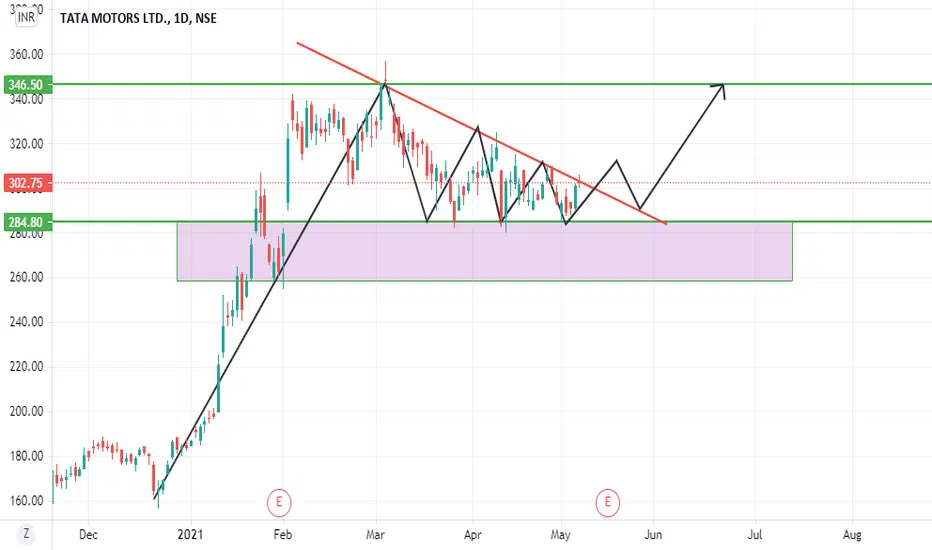
TATAMOTORS CHART BULLISH ON DAILY TIMEFRAME TARGET OF 350TATAMOTORS CHART SHOWING BULLISH PATTERN ON DAILY TIME FRAME BREAKOUT ON UPPER SIDE WILL GIVE YOU SHORT TERM TARGETS OF 350 AND LONG TERM TARGETS OF 400. IF GIVES BREAKDOWN NOT INTRESTED TO SHORT.BUYING ON RETRACE IS PREFERED AS YOU CAN HOLD WITH SMALL SL. GOOD BUY IF CLOSES DAILY CANDEL ABOVE 310. PLEASE LET ME KNOW THE ANALYSIS IN COMMENT BOX AND FOLLOW ME FOR MORE SUCH BREAKOUT PATTERNS.
PETRONET LNG Short & Simple Short term Analysis✔✔💢for risky players💢
enter @230-40 range
strict sl below 200🙏
trgt 258-275-300+🎯🎯
long 400+💰
is this Accumulation Or distribution?
🔹Fund houses/brokerage firms updating their trgt into 280-300-350 levels.
🔹Stock with good financial performance alongside good to expensive valuation.
🔹Strong Financial perfomance.
🔹Also the chart looks postive.
🔹Has been consolidating for the last 4 years.
✔197-202 is the major support level of the stock.
✔In the pademic crash the stock made a low of 170, 40% from jan high.chart below👇
✔Just 15% from it's major support(4 year support).👇
✔I am not saying 40% is small correction.yes it's a good correction.But we can see big rejection/wick candles in weekly time frame.that's why i feel it like an Accumulation.👇
I am not sure guys. I shared just my analysis✨
you can also share your views. Comment below✨
Anyway keeep watching
note this is not a stock recommendation Study then enter🙏
like💚comment💚support

MIDHANI Short & Long Term analysisstock in a consolidation mood
anytime breakout possible
buy@188 range
add @ 170 range
sl below 155
trgt 230-275-300-400
result not published.
if it publish negative result,just exit
okay thanku.

APL APOLLO TUBES🍁 Short + Long Term entry possible 🍁
enter if possible @955-920 range ❄
sl below 880❄
trgt 1100-1200❄
long 1500-2000++ ❄
stock in a accumulation mood 🏋️♀️🏋️♀️
just check it's delivery percentage.❄
highly postive👌👌
any time It can blast.....🚀🚀
so keep watching guys....❄
study🙏
about business(#copied)
❄ APL Apollo Tubes Limited (APL Apollo) is one of India’s leading branded steel products manufacturers.
❄The company has well diversified operations with product portfolio comprising of 4 primary products with different specification as per the customer need in each primary product category. the categories are:-
The categories are Apollo structural (63% of revenues), Apollo Z (18%), Apollo Tricoat (15%) & Apollo Galv (4%). The products find their use in buildings, houses, warehouses, factories, skyscrapers & industrial & agricultural activities.❄

ZENSAR TECH #IT for short term🎯🎯Buy @260-70 range 💰💰
no need of sl,if u have patience u can hold it.
trgt 300-350-400++🎯🎯
🧩the stock in a major/strong support zone ,can see the price is respecting that area that's why we shared this entry.
🧩a company with good funda.
🧩IT stocks publishing not much good result,so technical base it's a good entry,dont know about it's result.anyway i am expecting a good return in 3-6 months.
🧩the stock perfectly respecting the uptrend channel ,@260-65 range there are 2 supports
✔ fisrt one strong horizontal support
✔ second one uptrend channel support
🧩anyway i feel it's a good time to enter.
1 day frame👇👇👇respecting the uptrend channel 🔥
if u r investing study then invest.thanku
guys,🤨
please like💢💢comment💢💢support

► ADVANCE PATTERN #12: BIRLACABLE ◄► ADVANCE PATTERN #12 ◄
📌 Levels are mentioned on chart for ❝Swing trading❞. These are original and unique patterns that can achieve their target almost 80-90% times. Here, I have posted one of my favourite 💕 chart patterns.
☆ Please check the description section ⌨ for early entry level in given stock ₪ to get better Risk to Reward (☈☈) ratio.
☆ Kindly like & share ➥ this pattern. Comment ⎚ with what do you think. Follow me @ tradingview for more updates and like the chart ❤!!!
▣ Key Highlights:
➨ Time frame WEEKLY 𝓦
➨ Rounding Arc ◡
➨ Trend line ⍩
➨ Triangle Pattern ►
➨ MA 300 ↝
➨ Unique Confluence Ⓤ
📌 Levels are:
Entry: ▲ 75
SL: ☢ 65
Target: ➚ 90/115/145
RR: ☈ 1:7
Do your own study before Trade!!!
Thank you. Happy Trading!!!
Best Regards,
𝘿𝙧. 𝙎𝙝𝙖𝙢𝙧𝙖𝙟𝙖 𝙉𝙖𝙙𝙖𝙧
𝙋𝙝𝘿 𝙞𝙣 𝙏𝙚𝙘𝙝𝙣𝙤𝙡𝙤𝙜𝙮.
✬ Disclaimer ✬
--------------------------------------------------------
All investments involve risk, and the past performance of a security, industry, sector, market, financial product, trading strategy, or individual’s trading does not guarantee future results or returns. Investors are fully responsible for any investment decisions they make. Such decisions should be based solely on evaluating their financial circumstances, investment objectives, risk tolerance, and liquidity needs.
---------------------------------------------------------

HIGH PROBABILITY SETUP ON MOIL LTDFew takeaways from my analysis on MOIL LTD.
1.Inverse head& shoulder pattern breakout: stock broke out of the pattern(neckline resistance) after long consolidation period.
2.Volume spurt: breakout supported by decent volume, indicating bullishness.
3.Moving averages : stock trading above 20MA And 50MA on weekly chart, Also trading above 50MA and 200MA on daily.
4.RSI: breaking out of weekly resistance on rsi and trading above 60.
Short term view: Bullish
Timeframe used : weekly
Short term Target : 210
Note : entry not yet triggered , wait for a retest of neckline to enter.
Disclaimer: These are just my personal observations and not trading or investment tips , please do your own research or consult an investment advisor before doing any investment or trading.


IOST/USDT Long BINANCE:IOSTUSDT
This look to me very bullish even technicals are suggesting strong buy.
Price action suggest Buy.
News are positive.
Looks very promising to me every parameter supports its bullishness in upcoming trend.

LICHSGFIN at TREND LINE and SUPPORT LEVELIt may bounce back if respected this trend line may go 1st Target = 490.
Do your exercise of learning.
Learn Together :) please comment of suggestion...


R Systems International - minimised risk🎯🍁 R Systems International 🍁
✔✔ buy @110-114 range
sl below 108
trgt 127-135 🎯🎯
long 150+
period 1-4 months🌸
need patience guys
reaosons for this entry
🧩chart looks like accumulation
🧩 minimised risk(low risk high benefit)
🧩stock in a good support zone
🧩publishing good results
🧩expecting good movement in IT ZzZoon
🧩delivery volume also increasing
📍day frame -major support level📍
about the company
🔥R Systems International Limited is engaged in providing Information Technology (IT) and IT-enabled Services (ITeS) solutions and services.

DCMSHRIRAM LongDCMSHRIAM Looking bullish on chart
Kindly follow my page for or Entry/Target1/T2/T3 and SL
Note: Only for educational purpose::Kindly consult your financial advisor before taking any trade.

CESC CESC following the same pattern and tried to breakout but failed, is it sign of fall or follow the same pattern again??
Trade: 1> Bears- Short below Day Low 2>Bulls: Wait for reversal
What you think?
Waiting for your comment.....
For Entry/Target/SL do follow my page and Inbox me...
Disclaimer: I may or may not trade this, kindly consult your financial advisor before initiating any trade.

HINDUSTAN UNILEVER :: LONGPast movement shows that Hindustan Unilever always bounced back from the channel bottom::
I am on a Long side... and You???
Do follow my page and inbox me for the Entry/Target and SL..
Disclaimer: I may or may not trade this setup, do calculate the risk and consult your financial advisor before initiating any trade.

Investment (Andhra Sugar)Stock is in very good consolidation. Waiting for a proper breakout with increase in volumes to reach the mentioned targets.

ICICI Prudential Is going to the moon!!Hello!! Traders I am publishing for first time so please ignore my small mistakes.
So, now let’s talk about icici prudential this stock is fundamentally very strong .Also Due to 2nd wave of corona demand of health insurance has increased ,People are now became more aware about their insurance related benefits and planning to secure their future. So, if we use our common sense icici prudential will definitely going to boom in future.
Now let’s talk about Technical Aspects: -
It has broken it’s most crucial resistance level which it was trying to break since .After breaking it it has formed it’s new all time high . It has also cut ema 200 From down side on daily time frame which is again a bullish signal .Volumes are also supporting this trend .So it is a good pick to earn profit in this tough corona time .


Is Nifty PSE set to be in Uptrend for next 2years ????Hi
Just an observation and analysis based on charts and other technical factors
Looks like we are going to see an uptrend on NIFTY PSE i.e. >51% outstanding shares owned by Central / State govt
The list of all the PSE mentioned in the below link and individual charts are also indicating a bull run for PSE
in.investing.com
