Part 6 Institution Trading Introduction
In the world of financial markets, Options Trading has emerged as one of the most powerful instruments for traders and investors alike. While traditional stock trading involves buying or selling shares, options give you the right—but not the obligation—to buy or sell a stock at a certain price within a certain time. This opens up a wide range of possibilities: from hedging your risks to speculating on market moves with limited capital.
But as exciting as options trading is, it also carries complexity. This detailed guide will explain what options are, how they work, key terminologies, strategies, risks, and how you can practically start trading options in India.
Chapter 1: What Are Options?
An option is a financial contract between two parties—the buyer and the seller.
There are two types of options:
Call Option: Gives the buyer the right to buy the underlying asset at a specified price (strike price) before or on expiry.
Put Option: Gives the buyer the right to sell the underlying asset at a specified price before or on expiry.
Unlike stocks, options do not represent ownership. They are derivatives, meaning their value is derived from the price of an underlying asset (like Nifty 50, Bank Nifty, or Reliance stock).
Tesla

Sector Rotation & Thematic TradingIntroduction
In today's fast-moving and highly dynamic markets, investors and traders are always on the lookout for strategies that help them stay ahead of the curve. Two of the most effective approaches to identifying timely opportunities are sector rotation and thematic trading. While both aim to capitalize on broader economic trends and market cycles, they operate with different focuses and time frames.
In this in-depth guide, we’ll break down:
What sector rotation and thematic trading are
The economic and market logic behind them
How institutional and retail traders apply these strategies
Tools, indicators, and data used
Advantages and limitations
Real-world examples from Indian and global markets
1. What is Sector Rotation?
Sector rotation is a strategy based on the idea that different sectors of the economy perform better at different stages of the business or economic cycle. It involves shifting capital from one sector to another depending on macroeconomic indicators, interest rates, inflation expectations, and growth forecasts.
📊 The Four Phases of the Business Cycle:
Early Expansion (Recovery)
Best sectors: Financials, Consumer Discretionary, Industrials
Features: Low interest rates, improving earnings
Mid Expansion
Best sectors: Technology, Industrials, Materials
Features: Strong GDP growth, rising profits
Late Expansion (Peak)
Best sectors: Energy, Utilities, Consumer Staples
Features: Inflation rises, interest rates peak
Recession or Contraction
Best sectors: Healthcare, Utilities, Consumer Staples
Features: Falling GDP, layoffs, declining earnings
🎯 The Strategy:
A sector rotation strategy attempts to anticipate which sectors will benefit from upcoming economic shifts and reallocate capital accordingly. It's especially popular among mutual funds, hedge funds, and large institutions.
2. What is Thematic Trading?
Thematic trading, on the other hand, is less about economic cycles and more about long-term secular trends. Investors identify themes driven by structural, technological, demographic, or policy changes and then invest in companies and sectors that are best positioned to benefit from those trends.
🌍 Examples of Popular Themes:
Renewable energy and ESG (Environment, Social, Governance)
Artificial Intelligence and Automation
Urbanization and Infrastructure
Digital India or Rural India
5G and Telecom expansion
EV (Electric Vehicles) adoption
Defence and National Security
🧠 The Mindset:
Thematic investors think long-term—often holding investments for 3-5 years or longer—based on the belief that once a theme gains traction, it will become a structural trend that outlasts short-term market volatility.
3. Key Differences: Sector Rotation vs Thematic Trading
Feature Sector Rotation Thematic Trading
Time Frame Short to medium-term (quarterly/yearly) Medium to long-term (multi-year)
Based on Economic cycles and interest rates Structural or societal changes
Risk Exposure More cyclical risk Trend/innovation risk
Asset Allocation Dynamic and tactical Strategic and focused
Participants Institutional investors, mutual funds Retail investors, fund managers, ETFs
4. Tools & Indicators Used
🔧 Tools for Sector Rotation:
Economic Indicators: GDP, CPI, interest rates, PMI
Intermarket Analysis: Bond yields vs equity performance
Relative Strength Analysis: Compare sectors (e.g., Nifty Auto vs Nifty IT)
ETFs & Sectoral Indices: Used to gain diversified exposure
🔧 Tools for Thematic Trading:
Trend Identification Tools: News, policy announcements, budget allocations
Sectoral Fund Flows: Track DII/FII interest in certain sectors
Story-based Investing: Read into “narratives” shaping industries
Backtesting Themes: Evaluate past performance of similar themes
5. Institutional Use Case
🏦 Sector Rotation by Institutional Investors:
Large institutions like mutual funds and pension funds actively use sector rotation to outperform benchmarks. They analyze:
Quarterly earnings patterns
Interest rate hikes by RBI/Fed
Inflation readings and credit growth
For example, in 2023–24, when inflation was sticky and rates were high, many funds shifted exposure from rate-sensitive sectors (like banks) to FMCG and pharma.
🧠 Thematic Investing by Institutions:
Asset management companies (AMCs) launch thematic mutual funds around emerging stories. For instance:
ESG funds for sustainable investing
EV and mobility funds for green energy plays
PSU funds betting on disinvestment and policy push
6. Retail Investor Approach
📈 Sector Rotation for Retail:
Retail traders can rotate between:
Nifty sectoral indices (Auto, Pharma, FMCG, IT, etc.)
Sectoral ETFs or index futures
Stock baskets like smallcase
But they must remain more agile. For example, if GDP data is weak, they might move away from capital goods to consumer staples within days.
🚀 Thematic Trading for Retail:
Retail participation in themes has grown massively:
Platforms like Smallcase and Zerodha offer thematic portfolios
Many invest in the “India Infra” or “Make in India” themes
Others bet on sunrise sectors like defence or green hydrogen
7. Real-World Examples
🇮🇳 Sector Rotation in Indian Markets:
Post-COVID Recovery (2021):
IT and Pharma led the market due to global tech demand and healthcare spending.
2022 Rate Hike Cycle:
Financials performed well in rising rate environment; auto recovered with rural demand.
2023–24 Consolidation:
Defensive sectors like FMCG, PSU Banks, and Capital Goods outperformed due to policy tailwinds and infra push.
🌐 Global Sector Rotation:
In the US, sector ETFs like XLK (Tech) or XLF (Financials) are rotated based on Fed policy or earnings guidance.
2020–21 saw massive rotation from Energy to Tech, and later to Industrials and Defence due to geopolitical tensions.
🧵 Indian Thematic Trades:
EV Boom (2021–2023):
Stocks like Tata Motors, Amara Raja Batteries, and Minda Industries rallied on the EV narrative.
Defence & Atmanirbhar Bharat (2022–2024):
BEL, HAL, Bharat Dynamics soared due to increased defence budget allocations.
Green Energy (2023–ongoing):
NTPC, JSW Energy, and Adani Green attracted investor interest due to renewable targets and PLI schemes.
8. Benefits of Sector Rotation
✅ Performance Enhancement:
By shifting to outperforming sectors, investors can generate alpha.
✅ Risk Reduction:
Avoid underperforming sectors during downturns.
✅ Macro Alignment:
Matches portfolio allocation with macroeconomic realities.
✅ Short-Term Opportunities:
Can be used for weekly/monthly trading themes.
Conclusion
Both sector rotation and thematic trading are powerful frameworks to navigate the stock markets. Where sector rotation helps align with market cycles, thematic investing allows one to ride megatrends and transformational shifts. The smartest investors often use both in their strategies—riding long-term themes while tactically rotating sectors to improve returns.
The key lies in timely analysis, proper risk management, and grounded expectations. Whether you're a day trader watching sector moves or a long-term investor backing India’s green energy future, mastering these strategies can significantly boost your performance in the markets.
GIFT Nifty & SGX Nifty Correlation1. Introduction
The Indian derivatives market has witnessed a historic transformation with the shift of offshore Nifty trading from SGX Nifty (Singapore Exchange) to GIFT Nifty (Gujarat International Finance Tec-City International Financial Services Centre). This move, significant in both strategic and geopolitical terms, was designed to bring liquidity, price discovery, and market influence back to Indian jurisdiction.
The relationship or correlation between GIFT Nifty and SGX Nifty is not just about numbers; it encapsulates the evolution of India’s financial markets, regulatory reforms, and global investor behavior. This guide explains the intricate correlation between the two, contextualized by market structure, trading dynamics, and macro-financial impacts.
2. Background of SGX Nifty
Before GIFT Nifty emerged, SGX Nifty was the go-to platform for global investors to gain exposure to Indian equity markets without being subject to Indian capital controls. Introduced in 2000 by the Singapore Exchange (SGX), SGX Nifty offered Nifty 50 index futures for global investors, especially hedge funds, proprietary traders, and institutional players who wanted to trade Indian indices in USD without directly accessing the NSE (National Stock Exchange) in India.
Key Points:
Cash-settled in USD.
Available for trading ~16 hours a day.
Offered strong liquidity and price discovery overnight.
Heavily used by global institutions for hedging Indian equity exposure.
3. Emergence of GIFT Nifty
GIFT Nifty was launched in 2023 on the NSE International Exchange (NSE IX) at GIFT City (Gujarat International Finance Tec-City) as a replacement for SGX Nifty, aiming to:
Localize Nifty trading.
Bring offshore volumes back to India.
Provide tax-efficient and regulated access to foreign investors.
GIFT Nifty is the sole platform for trading international Nifty derivatives post-transition, and it is denominated in USD, keeping global appeal intact.
4. Timeline: Transition from SGX Nifty to GIFT Nifty
Important Milestones:
2018: NSE terminated its data-sharing agreement with SGX, sparking a legal and market debate.
2019–2021: Regulatory developments and infrastructure improvements at GIFT City.
July 3, 2023: Official transition from SGX Nifty to GIFT Nifty. SGX stopped offering Nifty futures.
GIFT Nifty now operates under NSE IFSC regulations and continues to serve the same investor base with enhanced Indian regulatory control.
5. Structure and Functioning: SGX vs GIFT Nifty
Feature SGX Nifty GIFT Nifty
Exchange Singapore Exchange (SGX) NSE International Exchange (NSE IX)
Currency USD USD
Underlying Index Nifty 50 Nifty 50
Settlement Cash-settled Cash-settled
Regulation MAS (Singapore) IFSCA (India)
Time Zone Singapore Time (SGT) Indian Standard Time (IST)
Taxation Singapore tax regime IFSC-friendly tax structure
While the structure is mostly similar, the jurisdiction and oversight shifted from Singapore to India.
6. Trading Hours Comparison
Exchange Trading Hours (IST)
SGX Nifty (old) 06:30 AM – 11:30 PM IST (approx)
GIFT Nifty 6:30 AM – 3:40 PM (Session 1)
markdown
Copy
Edit
**4:35 PM – 2:45 AM** (Session 2) |
GIFT Nifty provides almost 21 hours of trading — covering both Asian and U.S. market hours, similar to SGX Nifty — ensuring that international investors can continue trading Nifty seamlessly.
7. Price Discovery and Global Influence
SGX Nifty's Role:
SGX Nifty was often viewed as the early indicator for Nifty 50 due to its early start.
It reflected overnight global cues (US, Asian markets).
It had strong influence over NSE opening gaps.
GIFT Nifty's Continuity:
Now assumes SGX Nifty’s role in overnight price discovery.
GIFT Nifty trading between 4:35 PM and 2:45 AM IST captures US and Europe market reactions.
Acts as a lead indicator for Nifty’s direction in the Indian market.
Thus, the correlation pattern of market impact continues, just the platform has shifted.
8. Liquidity and Volume Shifts
Pre-Transition:
SGX Nifty volumes averaged USD 1–1.5 billion/day.
Liquidity was concentrated in Singapore due to ease of access.
Post-Transition:
GIFT Nifty quickly absorbed liquidity, crossing $1 billion in daily turnover within weeks of launch.
Leading global market makers and brokers now operate from GIFT City.
Trading is supported by IFSCA-approved entities and clearing corporations like NSE IFSC Clearing Corporation.
The liquidity correlation was maintained as investors smoothly moved to GIFT Nifty.
9. Institutional Participation and Derivative Strategies
Institutional investors still require Nifty derivatives to hedge equity portfolios.
GIFT Nifty options and futures offer equivalent utility as SGX Nifty did.
Hedge funds, FPIs, global trading desks have migrated their Nifty-linked strategies to GIFT City.
Because GIFT Nifty is cash-settled and USD-denominated, hedging and arbitrage strategies remain unaffected.
Correlation in terms of usage and derivative structuring remains intact.
10. Impact on Indian Traders
Retail Indian traders are not directly impacted because both SGX and GIFT Nifty were/are offshore products.
However, GIFT Nifty can be tracked through price feeds and platforms like NSE IFSC, Refinitiv, Bloomberg, etc.
Indian traders still monitor GIFT Nifty early morning to assess gap-up/gap-down expectations.
So, GIFT Nifty remains a sentiment barometer, just like SGX Nifty was.
Conclusion
The GIFT Nifty-SGX Nifty correlation is best described as a seamless transition of purpose, structure, and function from one platform to another — with jurisdiction and regulatory benefits tilting in India's favor. While SGX Nifty served global investors well for over two decades, GIFT Nifty now fulfills the same role with greater regulatory sovereignty, tax efficiency, and strategic national interest.
Key takeaway:
SGX Nifty and GIFT Nifty are fundamentally correlated in utility and influence — but GIFT Nifty is the future.
Algo-Based Options Trading & AutomationIn the modern trading landscape, technology is not just a supporting tool—it’s the central force reshaping how markets function. Nowhere is this more visible than in options trading, where algorithmic trading (or “algo trading”) is taking over traditional manual strategies. With increased speed, accuracy, and scalability, automation in options trading is transforming retail and institutional participation alike.
This guide breaks down everything you need to know about algo-based options trading: what it is, how it works, what strategies are used, its pros and cons, and how automation is practically implemented in today's markets.
1. What is Algo-Based Options Trading?
Algo-based options trading involves using computer programs to execute options trades based on pre-defined rules and mathematical models. These programs analyze market data, identify trading signals, and place orders automatically—often much faster and more accurately than humans can.
The key components include:
Predefined logic or strategy (e.g., "Buy a call option when RSI < 30 and price is above 50-DMA")
Real-time market data feed
Execution engines that place and manage orders without manual intervention
Risk management modules to monitor exposure, margin, and stop-losses
2. Why Use Algo Trading in Options Instead of Manual Trading?
Options are complex instruments. Their prices are influenced by multiple variables like time decay, implied volatility, strike price, delta, gamma, and more.
Humans can’t always process this data fast enough, especially during high-volatility events. Here’s where algos shine:
Manual Trading Algo Trading
Emotion-driven Emotionless and consistent
Slower execution Millisecond-level speed
Prone to fatigue Runs 24/7 without breaks
Hard to backtest Easily backtested and optimized
Limited scalability Can manage thousands of trades simultaneously
3. Core Components of an Options Algo Trading System
To build or understand an automated options trading system, it’s essential to know its primary components:
A. Strategy Engine
This is the brain of the system. It defines:
Entry/Exit conditions (based on indicators like RSI, MACD, IV percentile, etc.)
Type of options to trade (call, put, spreads, straddles, etc.)
Timeframe (intraday, weekly, monthly)
Underlying asset and strike price selection logic
B. Data Feed & Market Scanner
Live option chain data from exchanges like NSE or brokers like Zerodha, Upstox
IV, OI, delta, gamma, theta, vega data
Historical data for backtesting
C. Order Management System (OMS)
This handles:
Order placement
Modifications (e.g., SL changes)
Cancel/re-entry logic
Smart order routing (SOR)
D. Risk Management Module
Risk management is critical. The automation should enforce:
Maximum daily loss limits
Exposure per trade
Position sizing based on capital
Portfolio hedging logic
E. Logging and Monitoring
Every trade, price, and action is logged for audit and improvement. Some systems send alerts via Telegram, email, or SMS.
4. Common Algo Strategies Used in Options Trading
1. Delta-Neutral Strategies
Goal: Profit from volatility while maintaining a neutral directional view.
Examples: Straddle, Strangle, Iron Condor
How Algos Help: Adjust delta automatically by hedging with futures or adding more legs
2. Trend Following with Options
Algos can detect breakouts and directional momentum and buy/sell options accordingly.
Example: Buy call when price crosses above 20-DMA and volume spikes
Add-ons: Use trailing SLs, exit when RSI > 70
3. Option Scalping
Used in very short timeframes (1m, 5m candles). Algo enters/exits trades rapidly to capture small moves.
Needs: Super-fast execution and co-location
Popular in: Weekly expiry trading
4. IV-Based Mean Reversion
Buy when Implied Volatility (IV) is abnormally low or sell when it’s high.
Algos monitor: IV percentile, skew, vega exposure
5. Open Interest & Volume Based Strategies
Breakout Strategy: Detect long buildup or short covering using OI change + price movement
Algo filters trades: Where volume > 2x average and OI shows new positions being created
5. Platforms and Tools for Algo Options Trading
Even retail traders can now access automation tools without knowing how to code.
No-Code Platforms:
Tradetron
Streak by Zerodha
AlgoTest
Quantiply
These platforms offer:
Drag-and-drop strategy builders
Live market connections
Backtesting features
Broker integrations
Custom Python/C++ Based Systems
Used by advanced retail or prop firms. These offer:
Full control and flexibility
Integration with APIs like:
Zerodha Kite Connect
Upstox API
Interactive Brokers
Summary and Final Thoughts
Algo-based options trading is not just for hedge funds anymore. With accessible platforms, cloud computing, and APIs, even retail traders can build, test, and deploy automated strategies.
However, success in algo trading depends on:
Solid strategy design (math + market logic)
Risk management above all
Continuous monitoring and iteration
Avoiding over-reliance on backtests
Staying compliant with broker and SEBI norms
Options Trading Strategies (Weekly/Monthly Expiry Focused)In today’s fast-paced financial world, options trading has become a vital part of many traders' toolkits—especially those who focus on weekly or monthly expiry contracts. These expiry-based strategies offer flexibility, potential for quick profits, and can be customized based on market outlook, volatility, and risk appetite.
Whether you're a beginner aiming to earn consistent returns or an experienced trader managing large portfolios, understanding expiry-focused strategies will help you become a more efficient and confident trader.
What Are Weekly and Monthly Expiry Options?
Before we dive into strategies, let’s first clarify:
Weekly Expiry Options: These contracts expire every Thursday (or Wednesday if Thursday is a holiday). Weekly options are available for indices like Nifty, Bank Nifty, and many liquid stocks.
Monthly Expiry Options: These expire on the last Thursday of every month. Monthly options are more traditional and have been around since the inception of options trading.
Both types follow the same structure but differ in time to expiry, premium decay, trading psychology, and risk-reward dynamics.
Why Trade Based on Expiry?
Expiry-based strategies offer unique advantages:
Time Decay (Theta): Premiums erode faster closer to expiry—benefiting option sellers.
Predictable Volatility Patterns: Volatility tends to fall post major events (RBI, Fed, earnings), making short strategies viable.
Quick Capital Turnover: Weekly expiry allows 4–5 trading opportunities in a month.
Defined Risk: You can design strategies where loss is capped (e.g., spreads, iron condors).
Popular Weekly & Monthly Expiry Strategies
Let’s break down some of the most effective strategies used by traders during expiries:
1. Covered Call (Best for Monthly Expiry)
What It Is:
A covered call involves buying the underlying stock and selling a call option against it.
Use Case:
Suitable for investors holding stocks expecting sideways to mildly bullish movement.
Monthly expiry works better due to better premium.
Example:
You own 1 lot (50 shares) of TCS at ₹3500. You sell a monthly ₹3600 call for ₹40 premium.
If TCS stays below ₹3600, you keep the full ₹2000 (₹40 x 50) premium.
Risk/Reward:
Risk: Falls in stock price.
Reward: Limited to premium + upside until strike price.
2. Naked Option Selling (Weekly)
What It Is:
Selling a call or put option without holding the underlying. It’s risky but very popular during weekly expiry, especially on Thursdays.
Use Case:
Traders use it on expiry day for quick theta decay.
Needs strong trend or range view.
Example:
On Thursday, Nifty is at 22,000. You sell 22,200 Call and 21,800 Put, each for ₹10.
If Nifty stays in between, both go to zero—you keep ₹20.
Risk/Reward:
Risk: Unlimited.
Reward: Limited to premium received.
Tip: Always monitor positions or hedge to manage losses.
3. Iron Condor (Weekly/Monthly)
What It Is:
An Iron Condor involves selling OTM Call and Put, and simultaneously buying further OTM Call and Put to limit losses.
Use Case:
Best for range-bound markets.
Weekly iron condors are common in Nifty/Bank Nifty due to fast premium decay.
Example (Weekly Iron Condor):
Nifty spot: 22,000
Sell 22,200 CE and 21,800 PE
Buy 22,300 CE and 21,700 PE
Net credit: ₹40
Max profit = ₹40
Max loss = ₹60 (difference in strike – net credit)
Risk/Reward:
Risk: Capped.
Reward: Capped.
Ideal for non-directional markets.
4. Calendar Spread (Weekly vs Monthly)
What It Is:
You sell a near-term option (weekly) and buy a far expiry option (monthly) on the same strike.
Use Case:
Traders expecting low short-term volatility but high long-term movement.
Volatility plays a crucial role.
Example:
Sell 22,000 CE (weekly) at ₹80
Buy 22,000 CE (monthly) at ₹120
Net debit: ₹40
If Nifty remains around 22,000 till weekly expiry, the short option loses premium quickly.
Risk/Reward:
Risk: Limited to net debit.
Reward: Can be significant if timing is right.
5. Straddle (Monthly/Weekly)
What It Is:
A straddle is buying or selling the same strike price Call and Put.
Types:
Long Straddle: Expecting big move (buy both).
Short Straddle: Expecting low movement (sell both).
Example (Short Weekly Straddle):
Nifty at 22,000
Sell 22,000 CE at ₹60
Sell 22,000 PE at ₹60
Total premium = ₹120
If Nifty closes near 22,000, both decay—you pocket the premium.
Risk/Reward:
Short Straddle Risk: Unlimited.
Long Straddle Risk: Limited to premium paid.
Weekly expiries give better opportunities due to quick decay.
6. Strangle (Weekly Special)
What It Is:
Sell OTM Call and OTM Put (Short Strangle) or buy both (Long Strangle).
Use Case:
Short Strangle is very popular on Thursday.
Use when expecting low volatility.
Example (Short Strangle):
Nifty at 22,000
Sell 22,300 CE and 21,700 PE at ₹20 each
If Nifty expires between 21,700–22,300, both go worthless.
Risk/Reward:
Risk: Unlimited.
Reward: Limited to ₹40.
Tip: Add hedges or monitor closely to avoid slippage on big moves.
✅ Conclusion
Weekly and monthly expiry-focused options strategies can be a goldmine when used smartly. Each strategy has its place—some are built for income, others for momentum or volatility plays. The trick lies in matching the right strategy with market context, expiry timeline, and your risk appetite.
For beginners, start small—paper trade or use small lots. For experienced traders, explore advanced hedged strategies like Iron Condor, Calendar Spread, and Butterflies for consistent profits.
In expiry trading, discipline, risk control, and clear bias are your best tools. Don’t treat expiry days as gambling sessions. Treat them as structured opportunities to benefit from predictable market behavior.
Trading master class with experts ➤ Definition:
Trading is the act of buying and selling financial instruments (like stocks, commodities, currencies, or derivatives) with the intention of making a profit over short to medium timeframes. Traders do not necessarily hold positions for the long term. They react to price movements and market trends.
➤ Core Features of Trading:
Short-Term Focus: Hours to weeks.
Active Management: Constant monitoring of charts, news, and prices.
Profit from Price Movement: Traders capitalize on volatility and momentum.
Risk Management: Stop-loss and position sizing are vital.
Types: Intraday trading, swing trading, scalping, positional trading.
➤ Pros:
Quick returns possible.
Flexibility in strategy.
Can be automated (algo/quant trading).
Capitalize on both bullish and bearish markets.
➤ Cons:
High risk due to leverage and volatility.
Emotionally draining.
Requires high skill and market understanding.
Brokerage, slippage, and taxes eat profits if not careful.

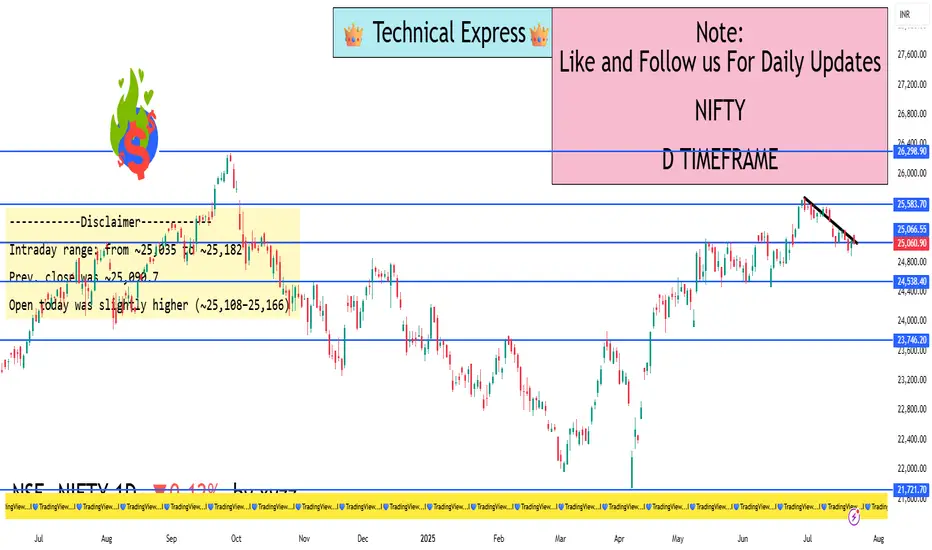
Nifty 1D Timeframe📈 Nifty 50 – Market Overview
Opening Level: Nifty 50 opened positive above 25,100, continuing momentum from the previous session.
Intraday High: Touched around 25,166 during the early session.
Intraday Low: Hovered around 25,111 in the later session.
Current Range: Mostly trading between 25,110 to 25,160, with a slight upward bias.
Previous Close: Around 25,090.
Current Gains: Around +0.1% to +0.3% for the day.
🔍 What’s Driving Nifty Today
Banking Sector Strength: Strong performance from HDFC Bank, ICICI Bank, and other financial stocks lifted the index.
Quick Commerce Rally: Companies like Eternal (Zomato parent) showed double-digit gains, adding upward pressure.
Volatility Decline: The India VIX dropped nearly 3%, suggesting reduced market fear and more stable price action.
Mid-Session Profit Booking: Sectors like Realty, Pharma, and Media witnessed some selling, causing small dips during the day.
📊 Technical Snapshot
Support Level: Immediate support seen around 25,100, below which the next strong zone is around 24,950.
Resistance Level: Strong resistance around 25,160–25,200, with breakout potential toward 25,300–25,400 if breached.
Trend Outlook: The market is holding a bullish tone, with minor intraday corrections typical in a trending market.
💡 Traders’ Perspective
Direction Trigger Level Expected Move
Bullish Scenario Above 25,166–25,200 Target next zone between 25,300–25,400
Neutral/Range-bound Between 25,100–25,160 Choppy movement, watch sector rotation
Bearish Scenario Below 25,100 Possible quick slide toward 24,950–25,000
✅ Summary
Today’s session on Nifty 50 shows mild positivity driven by financial stocks and quick-commerce momentum. The market remains range-bound near recent highs, with sectors like realty and pharma underperforming. The index is showing strength above 25,100, and a breakout above 25,200 could lead to further upside in the coming days
Elliott Waves Insights: Tesla’s Roadmap to SuccessHello friends, let's analyze Tesla's chart using theory. This is a 4-hour chart where we can clearly see that the higher degree, primary degree wave ((3)) in black has been completed. Currently, we're on the verge of completing wave ((4)) in black of the primary degree, which has three subdivisions marked in blue as (A), (B) & (C).
(A) and (B) are completed, and (C) is near completion. Within (C), we have five subdivisions in red, of which 1, 2, 3, & 4 are completed, and the 5th is also more than 60% complete. Once the red fifth is complete, it will mark the end of blue (C) and primary degree wave ((4)) in black.
As soon as wave ((4)) is complete, we can expect a reversal, which should be wave ((5)). Which should cross the high of wave ((3)) which is ATH, So, we're expecting wave ((5)) to start move upwards.
Now, friends, what's the invalidation level for this view? It's $139.20. This is a level that wave ((4)) should not cross, as it's the low of black wave ((2)). According to theory, wave 2 cannot retrace more than 100% of wave 1, wave 3 cannot be the shortest in impulse, and wave 4 cannot enter the territory of wave 1, which is here we’re witnessing in current scenario, which is considering we’re in any diagonal or triangle of higher degree.
If wave ((4)) crosses $139.20, it will invalidate our view. We might be missing some dots to join or create the picture perfectly. Currently, the price is around $222, and we might see a small bounce before making a lower low possibly around $200. If we witness a divergence there, it could lead to a reversal.
Please note that this study uses theory and structures, involves multiple possibilities, and focuses on one potential scenario. There's a risk of being completely wrong. This is for educational purposes only, and users should not trade or invest solely based on this study.
I am not Sebi registered analyst.
My studies are for educational purpose only.
Please Consult your financial advisor before trading or investing.
I am not responsible for any kinds of your profits and your losses.
Hope this post is helpful to community
Thanks
RK💕
Disclaimer and Risk Warning.
The analysis and discussion provided on in.tradingview.com/u/RK_Charts/ is intended for educational purposes only and should not be relied upon for trading decisions. RK_Charts is not an investment adviser and the information provided here should not be taken as professional investment advice. Before buying or selling any investments, securities, or precious metals, it is recommended that you conduct your own due diligence. RK_Charts does not share in your profits and will not take responsibility for any losses you may incur. So Please Consult your financial advisor before trading or investing.

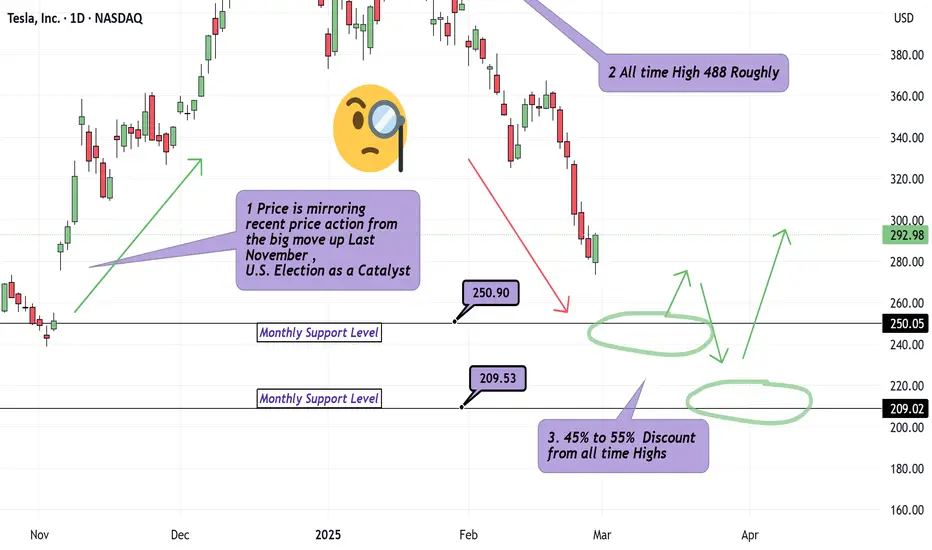
What is an Appropriate Tesla Discount? Multiple Timeframes!Hello Traders.. It's been too long.
We are back with our first analysis in over 4 months. We answer : What is an appropriate price to either jump on the train or scale into original positions on Tesla? Jumping in around 250, probably decent for at least a 4Hr to Daily Chart Swing. Safer Longs appear to be around 209 as I have outlined with green arrows, labeling the multiple pivots in the recent 5 Year range on Tesla. Tesla is coming down alongside the broader Indices which can be expected. Just because Friday Feb 28th showed us a Solid Hammer looking candle suggesting strong buying power, this does not mean much to me for 3 reasons.
1) This price action has developed in the middle of the move up we observed during Election week late last year.
2) The candle closed without a top wick and so the next daily candle , in theory, has no range to fill moving forward.
3) Momentum at the moment is also Bearish.
Discipline Traders! Leave a comment or Boosted rocket if you'd like to see similar analysis.
Where to Long $NASDAQ:TSLA NASDAQ:TSLA
Where to Long it. ??
for me its better to wait untill the Price come to its best support.
Observe near 380 or let the price show action after touching it.
NASDAQ:TSLA
Please Comment if have to Say on it.
i will not take it offensive :D
⚠️Disclaimer: We are not registered advisors. The views expressed here are merely personal opinions. Irrespective of the language used, Nothing mentioned here should be considered as advice or recommendation. Please consult with your financial advisors before making any investment decisions. Like everybody else, we too can be wrong at times ✌🏻

Tesla Next Target is Top of the Channel +26% ROITesla, a Breakout occurred from the Triangle Pattern after reaching the 0.5 Fibonacci Retracement level, and it's also trading within a Channel Pattern. The Next Target is the Top of the Channel.


TESLA : Bullish - Butterfly-Wolfe Wave-Head Shoulders inverseTESLA : Bullish - Butterfly-Wolfe Wave-Head Shoulders inverse
A butterly was detected since several weeks
We have also a Head shoulders inverse
and a Wolf Wave Bullish
then the market can reach 207 and the 233 $
To monitor the EMA.50 and EMA.200 and ICHIMOKU "kijun"
NB : Divergences ROC and RSI , bullish

TESLA - Best Opportunity for Long Term InvestmentPrice is at extreme discount and provides opportunity for long term investment.
Price can violate the low around 101 and immediately target the buyside liquidity above 300.
Price may also fail to violate the sellside liquidity around 101 and continue higher indicating a failure swing reversal.
Both the scenario indicates bullishness in TESLA.

Dogecoin (DOGE) Bull Run Analysis Target Toward $4Dogecoin (DOGE) Bull Run Analysis
Target: $4 (~25x from current level)
Technical Analysis (Elliott Wave Count):
According to my Elliott Wave count, DOGE is positioned to reach $4 in this bull run, representing nearly a 25x gain.
Earlier, I suggested a buy entry around the $0.07 level, which has already yielded a 200% profit.
Fundamental News:
Recent news indicates that Tesla has updated its payment methods to include #Dogecoin, which further fuels a bullish outlook for DOGE.
Key Takeaways:
Maintain a close watch on the bullish trend and Elliott Wave count for potential upward momentum.
The inclusion of DOGE in Tesla's payment methods could act as a catalyst for further gains.

Tesla for long termTesla is expected to be purchased at around 127 dollars with a target of over 200% increase. I am looking at this investment with a long-term perspective. If the price drops to my buying level, I will definitely consider investing a significant amount. I have already initiated my investment and anticipate a further 20% decrease. It will be interesting to see how my prediction plays out.

Tesla looking good for a BUY trade1:2 trade setup in Tesla on buy side. Tesla is bouncing from CPR and once it crosses 50 Ema, it can be bought for upside gains.

Looking for LongTSLA formed descending channel which you can see on the left side of the chart which has been broken impulsively & forming a correction to make a move to the upside. Expecting target to reach at 425

Long Tesla for target of 325 to 350Tesla is getting ready for a move and currently forming flag and pole pattern on weekly charts. In case it breaks out of this pattern on upper side then targets on weekly charts are
T1 - 300
T2 - 325
T3 - 350
Stop loss 190 on closing basis (weekly)
Happy Trading !

Long Opportunity Below 200$TESLA is forming a correction & expecting to reach below 200$ looking for opportunity for long once its reached down below.

Anticipating Tesla to reach 320 within Wave V.Anticipating Tesla to reach 320 within Wave V.
In Elliott Wave Theory, the concept of "Wave V" represents the final major move in a five-wave sequence. It is usually the wave that follows after Wave IV, and it often leads to the end of a significant trend. In the case of Tesla stock (TSLA), anticipate it to reach 320 within Wave V.

Tesla Nearing its bottom - AccumulateTesla formed a Head and Shoulder pattern on charts and have fallen from 222 to 140 already.
Its nearing the bottom and currently at first support level. The support levels are marked on the charts. $118 is strong support if it continues to fall further.
Recommendation is to start accumulating the shares in small quantity from now.

