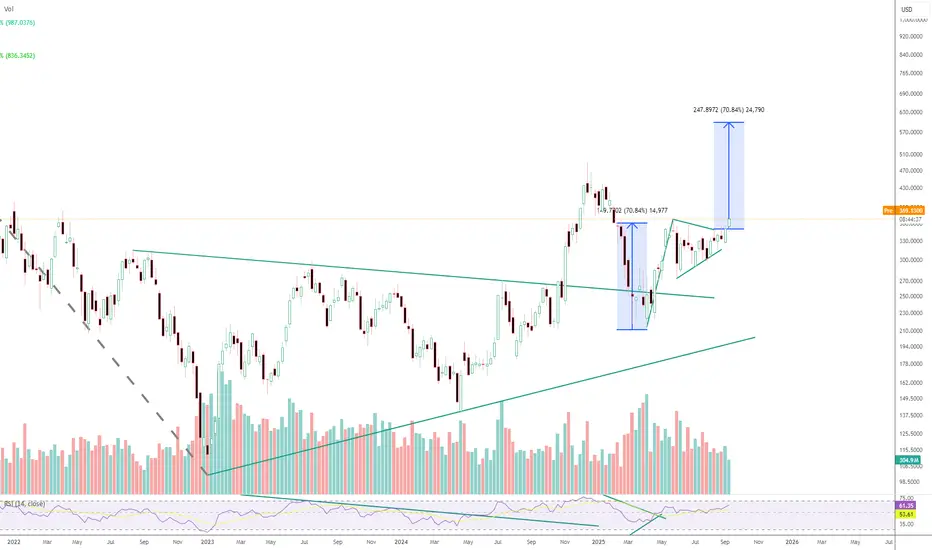
Tesla - Flag & Pennant Pattern BreakoutTesla breaking out of a Flag & Pennant Pattern that may take it to new all time highs
Teslaanalysis
Basics of Derivatives in IndiaIntroduction
The financial market is like a vast ocean where investors, traders, institutions, and governments interact. Within this ocean, different instruments allow participants to manage risk, invest, or speculate. One of the most powerful tools in modern finance is Derivatives.
In India, derivatives have become an essential part of the stock market, commodity market, and even the currency market. They allow investors to hedge risk, speculate on price movements, and improve liquidity. Since the early 2000s, India’s derivative market has grown to become one of the largest in the world.
This write-up will explain derivatives in India in simple, detailed, and structured language, covering their meaning, types, uses, risks, and the overall market structure.
1. Meaning of Derivatives
A Derivative is a financial instrument whose value is “derived” from the price of another underlying asset. The underlying asset can be:
Stocks (Equities)
Indices (Nifty 50, Bank Nifty, Sensex, etc.)
Commodities (Gold, Silver, Crude Oil, Wheat, Cotton, etc.)
Currencies (USD/INR, EUR/INR, etc.)
Interest Rates or Bonds
The derivative itself has no independent value — it is only a contract based on the future value of the underlying asset.
Example:
Suppose Reliance Industries stock is trading at ₹2,500. You and another trader enter into a derivative contract (say, a future) where you agree to buy Reliance stock after one month at ₹2,600. The value of your contract will move up or down depending on Reliance’s market price in the future.
2. History of Derivatives in India
The journey of derivatives in India is relatively new compared to developed markets like the US.
Before 2000: Indian markets mainly had spot trading (buying/selling shares). Informal forward trading existed but was unregulated.
2000: SEBI (Securities and Exchange Board of India) introduced derivatives officially. NSE launched index futures on Nifty 50 as the first derivative product.
2001: Index options were introduced.
2002: Stock options and stock futures were introduced.
2003 onwards: Derivatives expanded to commodities (MCX, NCDEX) and later to currencies.
Present: India has one of the world’s most actively traded derivatives markets, with Nifty and Bank Nifty options among the highest traded globally.
3. Types of Derivatives
There are four primary types of derivatives:
(a) Forward Contracts
A forward contract is a customized agreement between two parties to buy or sell an asset at a future date at a pre-decided price.
These contracts are over-the-counter (OTC), meaning they are private and not traded on exchanges.
Example: A farmer agrees to sell 100 quintals of wheat to a trader at ₹2,000/quintal after three months.
Issues: High risk of default because there’s no exchange guarantee.
(b) Futures Contracts
Futures are standardized forward contracts that are traded on exchanges (NSE, BSE, MCX).
The exchange guarantees settlement, reducing counterparty risk.
Example: Buying a Nifty 50 Futures Contract expiring in September at 24,000 means you’re betting Nifty will be higher than that price.
Key Features:
Standardized contract size
Daily settlement (Mark-to-Market)
High liquidity
(c) Options Contracts
An option gives the buyer the right but not the obligation to buy or sell an underlying asset at a fixed price before or on a certain date.
Types of options:
Call Option: Right to buy
Put Option: Right to sell
Example: You buy a Reliance Call Option at ₹2,600 strike price. If Reliance rises to ₹2,800, you can exercise your option and profit. If the stock falls, you can let the option expire by only losing the premium paid.
(d) Swaps
A swap is a contract where two parties exchange cash flows or liabilities.
In India, swaps are mainly used by institutions, not retail traders.
Example: An Indian company with a loan at floating interest rate swaps it with another company having a fixed interest rate loan.
4. Derivative Instruments in India
In India, derivatives are available in:
Equity Derivatives: Nifty Futures, Bank Nifty Options, Stock Futures & Options.
Commodity Derivatives: Gold, Silver, Crude Oil, Agricultural commodities (via MCX, NCDEX).
Currency Derivatives: USD/INR, EUR/INR, GBP/INR futures and options.
Interest Rate Derivatives: Limited but available for institutional participants.
5. Participants in the Derivative Market
Different participants enter derivatives for different purposes:
Hedgers
Businesses or investors who want to protect themselves from price volatility.
Example: A farmer hedging against falling crop prices.
Speculators
Traders who try to make profits from price fluctuations.
Example: Buying Nifty options hoping for a rally.
Arbitrageurs
They exploit price differences between markets.
Example: If Reliance stock trades at ₹2,500 in the spot market but the futures is at ₹2,520, arbitrageurs will sell futures and buy in spot to lock in profit.
Margin Traders
Traders who use leverage (borrowed money) to amplify gains and losses.
6. Role of SEBI and Exchanges
SEBI is the regulator of the Indian derivative market. It ensures transparency, fairness, and prevents market manipulation.
NSE & BSE provide trading platforms for equity derivatives.
MCX & NCDEX are major exchanges for commodities.
Clearing Corporations ensure smooth settlement and eliminate counterparty risk.
7. Trading Mechanism in Indian Derivatives
Open a demat and trading account with a broker.
Maintain margin money to enter into derivative trades.
Place orders (buy/sell futures or options).
Daily profit/loss is settled through Mark-to-Market (MTM).
On expiry date, contracts are either cash-settled or physically settled.
8. Margin System in India
Initial Margin: Minimum amount required to enter a derivative position.
Maintenance Margin: Minimum balance to be maintained.
Mark-to-Market Margin: Daily profit/loss adjustment.
This ensures traders don’t default.
9. Risks in Derivatives
While derivatives offer opportunities, they are risky:
Market Risk: Sudden price movements can cause big losses.
Leverage Risk: Small margin allows big positions, amplifying losses.
Liquidity Risk: Some contracts may not have enough buyers/sellers.
Operational Risk: Mismanagement or technical issues.
Systemic Risk: Large defaults affecting the whole market.
10. Advantages of Derivatives in India
Risk Management (Hedging)
Price Discovery
High Liquidity (especially Nifty & Bank Nifty options)
Lower Transaction Costs compared to cash markets
Speculative Opportunities
11. Real-Life Examples in Indian Market
Nifty & Bank Nifty Options: Most traded globally, used by retail traders, institutions, and FIIs.
Reliance Futures: Highly liquid individual stock future.
Gold Futures on MCX: Popular among commodity traders.
USD/INR Futures: Widely used by importers/exporters to hedge currency risk.
12. Growth of Derivatives in India
India is among the largest derivative markets globally by volume.
NSE ranked No.1 worldwide in derivatives trading (by contracts traded) for several years.
Rising retail participation due to online trading platforms and lower costs.
13. Challenges in Indian Derivatives Market
High speculation and retail losses due to lack of knowledge.
Complexity of products for small investors.
Need for better risk management education.
Regulatory challenges in commodities (e.g., banning certain agri contracts due to volatility).
Conclusion
Derivatives in India have grown from a niche financial instrument to a core pillar of financial markets. They provide risk management, speculation, arbitrage, and liquidity benefits. However, they are a double-edged sword — while they can magnify profits, they can also magnify losses.
For Indian traders and businesses, understanding derivatives is crucial. From Nifty and Bank Nifty options dominating retail trade to commodity hedging by farmers and corporates, derivatives touch every corner of the economy.
As SEBI continues to strengthen regulations and technology makes access easier, the future of derivatives in India looks promising, provided participants use them wisely with proper risk management.

Part 6 Learn Institutional TradingHow Options are Priced
Options are more complex than stocks because they have two value components:
Intrinsic Value = Difference between spot price and strike price (if profitable).
Time Value = Extra premium traders pay for the possibility of future moves.
The pricing is influenced by The Greeks:
Delta: Sensitivity of option price to underlying asset moves.
Theta: Time decay (options lose value as expiry nears).
Vega: Impact of volatility on option price.
Gamma: Rate of change of delta.
Understanding Greeks is essential for advanced option strategies.
Types of Options
Options exist across asset classes:
Equity Options: Stocks like Reliance, TCS, Infosys.
Index Options: Nifty, Bank Nifty, Sensex.
Currency Options: USD/INR, EUR/INR.
Commodity Options: Gold, Crude oil, Agricultural products.

Part 3 Trading Master ClassIntroduction
Options trading is one of the most fascinating and versatile aspects of the financial markets. Unlike stocks, which give ownership in a company, or bonds, which provide fixed income, options are derivative instruments whose value is derived from an underlying asset such as stocks, indices, commodities, or currencies. They give traders the right, but not the obligation, to buy or sell the underlying asset at a predetermined price before a specific expiration date.
Because of this unique characteristic, options allow traders and investors to design strategies that suit a wide range of market conditions—whether bullish, bearish, or neutral. Through careful strategy selection, one can aim for limited risk with unlimited upside, hedge existing positions, or even profit from sideways markets where prices don’t move much.
This article explores options trading strategies in detail. We’ll cover the building blocks of options, common strategies, advanced combinations, and risk management. By the end, you’ll have a strong foundation to understand how professional traders use options to manage portfolios and generate returns.
Risk Management in Options Trading
Options carry significant risks if misused. Successful traders emphasize:
Position Sizing: Never risk too much on one trade.
Diversification: Spread across multiple strategies/assets.
Stop-Loss & Adjustments: Exit losing trades early.
Implied Volatility (IV) Awareness: High IV increases premiums; selling strategies may be better.

Part 1 Ride The Big MovesKey Terminologies in Options
Before diving deeper, you need to know the “language of options.”
Strike Price → The fixed price at which you can buy/sell (like 2500 in Reliance example).
Premium → The cost you pay to buy an option.
Expiry Date → Options have a life—weekly, monthly, quarterly. After expiry, they are worthless.
Lot Size → Options are not traded in single shares. They come in fixed quantities called lots (e.g., Nifty lot size = 50).
In the Money (ITM) → Option has intrinsic value.
Out of the Money (OTM) → Option has no value (only time value).
At the Money (ATM) → Strike price = Current market price.
How Option Prices Are Decided
Option premiums are not random. They are influenced by:
Intrinsic Value (IV) → Difference between current price and strike price.
Example: Reliance at ₹2600, Call 2500 → Intrinsic value = ₹100.
Time Value → More time till expiry = higher premium.
Volatility → If a stock is volatile, options are expensive because chances of big movement are high.
Interest rates & Dividends → Minor but relevant in longer-term options.

PSU & Infrastructure RallyIntroduction
The Indian stock market often moves in cycles—sometimes technology stocks lead, sometimes consumption stocks take the front seat, and sometimes financials dominate the headlines. In recent years, one of the strongest and most eye-catching trends has been the rally in Public Sector Undertakings (PSUs) and Infrastructure stocks.
This rally has surprised many investors. For decades, PSU stocks were treated as “slow movers,” known for dividends but not for sharp price appreciation. Infrastructure companies also had their share of challenges—debt burdens, project delays, and regulatory hurdles. Yet, from 2020 onwards, both these sectors have staged a powerful comeback, creating significant wealth for investors.
In this essay, we will break down the reasons behind the PSU & Infrastructure rally, the role of government policies, investor psychology, macroeconomic conditions, and future outlook. We will also examine challenges, risks, and strategies investors can consider.
1. Understanding PSU & Infrastructure Sectors
1.1 What are PSUs?
Public Sector Undertakings (PSUs) are companies where the Government of India holds a majority stake (usually above 51%). These companies were originally created to control strategic industries, ensure employment, and provide services to the public.
They operate across sectors:
Energy & Oil: ONGC, Oil India, IOC, BPCL, HPCL.
Banking & Financials: SBI, Bank of Baroda, PNB, LIC.
Power & Utilities: NTPC, Power Grid, NHPC, SJVN.
Defence & Engineering: HAL, BEL, BEML, Cochin Shipyard.
Infrastructure-linked: IRCTC, IRFC, RVNL, NBCC.
For a long time, PSU stocks were considered "value traps." Investors believed these companies were controlled by government decisions rather than pure profit motives. But things have started to change.
1.2 What is the Infrastructure Sector?
The infrastructure sector includes companies involved in building and maintaining physical systems like roads, railways, airports, ports, bridges, housing, water supply, and energy projects.
Key players include:
Construction companies: L&T, NCC, KNR Construction.
Railways & Transport: RVNL, IRCON, IRFC.
Power & Energy Infrastructure: NTPC, Adani Transmission, Power Grid.
Cement & Steel (linked to infra growth): UltraTech Cement, JSW Steel.
Infrastructure is often called the backbone of the economy. A country’s GDP growth depends heavily on the quality of its infrastructure.
2. Why Are PSU & Infrastructure Stocks Rallying?
The rally is not a coincidence. Several structural, policy-driven, and global factors are working together. Let’s break them down:
2.1 Government Push on Capital Expenditure (Capex)
One of the biggest drivers is the Indian government’s consistent increase in infrastructure spending.
In Union Budgets (2022–2025), capital expenditure has grown at double-digit rates.
The government has allocated massive funds for roads, highways, railways, and renewable energy.
The National Infrastructure Pipeline (NIP) plans ₹111 lakh crore investment in infrastructure between 2019 and 2025.
Programs like Gati Shakti, Smart Cities Mission, and Bharatmala are boosting construction activity.
This creates a multiplier effect: cement demand rises, construction companies get more projects, railway stocks gain, and PSU banks benefit by financing these projects.
2.2 Revival of PSU Banks
PSU banks, once seen as weak due to Non-Performing Assets (NPAs), have staged a dramatic recovery.
Bad loans have reduced significantly.
Credit growth is at record highs (double-digit growth in 2023–25).
PSU banks are reporting all-time high profits.
With financial health improving, investors’ confidence in PSUs has returned.
Since banks are the backbone of financing infrastructure projects, their revival further fuels the rally.
2.3 Defence & Strategic Importance
Global geopolitical tensions have increased defence spending worldwide. India, too, is focusing on self-reliance in defence (Atmanirbhar Bharat).
Companies like HAL, BEL, Mazagon Dock, Cochin Shipyard have seen massive order inflows.
Defence PSUs are reporting strong earnings and full order books for the next decade.
The export market is also opening up—India is now exporting defence equipment to friendly nations.
This has turned defence PSUs into multi-baggers in recent years.
2.4 Disinvestment & Privatisation Story
For years, the government has been trying to monetise and privatise PSU assets.
Strategic sales like Air India have boosted sentiment.
LIC IPO brought renewed attention to PSU space.
The market believes future disinvestments (BPCL, Shipping Corporation, etc.) can unlock hidden value.
This narrative has created speculative interest, which supports price rallies.
2.5 Dividend Yield Attraction
Many PSU companies offer very high dividend yields (4–8%), much higher than bank deposits.
In times of global uncertainty, foreign investors look for safe, stable income—PSUs fit this profile. When combined with growth in earnings, dividend-paying PSUs become doubly attractive.
2.6 Railways & Infra Boom
Railway-linked stocks like RVNL, IRCON, IRFC, RailTel have been some of the biggest gainers.
Indian Railways is undergoing modernization at an unprecedented scale.
Projects like Vande Bharat trains, electrification, freight corridors, and station redevelopment are attracting massive investments.
These companies are reporting record order books.
This has triggered a railways mini-rally within the broader infrastructure rally.
2.7 Global Factors
Global trends are also playing a role:
China+1 Strategy: Many global companies are diversifying away from China, boosting demand for Indian infrastructure.
Commodity Cycle: Steel, cement, and energy cycles support infra companies’ growth.
Geopolitical Risks: Investors view India as a safe growth story compared to volatile markets.
3. Investor Psychology Behind the Rally
The PSU & Infrastructure rally is not just about fundamentals—it’s also about changing perceptions.
Earlier: Investors believed PSUs = inefficient + slow-moving.
Now: Investors see them as undervalued, dividend-paying, and backed by government growth plans.
Retail investors, especially in India, have driven momentum. With railway and defence PSUs showing 10x to 20x returns in a few years, fear of missing out (FOMO) has pulled in more buyers.
4. Risks & Challenges in PSU & Infra Rally
No rally is risk-free. Investors must remain aware of challenges:
Government Interference – PSU companies may prioritize social objectives over profits.
Cyclical Nature – Infra and PSU rallies depend heavily on government spending; if budgets tighten, growth may slow.
Execution Delays – Infra projects face land acquisition, legal, and environmental delays.
Global Slowdown – If global demand weakens, exports and commodity-linked infra stocks may suffer.
Valuation Concerns – Many PSU stocks have already rallied 200–500%. At some point, valuations may look stretched.
5. Future Outlook
Despite risks, the outlook for PSU & Infrastructure remains structurally positive:
India aims to become a $5 trillion economy—this is impossible without strong infra.
The government’s focus on Make in India, Atmanirbhar Bharat, and Defence exports supports PSU companies.
Digital infrastructure (5G rollout, Smart Cities) creates new opportunities.
Renewable energy push (solar, wind, hydro) benefits power PSUs like NTPC, NHPC.
In short, this is not just a short-term rally—it is a structural growth story with long-term potential.
6. How Investors Can Approach This Rally
For investors, the key is to approach with strategy and caution:
Focus on Leaders – Instead of chasing every PSU, stick to strong companies with robust fundamentals (SBI, NTPC, BEL, HAL, RVNL, L&T).
Look for Long-Term Themes – Defence, railways, power transmission, renewable energy are structural stories.
Dividend + Growth Combo – PSUs with both high dividend yields and growth potential are safer bets.
Avoid Overvaluation – Don’t enter after massive rallies; wait for corrections.
Diversify – Mix infra PSUs with private players (like L&T, Adani Ports) to reduce risk.
7. Case Studies of Recent Winners
7.1 Hindustan Aeronautics Ltd (HAL)
Once ignored, HAL is now a defence giant with export opportunities.
Stock has given 10x returns in 5 years.
7.2 Rail Vikas Nigam Ltd (RVNL)
Benefited from railway modernization.
Stock surged over 20x from 2020–2025.
7.3 SBI & Other PSU Banks
Recovered from NPAs.
Posting record profits, stock prices doubled/tripled.
7.4 NTPC & Power Grid
Benefiting from India’s massive renewable energy targets.
Stable dividend + growth.
These examples show why the rally has captured public attention.
8. Conclusion
The PSU & Infrastructure Rally is one of the most defining themes in the Indian stock market in recent years. What began as a quiet recovery in undervalued PSU banks and infra companies has turned into a full-blown rally fueled by:
Government capex push,
Defence modernization,
Railway expansion,
Revival of PSU banks,
Strong dividend yields,
Disinvestment hopes.
The rally has redefined investor sentiment towards PSUs, turning them from neglected assets into market favorites.
That said, investors must remain mindful of risks—government policies, project delays, or global slowdowns can temporarily derail the momentum.
But structurally, the story remains strong: India’s journey to a $5 trillion economy cannot happen without PSU & infrastructure growth. For long-term investors, this space offers both stability and growth potential—a rare combination.

Trading Master Class With ExpertsRisk and Reward in Options
Options provide defined risk for buyers and potential risk for sellers:
Buyers: Maximum loss = premium paid, profit = theoretically unlimited for calls, limited for puts.
Sellers (writers): Maximum profit = premium received, risk = potentially unlimited for uncovered calls, high for puts.
Example:
Selling a call without owning the stock (naked call) can lead to unlimited losses if the stock skyrockets.
Buying a put limits risk but can still profit from sharp downward moves.
Hedging with Options
Options are a powerful tool for hedging investments:
Protective Put: Buying a put on a stock you own protects against a decline.
Collar Strategy: Buy a put and sell a call to limit both upside and downside risk.
Portfolio Insurance: Large investors use index options to protect portfolios during market volatility.

Risk Management in Trading1. Introduction: Why Risk Management Matters
Trading in the stock market, forex, commodities, or crypto can be exciting. The charts move, opportunities appear every second, and profits can be made quickly. But at the same time, losses can also come just as fast. Many traders, especially beginners, enter the market thinking only about profits. They study chart patterns, indicators, or even copy trades from others. But what most ignore at the beginning is the one factor that separates successful traders from unsuccessful ones: Risk Management.
Risk management is not about how much profit you make; it’s about how well you protect your money when things go wrong. Trading is not about being right every time. Even the best traders in the world lose trades. What makes them profitable is that their losses are controlled and their winners are allowed to grow.
Without risk management, even the best strategy will eventually blow up your account. With risk management, even an average strategy can keep you in the game long enough to learn, improve, and grow your capital.
2. What is Risk Management in Trading?
Risk management in trading simply means the process of identifying, controlling, and minimizing the amount of money you could lose on each trade.
It’s not about avoiding risk completely (that’s impossible in trading). Instead, it’s about managing risk in such a way that:
No single trade can wipe out your account.
You survive long enough to take advantage of future opportunities.
You build consistency over time instead of gambling.
Think of trading like driving a car. Speed (profits) is fun, but brakes (risk management) keep you alive.
3. The Golden Rule of Trading: Protect Your Capital
The first rule of trading is simple: Don’t lose all your money.
If you lose 100% of your capital, you are out of the game forever.
Here’s the reality of losses:
If you lose 10% of your account, you need 11% profit to recover.
If you lose 50%, you need 100% profit to recover.
If you lose 90%, you need 900% profit to recover.
This shows how dangerous big losses are. The more you lose, the harder it becomes to get back to break-even. That’s why smart traders focus less on “How much profit can I make?” and more on “How much loss can I tolerate?”
4. Key Elements of Risk Management
Let’s go step by step through the major pillars of risk management in trading:
a) Position Sizing
This is about deciding how much money to risk in a single trade. A common rule is:
Never risk more than 1–2% of your account on one trade.
Example:
If your account size is ₹1,00,000 and you risk 1% per trade → maximum loss allowed = ₹1,000.
This way, even if you lose 10 trades in a row (which happens sometimes), you’ll still have 90% of your capital left.
b) Stop Loss
A stop loss is a price level where you accept that your trade idea is wrong and you exit automatically.
Without a stop loss, emotions take over. Traders hold losing trades, hoping they’ll turn profitable, but often the losses grow bigger.
Always set a stop loss before entering a trade.
Respect it. Don’t move it further away.
Example:
If you buy a stock at ₹500, you might set a stop loss at ₹480. If price drops to ₹480, your loss is controlled, and you live to trade another day.
c) Risk-to-Reward Ratio
Before entering any trade, ask yourself: Is the reward worth the risk?
If your stop loss is ₹100 away, your target should be at least ₹200 away. That’s a 1:2 risk-to-reward ratio.
Why is this important?
Because even if you win only 40% of your trades, you can still be profitable with a good risk-to-reward system.
Example:
Risk ₹1,000 per trade, aiming for ₹2,000 reward.
Out of 10 trades:
4 winners = ₹8,000 profit
6 losers = ₹6,000 loss
Net profit = ₹2,000
This shows you don’t need to win every trade. You just need to control losses and let winners run.
d) Diversification
Don’t put all your money in one stock, sector, or asset. Spread your risk.
If one trade goes bad, others can balance it.
Avoid overexposure in correlated assets (like buying 3 IT stocks at once).
e) Avoiding Over-Leverage
Leverage allows you to control big positions with small money. But leverage is a double-edged sword: it multiplies both profits and losses.
Beginners often blow accounts using high leverage. Rule of thumb:
Use leverage cautiously.
Never take a position so big that one wrong move wipes out your account.
5. Psychological Side of Risk Management
Risk management is not only about numbers; it’s also about mindset and discipline.
Greed makes traders risk too much for quick profits.
Fear makes them close trades too early or avoid good opportunities.
Revenge trading happens after a loss, when traders try to win it back immediately by increasing position size. This often leads to bigger losses.
Good risk management keeps emotions under control. When you know that your maximum loss is limited, you trade with a calm mind.
6. Practical Risk Management Techniques
Here are some practical tools and methods traders use:
Fixed % Risk Model – Always risk a fixed percentage (like 1% per trade).
Fixed Amount Risk Model – Always risk a fixed rupee amount (like ₹500 per trade).
Trailing Stop Loss – Adjusting stop loss as price moves in your favor, to lock in profits.
Daily Loss Limit – Stop trading for the day if you lose a set amount (say 3% of account). This prevents emotional overtrading.
Portfolio Heat – Total risk across all open trades should not exceed 5–6% of account.
7. Common Mistakes Traders Make in Risk Management
Not using stop losses.
Risking too much in one trade.
Moving stop losses further away to “give trade more room.”
Trading with borrowed money.
Doubling position after a loss (“martingale” strategy).
Ignoring position sizing.
These mistakes often lead to blown accounts.
8. Case Studies
Case 1: Trader Without Risk Management
Rahul has ₹1,00,000. He risks ₹20,000 in one trade (20% of account). If he loses 5 trades in a row, his account goes to zero. Game over.
Case 2: Trader With Risk Management
Anita has ₹1,00,000. She risks only 1% per trade (₹1,000). Even if she loses 10 trades in a row, she still has ₹90,000 left to keep trading and learning.
Who will survive longer? Anita.
And survival is the key in trading.
9. Risk Management Beyond Single Trades
Risk management is not only about one trade, but also about your whole trading career:
Set Monthly Risk Limits → e.g., stop trading if you lose 10% in a month.
Keep Emergency Funds → Never put all life savings into trading.
Withdraw Profits → Don’t leave all profits in the trading account. Take some out regularly.
Review Trades → Keep a trading journal to learn from mistakes.
10. The Connection Between Risk Management & Consistency
Consistency is what separates professionals from gamblers. Professional traders don’t look for a “big jackpot trade.” Instead, they look for consistent growth.
Risk management provides that consistency by:
Preventing big drawdowns.
Allowing small steady growth.
Giving confidence in the system.
Trading is like running a business. Risk management is your insurance policy. No business survives without managing costs and risks.
Final Thoughts
Risk management may not sound exciting compared to finding “hot stocks” or “sure-shot trades.” But in reality, it’s the most important part of trading.
Think of it this way:
Strategies may come and go.
Indicators may change.
Markets may behave differently.
But risk management principles stay the same.
The traders who last years in the market are not the ones who find secret formulas. They are the ones who respect risk.
If you master risk management, you can survive long enough to improve, adapt, and eventually succeed. Without it, no matter how smart or lucky you are, the market will take your money.
Indicators & Oscillators in Trading1. Introduction
In the world of financial markets, traders are constantly searching for ways to gain an edge. While fundamental analysis looks at company earnings, news, and economic trends, technical analysis focuses on price action, patterns, and market psychology.
At the core of technical analysis lie Indicators and Oscillators. These are mathematical calculations based on price, volume, or both, designed to give traders insights into the direction, momentum, strength, or volatility of a market.
In simple words, Indicators help you see the invisible — they take raw price data and transform it into something more structured, often plotted on a chart to highlight opportunities. Oscillators, on the other hand, are a special category of indicators that move within a fixed range (like 0 to 100), helping traders identify overbought and oversold conditions.
Understanding them is crucial because they:
Improve trade timing.
Help confirm signals.
Prevent emotional decision-making.
Allow traders to recognize trends earlier.
2. What Are Indicators?
Indicators are mathematical formulas applied to a stock, forex pair, commodity, or index to make market data easier to interpret.
For example, a simple indicator is the Moving Average. It takes the average of closing prices over a set number of days and smooths out fluctuations. This makes it easier to see the underlying trend.
Indicators can be broadly categorized into two groups:
Leading Indicators – Predict future price movements.
Example: Relative Strength Index (RSI), Stochastic Oscillator.
These give signals before the trend actually changes.
Lagging Indicators – Confirm existing price movements.
Example: Moving Averages, MACD.
They follow price action and confirm that a trend has started or ended.
3. What Are Oscillators?
Oscillators are a subcategory of indicators that fluctuate within a defined range. For example, the RSI ranges from 0 to 100, while the Stochastic Oscillator ranges from 0 to 100 as well.
Traders use oscillators to identify:
Overbought conditions (when prices may be too high and due for correction).
Oversold conditions (when prices may be too low and due for a bounce).
The key difference between indicators and oscillators is that while all oscillators are indicators, not all indicators are oscillators. Oscillators usually appear in a separate window below the price chart.
4. Types of Indicators
Indicators can be classified based on their purpose:
A. Trend Indicators
These show the direction of the market.
Moving Averages (SMA, EMA, WMA)
MACD (Moving Average Convergence Divergence)
ADX (Average Directional Index)
B. Momentum Indicators
These measure the speed of price movements.
RSI (Relative Strength Index)
Stochastic Oscillator
CCI (Commodity Channel Index)
C. Volatility Indicators
These show how much prices are fluctuating.
Bollinger Bands
ATR (Average True Range)
Keltner Channels
D. Volume Indicators
These use traded volume to confirm price moves.
OBV (On-Balance Volume)
VWAP (Volume Weighted Average Price)
Chaikin Money Flow
5. Popular Indicators Explained
Let’s break down some of the most commonly used indicators:
5.1 Moving Averages
Simple Moving Average (SMA): Average of closing prices over a period.
Exponential Moving Average (EMA): Gives more weight to recent data, reacts faster.
Use: Identify trend direction, support, and resistance.
Example: If the 50-day EMA crosses above the 200-day EMA (Golden Cross), it’s a bullish signal.
5.2 MACD (Moving Average Convergence Divergence)
Consists of two EMAs (usually 12-day and 26-day).
A signal line (9-day EMA of MACD) generates buy/sell signals.
Use: Trend-following, momentum strength.
Example: When MACD crosses above signal line → Buy signal.
5.3 RSI (Relative Strength Index)
Range: 0 to 100.
Above 70 = Overbought.
Below 30 = Oversold.
Use: Identify reversals, divergence signals.
Example: RSI above 80 in a strong uptrend may still rise, so context matters.
5.4 Stochastic Oscillator
Compares a closing price to a range of prices over a period.
Range: 0 to 100.
Signals:
Above 80 = Overbought.
Below 20 = Oversold.
Special feature: Generates crossovers between %K and %D lines.
5.5 Bollinger Bands
Consist of a moving average and two standard deviation bands.
Bands expand during volatility, contract during consolidation.
Use:
Price near upper band = Overbought.
Price near lower band = Oversold.
5.6 Average True Range (ATR)
Measures volatility, not direction.
Higher ATR = High volatility.
Lower ATR = Low volatility.
Use: Set stop-loss levels, position sizing.
5.7 OBV (On-Balance Volume)
Combines price movement with volume.
Rising OBV = buyers in control.
Falling OBV = sellers in control.
6. Combining Indicators
No single indicator is perfect. Traders often combine two or more indicators to filter false signals.
Example Strategies:
RSI + Moving Average: Identify oversold conditions only if price is above the moving average (trend filter).
MACD + Bollinger Bands: Use MACD crossover as entry, Bollinger Band touch as exit.
Volume + Trend Indicator: Confirm trend direction with volume support.
7. Advantages of Using Indicators & Oscillators
Clarity – Simplifies raw data into easy-to-read signals.
Discipline – Reduces emotional trading.
Confirmation – Supports price action with mathematical evidence.
Adaptability – Works across stocks, forex, commodities, crypto.
8. Limitations
Lagging nature: Most indicators follow price, not predict it.
False signals: Especially in sideways markets.
Over-reliance: Blind faith in indicators leads to losses.
Conflicting results: Different indicators may show opposite signals.
9. Best Practices for Traders
Keep it simple: Use 2–3 reliable indicators instead of clutter.
Understand context: RSI at 80 in a strong bull run may not mean “sell.”
Combine with price action: Indicators are tools, not replacements for reading charts.
Backtest strategies: Always test on historical data before applying in live trades.
Adapt timeframe: What works in daily charts may not work in 5-minute charts.
10. Real-World Example
Suppose a trader is analyzing Nifty 50 index:
50-day EMA is above 200-day EMA → Trend is bullish.
RSI is at 65 → Market is not yet overbought.
OBV is rising → Strong buying volume.
Bollinger Bands are expanding → High volatility.
Conclusion: Strong bullish momentum. Trader may enter long with stop-loss below 200-day EMA.
Conclusion
Indicators & Oscillators are like navigation tools for traders. They don’t guarantee profits but improve decision-making, discipline, and timing. The real skill lies in knowing when to trust them, when to ignore them, and how to combine them with price action and market context.
To master them:
Learn their math and logic.
Practice on historical charts.
Combine with market structure analysis.
Keep evolving as markets change.
A professional trader treats indicators not as magical prediction machines, but as assistants in understanding market psychology.
Part 1 Master Candle Sticks PatternRisk Management in Options
Position Sizing: Don’t risk more than 1–2% of capital in one trade.
Stop Loss: Exit before premium erodes completely.
Avoid Over-leverage: Options look cheap but risk is real.
Hedge Positions: Combine with futures or other options.
Psychology of Option Traders
Greed: Chasing high-return trades without risk control.
Fear of Missing Out (FOMO): Jumping in near expiry due to excitement.
Patience: Waiting for correct setup is key.
Discipline: Stick to rules, avoid revenge trading.
Modern Trends in Option Trading
Weekly Expiry Craze: Thursday = biggest trading day.
0DTE (Zero Day to Expiry) Options: Popular for scalping.
Algo & AI Trading: Automated strategies now dominate.
Retail Participation Explosion: India has seen retail option traders grow 5x in 3 years.

Paer 6 Learn Institutional Trading Options Trading Strategies
Basic Strategies
Long Call → Buy call, bullish.
Long Put → Buy put, bearish.
Covered Call → Own stock + sell call for income.
Protective Put → Own stock + buy put for protection.
Intermediate Strategies
Straddle: Buy Call + Put at same strike (bet on volatility).
Strangle: Buy Call (higher strike) + Put (lower strike).
Bull Call Spread: Buy low strike call + sell higher strike call.
Bear Put Spread: Buy put + sell lower strike put.
Advanced Strategies
Iron Condor: Range-bound strategy selling OTM call + put spreads.
Butterfly Spread: Profit from low volatility near strike.
Ratio Spreads: Adjust risk/reward with multiple options.
Margin Requirements & Leverage
Option buyers: Pay only premium (small capital).
Option sellers (writers): Need large margin (higher risk).
NSE SPAN + Exposure margin system determines requirements.
For example, selling 1 lot of Bank Nifty option may require ₹1.5–2 lakh margin depending on volatility.

Part 2 Ride The Big MovesOption Premium & Pricing (The Greeks Simplified)
Premium depends on:
Intrinsic Value = difference between spot & strike.
Time Value = extra value based on time to expiry & volatility.
The Greeks explain sensitivity of option price:
Delta: Sensitivity to underlying price.
Theta: Time decay (options lose value as expiry nears).
Vega: Sensitivity to volatility.
Gamma: Rate of change of Delta.
For example, Indian traders often notice how Bank Nifty weekly options lose value rapidly on expiry day (Theta decay)—which is why option sellers make money on “expiry day trading.”
Types of Options in India
Index Options – Nifty 50, Bank Nifty, FinNifty (most liquid).
Stock Options – Individual companies like Reliance, TCS, HDFC Bank.
Currency Options – USD/INR, EUR/INR (for forex hedging).

Risk Management & Trading PsychologyIntroduction
In the world of trading—whether it’s stocks, forex, commodities, crypto, or derivatives—success is rarely determined by who has the most “secret” indicator or complex algorithm. Instead, it often comes down to two invisible forces:
Risk Management – the discipline of protecting capital and minimizing losses.
Trading Psychology – the mindset, emotions, and discipline that shape decision-making.
Many traders fail not because they lack knowledge, but because they lack the discipline to follow rules and the mental strength to handle stress, uncertainty, and losses. In fact, the famous trader Mark Douglas once said:
“Trading is not about being right. It’s about managing money so you can stay in the game.”
This guide will dive deeply into both pillars—Risk Management and Trading Psychology—because they are interconnected. Even the best strategy collapses without them.
Part 1: Risk Management in Trading
1.1 What is Risk Management?
Risk management is the process of identifying, assessing, and controlling risks in trading to protect your capital. It’s about ensuring that no single trade or series of trades can wipe you out.
It is not about avoiding risk completely (impossible in trading) — it’s about controlling and managing it wisely.
1.2 Why Risk Management is the Foundation of Trading
Most traders obsess over entries, patterns, and indicators. But professional traders focus first on capital preservation. Without proper risk control:
You can lose big on a single trade.
Emotions take over after large losses.
Recovery becomes exponentially harder.
Example:
If you lose 50% of your capital, you need a 100% return just to break even. That’s why avoiding large drawdowns is critical.
1.3 Core Principles of Risk Management
Let’s break them down.
A) Position Sizing
Determine the amount of capital allocated to each trade.
Common rule: Risk 1-2% of account equity per trade.
Formula:
Position Size = (Account Risk per Trade) / (Stop Loss in Points × Value per Point)
B) Stop Losses
A stop loss is a predefined exit point to cap losses.
Never move your stop loss further away because of “hope.”
Types:
Hard Stop – placed in the market.
Mental Stop – not placed in system, but requires discipline.
C) Risk-Reward Ratio
Compares potential reward to risk.
Professional traders often aim for R:R of 1:2 or higher.
Even with a win rate of 40%, a good R:R can make you profitable.
D) Diversification
Don’t put all capital in one asset or sector.
Spread exposure to reduce the impact of one bad move.
E) Avoid Overleveraging
Leverage amplifies both gains and losses.
Many accounts blow up because traders use excessive leverage.
1.4 Advanced Risk Management Concepts
A) Maximum Drawdown Limit
Set a personal limit (e.g., 15% of total equity). Stop trading if hit, review strategy, and reassess.
B) Kelly Criterion
Mathematical formula for optimal bet sizing based on win probability and payoff ratio.
C) Volatility-Based Position Sizing
Adjust trade size based on market volatility (e.g., ATR – Average True Range).
D) Hedging
Using related instruments to offset risk (e.g., buying gold when stocks are falling).
1.5 Common Risk Management Mistakes
No stop loss – leads to catastrophic losses.
Overtrading – too many positions at once increases risk exposure.
Risking too much on one trade – emotional pressure skyrockets.
Averaging down – adding to losing positions without a plan.
Ignoring correlation – multiple trades moving in the same direction increase risk.
Part 2: Trading Psychology
2.1 Why Psychology Matters in Trading
In theory, trading is simple—buy low, sell high. In reality, human emotions complicate the process:
Fear causes you to exit early.
Greed makes you overtrade.
Hope keeps you in losing trades.
Overconfidence leads to oversized bets.
The market doesn’t just test your strategy—it tests your patience, discipline, and emotional control.
2.2 Core Psychological Challenges in Trading
A) Fear
Fear of losing money → hesitation to enter.
Fear of missing out (FOMO) → chasing bad trades.
B) Greed
Leads to ignoring rules and overtrading.
Causes traders to hold winning trades too long.
C) Revenge Trading
After a loss, trying to “win it back” quickly leads to more mistakes.
D) Overconfidence
Winning streaks create a false sense of invincibility.
Causes overleveraging and sloppy risk management.
2.3 Building the Right Trading Mindset
A) Process over Outcome
Focus on following your trading plan, not just profit and loss.
B) Emotional Detachment
Think of trades as numbers and probabilities, not personal victories or failures.
C) Patience
Wait for high-probability setups rather than forcing trades.
D) Adaptability
Markets change—strategies need adjustment. Avoid rigid thinking.
2.4 Psychological Tools for Traders
A) Journaling
Record every trade: entry, exit, reason, emotions.
Review regularly to spot patterns.
B) Meditation & Mindfulness
Reduces impulsive decisions.
Improves focus.
C) Pre-Trade Routine
Check news, review charts, set risk levels before entering.
D) Post-Trade Review
Learn from both wins and losses.
2.5 How Risk Management and Psychology Connect
Strong risk management reduces emotional pressure.
Smaller losses keep confidence intact.
Knowing your worst-case scenario is limited allows you to follow the plan calmly.
Part 3: Combining Risk Management & Psychology into a Trading Plan
3.1 Components of a Trading Plan
Strategy rules – when to enter/exit.
Risk per trade – fixed % of capital.
Max daily/weekly loss – stop trading after hitting it.
Review schedule – weekly/monthly performance check.
Psychological rules – avoid trading under stress or fatigue.
3.2 Example: Professional Approach
Let’s say a trader has:
Account: ₹10,00,000
Risk per trade: 1% (₹10,000)
Stop loss: 20 points × ₹500 per point = ₹10,000
Risk-Reward ratio: 1:2 (₹10,000 risk for ₹20,000 potential gain)
Even with a 40% win rate, the trader can remain profitable.
3.3 The 3 Golden Rules
Preserve capital – your first goal is to survive.
Follow the plan – consistency beats luck.
Manage yourself – discipline is your ultimate edge.
Conclusion
Risk management and trading psychology are the true edge in markets.
You can copy someone’s strategy, but you can’t copy their discipline or mindset. A trader with average technical skills but strong risk control and emotional discipline will outperform a brilliant analyst who cannot manage losses or emotions.
The market will always test you. The question is—will you react emotionally, or will you act according to your plan?
Mastering both risk management and psychology ensures that no matter what the market throws your way, you will still be standing, ready for the next opportunity.

Psychology & Risk Management in Trading 1. Introduction
Trading is often thought of as a purely numbers-driven game — charts, technical indicators, fundamental analysis, and economic data. But in reality, the true battlefield is inside your head. Two traders can have access to the exact same market data, yet end up with completely different results. The difference lies in psychology and risk management.
Psychology determines how you make decisions under pressure.
Risk management determines whether you survive long enough to benefit from good decisions.
Think of trading as a three-legged stool:
Strategy – Your technical/fundamental system for entering and exiting trades.
Psychology – Your ability to stick to the plan under real conditions.
Risk Management – Your safeguard against catastrophic loss.
If one leg is missing, the stool collapses. A profitable strategy without psychological discipline becomes useless. A strong mindset without proper risk controls eventually faces ruin. And perfect risk management without skill or discipline simply results in slow losses.
Our goal here is to align mindset with money management for long-term success.
2. Understanding Trading Psychology
2.1. Why Psychology Matters More Than You Think
When you’re trading, money is not just numbers — it represents:
Security (fear of losing it)
Freedom (desire to win more)
Ego (feeling smart or dumb based on market outcomes)
This emotional attachment creates mental biases that cloud judgment. Unlike a chessboard, the market is an uncertain game — the same move can lead to a win or loss depending on external forces beyond your control.
The primary enemy is not “the market,” but you:
Closing winning trades too early out of fear.
Holding onto losing trades hoping they’ll recover.
Overtrading to “make back” losses.
Avoiding valid setups after a losing streak.
2.2. The Main Psychological Biases in Trading
1. Loss Aversion
Humans hate losing more than they like winning. Research shows losing $100 feels twice as bad as gaining $100 feels good.
In trading, this causes:
Refusing to take stop losses.
Adding to losing positions to “average down.”
2. Overconfidence Bias
After a streak of wins, traders often overestimate their skill.
Example: Turning a $1,000 account into $2,000 in a week might lead to doubling trade size without a valid reason.
3. Confirmation Bias
Seeking only information that supports your existing view. If you’re bullish on gold, you might only read bullish news and ignore bearish signals.
4. Recency Bias
Giving too much weight to recent events. A trader who just experienced a big rally might expect it to continue, ignoring long-term resistance levels.
5. Fear of Missing Out (FOMO)
Jumping into trades without proper analysis because you see the market moving.
6. Revenge Trading
Trying to “get back” at the market after a loss by taking impulsive trades.
2.3. Emotional States and Their Effects
Fear – Leads to hesitation, missed opportunities, and premature exits.
Greed – Leads to over-leveraging and chasing setups.
Hope – Keeps traders in losing trades far longer than necessary.
Regret – Causes paralysis, stopping you from entering new opportunities.
Euphoria – False sense of invincibility, leading to reckless trades.
3. Mastering the Trader’s Mindset
3.1. Accepting Uncertainty
Markets are probabilistic, not certain. The best trade setups still lose sometimes. The key is to think in terms of probabilities, not certainties.
Mental shift:
Bad trade ≠ losing trade.
Good trade ≠ winning trade.
A “good trade” is one where you followed your plan and managed risk — regardless of the outcome.
3.2. Developing Discipline
Discipline means doing what your trading plan says every time, even when you feel like doing otherwise.
Practical ways to build discipline:
Pre-market checklist (entry/exit rules, risk per trade, market conditions).
Post-trade review to identify emotional decisions.
Simulated trading to practice following rules without monetary pressure.
3.3. Managing Emotional Cycles
Traders often go through repeated emotional phases:
Excitement – New strategy, first wins.
Euphoria – Overconfidence and overtrading.
Fear/Panic – Sharp drawdown after reckless trades.
Desperation – Trying to recover losses quickly.
Resignation – Stepping back, reevaluating.
Rebuilding – Adopting better discipline.
Your goal is to flatten the cycle, reducing extreme highs and lows.
4. Risk Management: The Survival Mechanism
4.1. The Goal of Risk Management
Trading is not about avoiding losses — losses are inevitable. The aim is to control the size of your losses so they don’t destroy your capital or confidence.
4.2. The Three Pillars of Risk Management
1. Position Sizing
Determine how much capital to risk per trade. Common rules:
Risk only 1–2% of total capital on any single trade.
Example: If you have ₹1,00,000 and risk 1% per trade, your max loss is ₹1,000.
2. Stop Losses
Predetermined exit points to limit losses.
Hard stops – Fixed at a price level.
Trailing stops – Move with the trade to lock in profits.
3. Risk-Reward Ratio
A measure of potential reward vs. risk.
Example:
Risk: ₹500
Potential Reward: ₹1,500
R:R = 1:3 (good)
4.3. The Power of Capital Preservation
Here’s why big losses are dangerous:
Lose 10% → Need 11% gain to recover.
Lose 50% → Need 100% gain to recover.
The bigger the loss, the harder the comeback. Capital preservation should be your #1 priority.
4.4. Avoiding Overleveraging
Leverage magnifies both gains and losses. Many traders blow accounts not because their strategy was bad, but because they used excessive leverage.
5. Integrating Psychology with Risk Management
5.1. The Feedback Loop
Poor psychology → Poor risk decisions → Bigger losses → Worse psychology.
You must break the loop by locking in good risk rules before trading.
5.2. The Risk Management Mindset
Treat each trade as just one of thousands you’ll make.
Focus on execution quality, not daily P/L.
Celebrate following your plan, not just winning.
5.3. Journaling
A trading journal should include:
Entry/exit points and reasons.
Risk per trade.
Emotional state before/during/after.
Lessons learned.
Over time, patterns emerge that reveal weaknesses in both mindset and risk control.
6. Practical Tips for Building Psychological Strength
Meditation & Mindfulness – Keeps emotions in check.
Physical Health – A healthy body supports a calm mind.
Sleep – Fatigue increases impulsive decisions.
Routine – Structured trading hours reduce stress.
Detach from P/L – Judge performance over months, not days.
7. Case Studies: When Psychology Meets Risk
Case Study 1 – The Overconfident Scalper
Wins 10 trades in a row, doubles position size.
One loss wipes out previous gains.
Lesson: Stick to fixed risk % per trade regardless of winning streaks.
Case Study 2 – The Hopeful Investor
Holds losing position for months.
Avoids taking stop loss because “it’ll recover.”
Lesson: Hope is not a strategy; use predefined exits.
8. Conclusion
Trading success is 20% strategy and 80% mindset + risk control. The market will always test your patience, discipline, and emotional control. By mastering your psychology and implementing rock-solid risk management, you give yourself the best chance not just to make money — but to stay in the game long enough to grow it.

Elliott Waves Insights: Tesla’s Roadmap to SuccessHello friends, let's analyze Tesla's chart using theory. This is a 4-hour chart where we can clearly see that the higher degree, primary degree wave ((3)) in black has been completed. Currently, we're on the verge of completing wave ((4)) in black of the primary degree, which has three subdivisions marked in blue as (A), (B) & (C).
(A) and (B) are completed, and (C) is near completion. Within (C), we have five subdivisions in red, of which 1, 2, 3, & 4 are completed, and the 5th is also more than 60% complete. Once the red fifth is complete, it will mark the end of blue (C) and primary degree wave ((4)) in black.
As soon as wave ((4)) is complete, we can expect a reversal, which should be wave ((5)). Which should cross the high of wave ((3)) which is ATH, So, we're expecting wave ((5)) to start move upwards.
Now, friends, what's the invalidation level for this view? It's $139.20. This is a level that wave ((4)) should not cross, as it's the low of black wave ((2)). According to theory, wave 2 cannot retrace more than 100% of wave 1, wave 3 cannot be the shortest in impulse, and wave 4 cannot enter the territory of wave 1, which is here we’re witnessing in current scenario, which is considering we’re in any diagonal or triangle of higher degree.
If wave ((4)) crosses $139.20, it will invalidate our view. We might be missing some dots to join or create the picture perfectly. Currently, the price is around $222, and we might see a small bounce before making a lower low possibly around $200. If we witness a divergence there, it could lead to a reversal.
Please note that this study uses theory and structures, involves multiple possibilities, and focuses on one potential scenario. There's a risk of being completely wrong. This is for educational purposes only, and users should not trade or invest solely based on this study.
I am not Sebi registered analyst.
My studies are for educational purpose only.
Please Consult your financial advisor before trading or investing.
I am not responsible for any kinds of your profits and your losses.
Hope this post is helpful to community
Thanks
RK💕
Disclaimer and Risk Warning.
The analysis and discussion provided on in.tradingview.com/u/RK_Charts/ is intended for educational purposes only and should not be relied upon for trading decisions. RK_Charts is not an investment adviser and the information provided here should not be taken as professional investment advice. Before buying or selling any investments, securities, or precious metals, it is recommended that you conduct your own due diligence. RK_Charts does not share in your profits and will not take responsibility for any losses you may incur. So Please Consult your financial advisor before trading or investing.

Possible Wave counts of TSLA Hourly & DailyDaily Time Frame Chart
I am not Sebi registered analyst.
My studies are for educational purpose only.
Please Consult your financial advisor before trading or investing.
I am not responsible for any kinds of your profits and your losses.
Most investors treat trading as a hobby because they have a full-time job doing something else.
However, If you treat trading like a business, it will pay you like a business.
If you treat like a hobby, hobbies don't pay, they cost you...!
Hope this post is helpful to community
Thanks
RK💕
Disclaimer and Risk Warning.
The analysis and discussion provided on in.tradingview.com/u/RK_Charts/ is intended for educational purposes only and should not be relied upon for trading decisions. RK_Charts is not an investment adviser and the information provided here should not be taken as professional investment advice. Before buying or selling any investments, securities, or precious metals, it is recommended that you conduct your own due diligence. RK_Charts does not share in your profits and will not take responsibility for any losses you may incur. So Please Consult your financial advisor before trading or investing.

Tesla Next Target is Top of the Channel +26% ROITesla, a Breakout occurred from the Triangle Pattern after reaching the 0.5 Fibonacci Retracement level, and it's also trading within a Channel Pattern. The Next Target is the Top of the Channel.

TESLA - Best Opportunity for Long Term InvestmentPrice is at extreme discount and provides opportunity for long term investment.
Price can violate the low around 101 and immediately target the buyside liquidity above 300.
Price may also fail to violate the sellside liquidity around 101 and continue higher indicating a failure swing reversal.
Both the scenario indicates bullishness in TESLA.

Long Tesla for target of 325 to 350Tesla is getting ready for a move and currently forming flag and pole pattern on weekly charts. In case it breaks out of this pattern on upper side then targets on weekly charts are
T1 - 300
T2 - 325
T3 - 350
Stop loss 190 on closing basis (weekly)
Happy Trading !

Tesla Nearing its bottom - AccumulateTesla formed a Head and Shoulder pattern on charts and have fallen from 222 to 140 already.
Its nearing the bottom and currently at first support level. The support levels are marked on the charts. $118 is strong support if it continues to fall further.
Recommendation is to start accumulating the shares in small quantity from now.

Tesla Cup & Handle PatternBeautiful Cup & Handle Pattern is formed on chart.
Entry
We can go long when price breakouts with strong bullish candle above the neckline of the pattern.
Stoploss
We can keep stoploss below the neckline.
Target
Target will be same as depth of the cup as marked on chart
Please Like and Follow me.

Tesla going to 100 usdAs stock and crypto are in a bear market, Tesla is no exception to the rule. In fact, it seems like the fall is excellerating faster, which is indicated by Fetch Trends. The strength of the trend is visualized by the change in colors, giving this chart this gradient.
With the SPX hitting resistance, and Tesla breaking support, 100 USD is the next obvious target for Tesla. Now why is this obvious? The next support lines are created by the previous support and resistance lines, created in Juli 2020. Old resistance becomes new support.

Evrything happened exactly as i postedPrice respected all my levels which I've drew earlier, if you took short trade at my exite level for long so you are still in profit...
